
Executive Summary
Correlation statistics are measures commonly used to evaluate the relationship between two variables. Asset classes often exhibit different performance tendencies over time. During market rallies or drawdowns some assets may outperform each other in different ways. These relationships can help reduce volatility across market cycles for diversified investment portfolios. This is also the case for the various types of insurance products sold by U.S. Property and Casualty insurance companies, which often have divergent claims development and loss cost characteristics over time. Moreover, assets and liabilities for P&C insurers usually do not behave in a uniform way, supporting diversification at the enterprise level as well.
This discussion provides an update to a correlation study done in 2017.1 We evaluate how insurance product correlations have evolved over the past 20 years and estimate the potential impact from this evolution on holistic strategic asset allocation outcomes and decisions.
OBSERVED CORRELATIONS OVER TIME
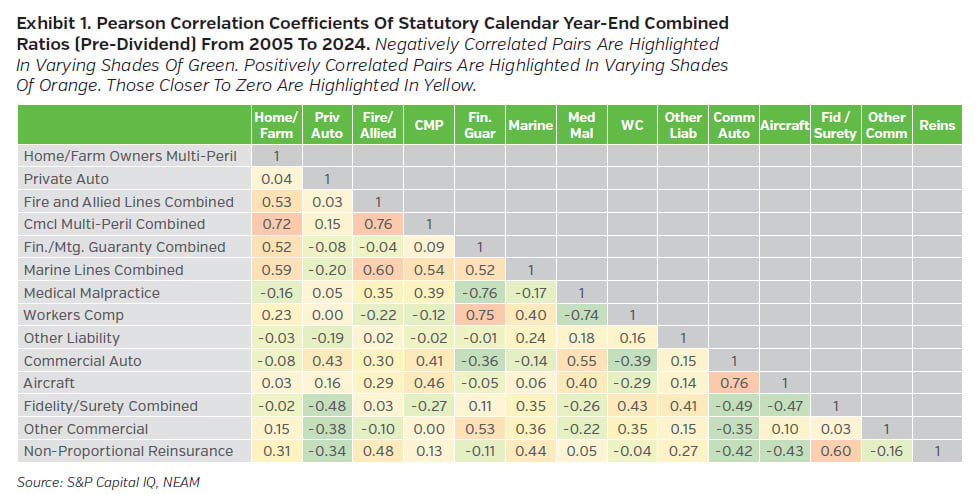
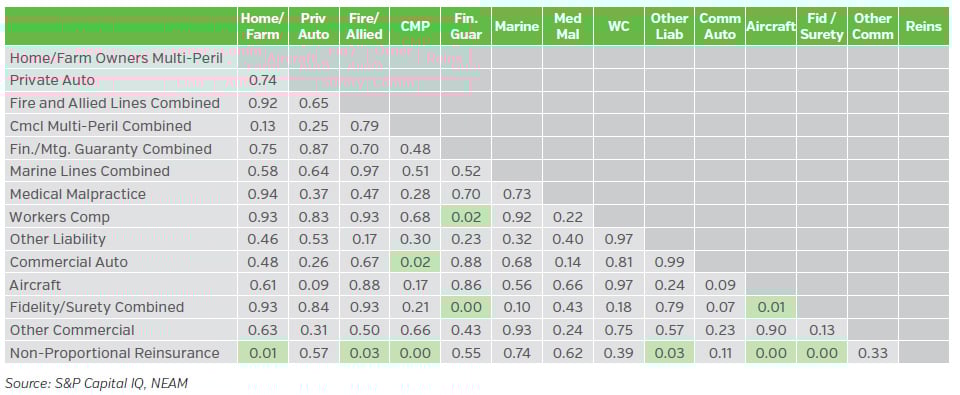
Pearson correlation coefficients are one way to measure the linear relationship between two variables. These correlations are anchored between -1.0 (perfectly negatively correlated) and 1.0 (perfectly positively correlated), with zero implying “independence.” Exhibit 1 shows a Pearson correlation matrix across reported statutory lines of business for U.S. Property and Casualty insurance companies over the past 20 years. We use reported statutory calendar year-end combined ratios (pre-dividend) from 2005 to 2024 to estimate 91 correlations. Over this 20-year period, correlated pairs ranged between -0.76 and 0.76, approximately 62% were greater than zero, and the average was 0.10 across all pairs.
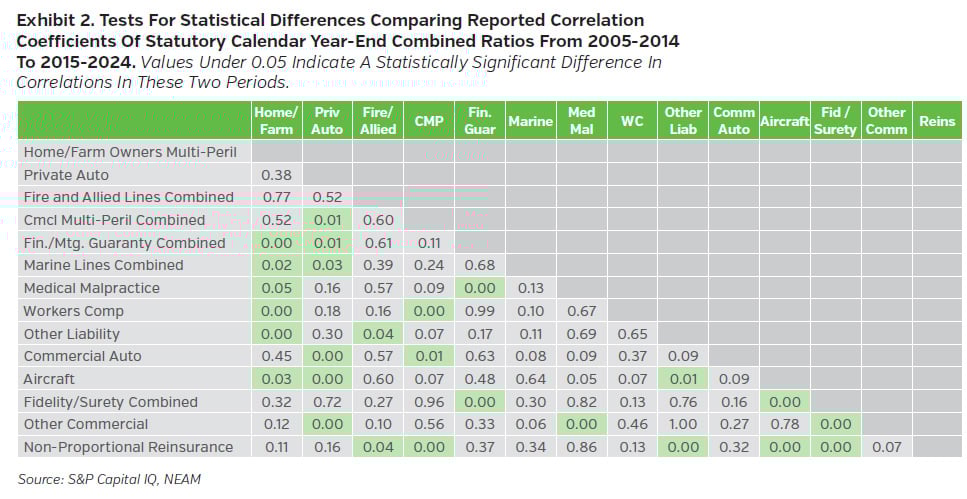
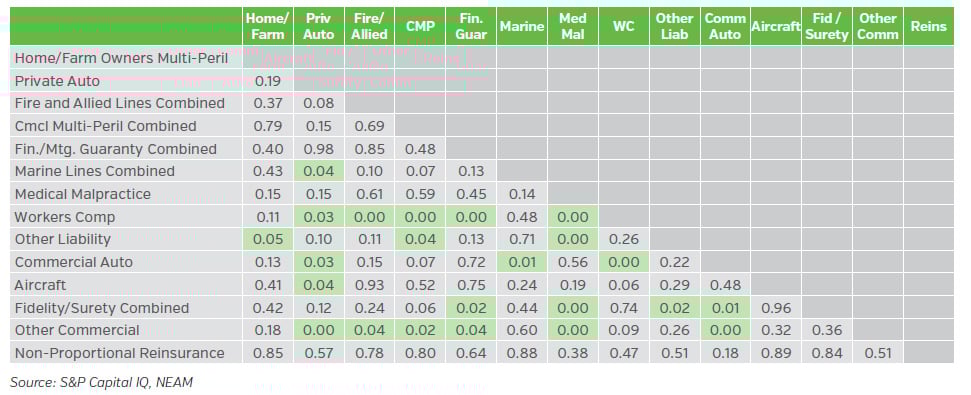
When we split the data set into two groups,2 2005 to 2014 and 2015 to 2024, most correlation coefficients change and some show changes that are statistically significant. Exhibit 2 shows p-values3 for the differences in the correlated pairs for these two periods. A p-value less than 0.05 indicates that the change in correlation for the pair between the two periods was statistically significant from zero. Of the 91 correlated pairs, 26 changed in a statistically significant way. Home/Farm, Private Auto and Non-Proportional Reinsurance each changed their correlations with at least five product lines in the example. This finding of product correlations changing (sometimes significantly) over time is consistent with what we discovered in our last correlation study from 2017, which focused on 1996 to 2015 calendar years.
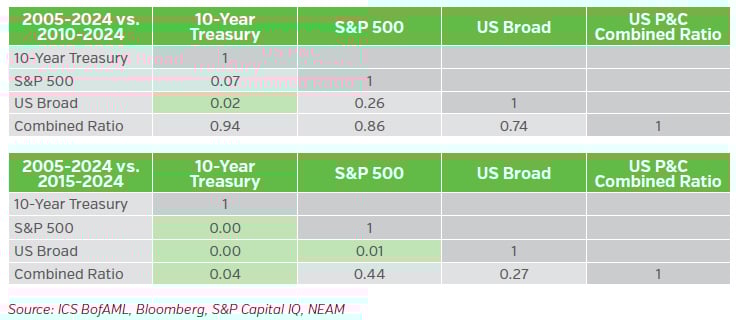
Another consideration is correlation between invested assets and insurance products. Exhibit 3 shows a correlation matrix for the annual returns of the 10-year U.S. Treasury bond, the S&P 500, and the Merrill Lynch U.S. Master Bond (US Broad) index and the U.S. statutory calendar year-end consolidated combined ratios from 2005 to 2024.
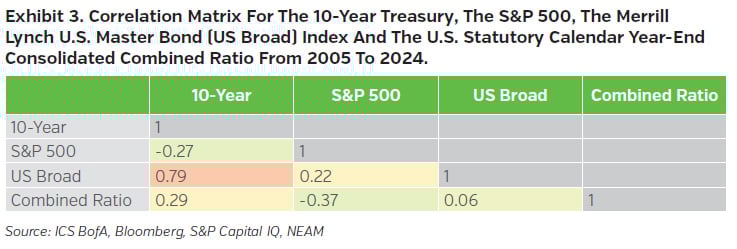
We tested changes in the above correlations by viewing selected time periods like the insurance product combined ratio correlation tests shown in Exhibit 2. The correlations shown in Exhibit 3 changed over time as well (See Appendix B).
CORRELATION IMPLICATIONS TO ASSET ALLOCATION
NEAM encourages insurers to use a holistic return and risk optimization framework that jointly considers an insurer’s assets, liabilities and surplus in forming strategic asset allocation. One approach to this is the Enterprise Based Asset Allocation™ (EBAA™)4 process, where expected returns, volatilities and correlations are reflected across underwriting products and investable assets to identify optimized investment portfolios.
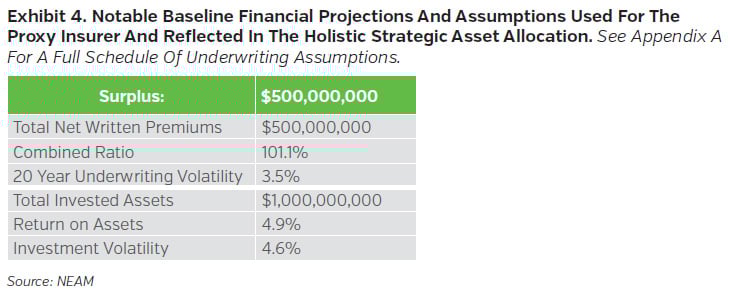
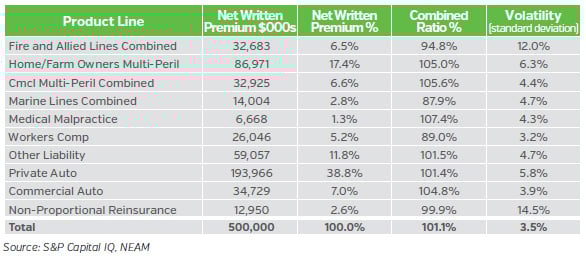
We use a proxy multiline U.S. P&C insurance company to evaluate the impact on EBAA™ process outcomes from the evolving liability correlations noted in Exhibit 2 above. We assume that the proxy insurer’s underwriting product mix and starting investment allocation are similar to what the U.S. P&C industry reported for year-end 2024.5 The asset allocation is allowed to change but the insurance product mix stays constant throughout the analysis. Notable financial assumptions are shown in Exhibit 4.
Using the correlations and assumptions in Exhibit 1 and Exhibit 4 respectively, we estimate baseline enterprise risk and return and portfolio statistics for our proxy insurer. We consider this baseline as less than optimized. The objective is to improve enterprise returns by identifying a strategic asset allocation optimized to a target enterprise risk level. The proxy insurer’s product mix stays constant. However, we identify three optimized portfolios6 that assume different product correlations across that product mix. The correlations are informed by historic P&C statutory calendar-year combined ratios over 10, 15 and 20 years from 2005 to to 2024. The target enterprise risk level for each optimization is a one-year 99.5% Value-at-Risk (VaR)7 at 20% of surplus. Exhibit 5 shows the results of baseline portfolio and three optimal portfolios. Portfolio A considers underwriting volatilities and correlations for the full 2005-2024 period. Portfolios B and C use underwriting volatilities and correlations for 2010-2024 and 2015-2024 respectively. 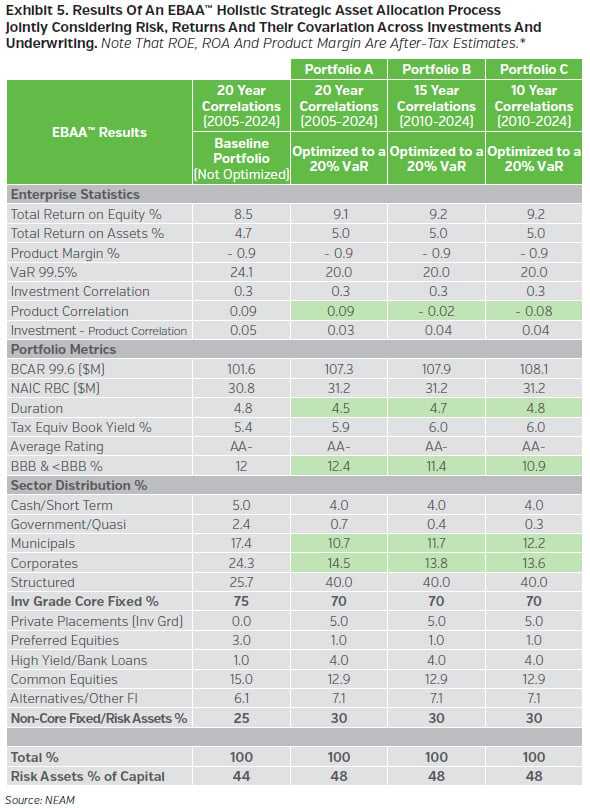
Portfolios A, B and C are optimized to maximize enterprise return at a 20% VaR. Also, each portfolio is subject to the same constraints and allowances regarding sector, credit quality, duration, etc. The aggregate product correlation is different for each portfolio despite the constant product mix, confirming that these correlations evolve over different time periods.
The three optimized portfolio outcomes indicate similar improvement for estimated ROE, ROA and book yield compared to the baseline, and the split between core fixed income and non-core/risk assets are also consistent. However, some characteristics of the portfolios are not. Relative to the baseline, portfolio A lowers duration and the other portfolios keep duration relatively unchanged. Portfolio C reduces “BBB/< BBB” exposure and portfolio A increases that allocation. All three portfolios lower allocations to corporates and municipals, but by different amounts. Though nuanced for some, these types of differences may be outside of risk preferences and allowances for others. The analysis suggests that the top-level objective of maximizing return at a given risk target is met for each portfolio. However, different assumptions surrounding correlations, volatility, and returns can influence the path to meet those objectives.
OTHER CONSIDERATIONS
Our focus to measure risk dependencies was based on Pearson correlations. However, there are ways to measure risk dependencies other than correlations and there are ways to measure correlations other than Pearson correlations. Moreover, we used product line correlations based on calendar-year combined ratios over a specific time-period. Accident year loss and combined ratios might be more informative in certain cases. Additionally, focusing on relationships across insurance risk types (e.g., catastrophe risk versus reserve risk versus underwriting risk etc.), instead of, or in addition to, product lines might offer different perspectives not fully captured in our analysis. Finally, evaluating why risk dependency measures change over time, and applying stress and scenario testing of key parameters and model assumptions, are prudent in any modelling framework.
KEY TAKEAWAYS
Risk dependency measures such as correlations help frame our understanding of relationships across different invested assets and insurance products. These insights are useful for projecting enterprise risks and returns, including identifying optimal ways to invest across assets given these relationships. We tested to see if the observed correlations among the statutory insurance lines for U.S. P&C insurers changed over time and how this could impact holistic strategic asset allocation decisions, focusing on the past 20 years ending in 2024. Notable findings include:
• Insurance products show more positive than negative correlated pairs from 2005 to 2024, but these relationships are not stable over other periods. Some insurance products exhibit statistically significant changes to their interrelationships over time.
• The data or time periods chosen to measure correlations and volatility can impact risk and return estimates, including potential strategic asset allocation outcomes and opportunities. Sometimes these can be significant.
• The results and findings of this study are comparable to what we found within our correlation analysis published in 2017. Insurance markets and capital markets are dynamic and often evolve. Understanding and adjusting to these changes can strengthen enterprise risk management broadly and enhance investment decision-making specifically.
Appendix
APPENDIX A.
Schedule of the proxy insurer’s underwriting assumptions used for the baseline in the EBAA™ analysis. Written premium percentages and combined ratios by line are similar to what was reported within the combined U.S. P&C industry statutory results for 2024, but scaled to $500 million. Smaller lines of business that collectively accounted for less than 5% of total net written premiums in 2024 were excluded. Volatility was estimated using annual calendar combined ratios from 2015-2024. Projected combined ratios were estimated using the five-year average combined ratio by line from 2020-2024.
APPENDIX B.
Tests for statistical differences comparing reported correlation coefficients of selected capital market indicators and the U.S. P&C statutory combined ratios for selected intervals between 1996 to 2024. Values under 0.05 indicate a statistically significant difference in correlations.
P-values for the insurance product correlation changes 2005-2024 vs. 2010-2024.
P-values for the insurance product correlation changes 2005-2024 vs. prior correlation study period (1996-2015).
P-values for the 10-year Treasury, S&P 500, US Broad Bond Index and aggregate combined ratio correlation changes 2005-2024 vs. 2010-2024.
Endnotes
1 Perspectives, “Pairing the Unknown – Liability Correlations and Asset Allocation.” October 2017.
2 See appendix for correlation matrices for selected other time periods and the associated statistical differences test results.
3 We use a Fisher Z-Transformation statistical test to evaluate if the differences in the correlated pairs are statistically significant from zero. Note that there is the potential for type-II errors with this testing approach given that some data samples in our study overlap. However, the results were still deemed informative for this discussion, particularly given the compelling statistical test results for non-overlapping data sets.
4 For a deeper discussion on the merits of holistic strategic asset allocation and Enterprise Based Asset Allocation™ process see Perspectives, “Asset-Centric vs. Enterprise-Wide Optimizations: What Strategic Insights Does a Holistic Optimization Unlock?” March 2025.
5 Per aggregated U.S. Property and Casualty combined statutory results posted by S&P Capital IQ as of year-end 2024. Also see Perspectives, “2024 P&C Industry Investment Highlights: Momentum Continues, but Slows.” July 2025.
6 Note that we assume asset correlations and asset-to-product correlations stay constant for each optimization.
7 Value-at-Risk (VaR) is the amount of loss not to be exceeded within a specified time period and at a given confidence level. In this case we assume a one-year time horizon and a 99.5% level of confidence.
* The EBAA™ results of the proxy baseline portfolio herein are for illustrative purposes only and should not be regarded as a recommendation of any investment product or strategy. NEAM applied constraints (i.e. different product correlations) to the Baseline portfolio via its Portfolio Optimization tool to generate the hypothetical estimates of return, risk and other metrics presented in the tables herein. The tools’ objective is to maximize total return on equity under these constraints using NEAM’s reinvestment set of generic securities and their attributes as of 9/30/2025. Other investment types not considered in the reinvestment set may have superior characteristics. NEAM makes no representation or warranty as to the reasonableness of the tool, reinvestment universe or constraints applied. The optimized portfolios do not consider the effect of changing risk profiles, operating cash flows or future investment decisions, assume a tax rate of 21%, do not represent actual trades and may not reflect the effect of material economic and market factors, including the potential inability to execute the proposed portfolio repositioning. Actual results will differ from the information shown and include the potential for loss. Results may vary with each use of this tool and over time.


