
Multiline insurers providing a broad mix of insurance policies benefit from natural diversification across their insurance risk portfolio. Underwriting margins and losses from one product line are unlikely to be exactly the same for another; however, these variables may still trend in similar directions. Changes in premiums, exposure rates and loss ratio projections reflect these relationships. However, estimating these relationships is as much art as science as history shows that dependency structures are not stable. Moreover, as investment choices are made, insurers are mindful of the liability profile and cash flow sensitivity considerations inherent in their underwriting operations.
KEY TAKEAWAYS FROM THE ANALYSIS:
- U.S. property-casualty lines on average are positively correlated, as insurance risk selection, pricing and loss events can impact different insurance products in similar ways (e.g., damage from natural catastrophes may impact automobiles, homes, farms, business continuity, and marine). However, the degree and direction of correlation varies over time.
- All else equal, as liabilities exhibit less positive correlation its contribution to overall enterprise risk decreases.
- Different correlation assumptions can have significant impact on enterprise earnings volatility, capital at risk estimates, and optimal asset selection; all of which can be evaluated through NEAM’s Enterprise Based Asset Allocation™ framework.
- Investment asset allocation, particularly among risk assets, can vary as different underwriting correlations are considered for an enterprise-based asset allocation.
CORRELATION TRENDS IN UNDERWRITING PERFORMANCE
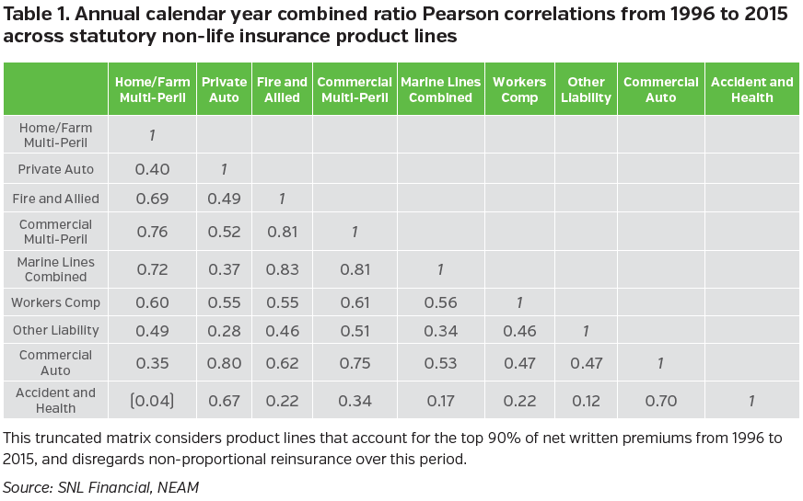
Measuring enterprise risk and return opportunities is predicated on various assumptions, not the least of which are dependency structures across different sources of risk and return. We assess if correlations change over time and, if so, to what degree. We use 20 years of annual combined ratio data from 1996 to 2015 for the 15 non-life insurance product lines tracked by SNL Financial. We calculate Pearson correlation coefficients1 for the combined ratios across the 105 different paired line combinations for these 15 products. Pearson correlations are bound from -1.0 (perfect negative correlation) to +1.0 (perfect positive correlation). Our calculations show how these correlations behave across the 1996 to 2015 time frame. The first period looks at the full 20 years of data, focusing on nine product lines that account for 90% of written premiums over the 20 years, as shown in Table 1. When considering the 20 years of data, one pair shows some degree of negative correlation, but in general underwriting combined ratios are positively correlated.
The correlations outlined in Table 1 provide one perspective of insurance-related risk dependencies2, but these dependencies are not necessarily stable. Table 2 provides a summary of the average of the correlated pairs of annual combined ratios across four time periods - and shows the average combined ratio and combined ratio volatility for perspective. We look at three blocks of 10 years within the entire 20-year period: one consists of the 20 years from 1996 to 2015; two includes the most recent 10 years from 2006 to 2015; and three shows 2001 to 2010. The fourth spans the 20 years from 1996 to 2005. We purposely chose years that overlap to highlight how correlations can evolve over time, the degree of which can be time dependent.
The average correlation is 0.32 over the full 20 years. However, correlations from period two and four are lower at 0.19 and 0.26, respectively, while period three has the highest correlation at 0.38. The range for the correlated pairs is 1.48 across the entire sample, and this grows tighter from 1996 to 2015. These differences reflect calendar year ratios, but similar directional changes are evident whether considering calendar year or accident year loss ratios (see other considerations).
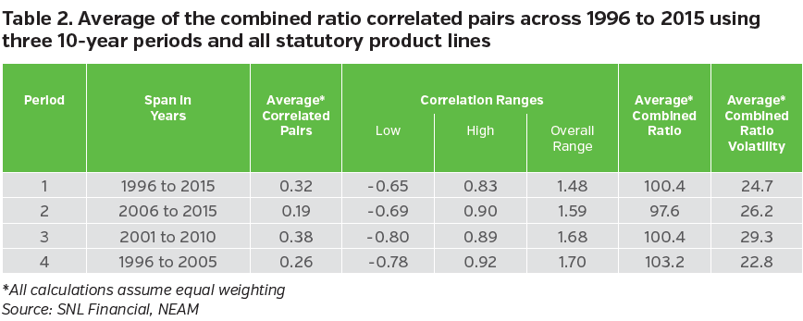
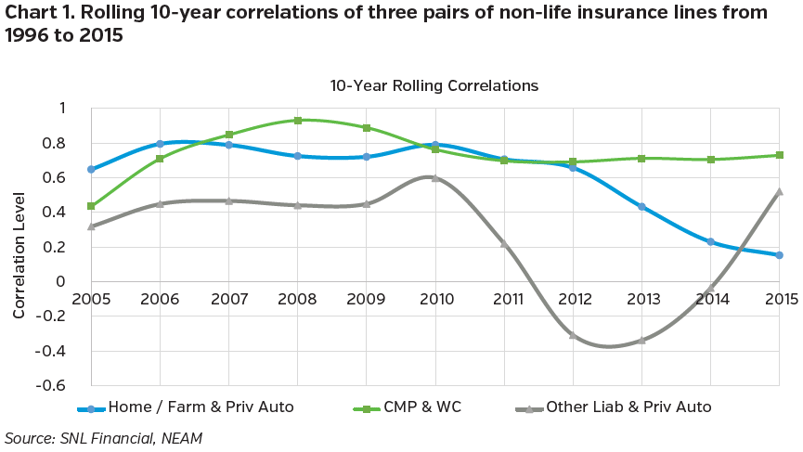
Chart 1 shows an example of 10-year rolling correlations of three pairs of non-life insurance lines from the years 2005 to 2015. The three pairs are: home and farm with private auto; commercial multi-peril (CMP) with workers comp; and other liability with private auto. Pairs one and two sometimes are packaged or underwritten jointly, while pair three has no obvious relationship. Collectively, these product lines account for over 65% of total net written premiums. Over the period, neither of the correlated pairs are stable, with correlation differences of 0.50 or more in absolute terms from 2005 to 2015. Rolling correlations between CMP and workers comp range from 0.43 in 2005 to over 0.90 in 2008, and have been fairly stable since 2010, averaging 0.74 over the period. The other two pairs exhibited significant variation. For example, other liability and private auto peaked near 0.60 in 2010 and turned negative from 2012 to 2014.
ASSESSING THE CHANGING CORRELATIONS OF UNDERWRITING PAIRS
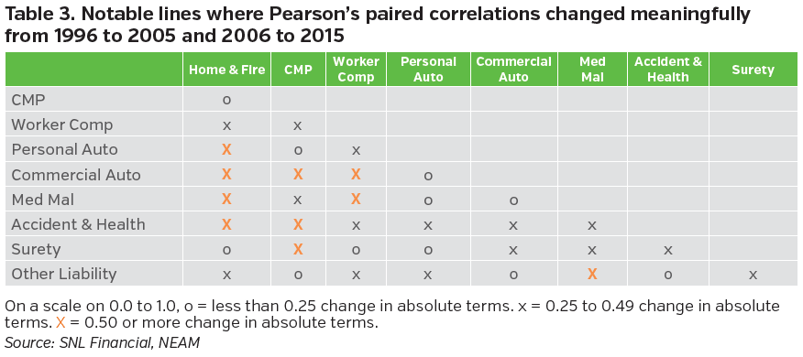
Next, we identify which correlated pairs changed the most from 1996 to 2015. We focus on period two and period four outlined in Table 2. Comparing the 10 years ending 2005 to the 10 years ending 2015, we identified eight product lines where correlations with at least three other product lines change in a meaningful way. Table 3 shows a list and matrix of those correlated pairs and the degree of change. In 25 instances correlations change in absolute terms by 0.25 or more and in 10 instances that change was over 0.50. Both are meaningful changes considering the average correlation over the period is 0.32.
Multiple macroeconomic factors can influence changes in a company’s insurance product performance and resulting correlations. Frequency and severity characteristics might evolve, underwriting growth incentives in one period may motivate risk and rating selection that differs in another period, or different approaches to claims management might impact the timing and size of underwriting losses. Conversely, some correlations and their changes can be completely spurious where relationships are not substantiated economically, adding challenge to any modeling and measurement process predicated on such dependency structures over time. Understanding the change and cause for the change are equally important.
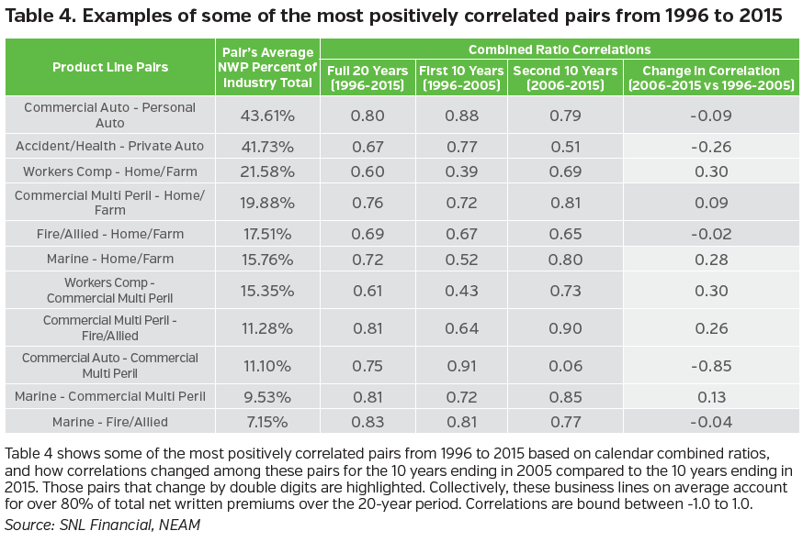
Contribution of correlated pairs to a multiline writer’s insurance risk portfolio is another key consideration. Understanding to what degree correlations change with specific pairs or groups of pairs, and the weights of those pairs within the overall portfolio is critical for insurance risk and ultimately enterprise risk awareness. Table 4 shows some of the most positively correlated pairs from 1996 to 2015. These business lines on average account for over 80% of total net written premiums over the 20-year period. The table also shows how much these correlations changed in the 10 years ending 2005 relative to the 10 years ending in 2015. Some of the more dramatic correlation changes are between commercial auto and commercial multi-peril, and accident and health and home/farm3.
ASSET ALLOCATION IMPLICATIONS FROM CHANGING LIABILITY CORRELATION
NEAM’s Enterprise-Based Asset Allocation™ (EBAA™) is an investment portfolio optimization framework that views underwriting performance expectations jointly with invested asset returns (see General ReView, January 2010, Issue 45). An insurer’s insurance liability profile and cash flow sensitivity is considered in asset class selection and portfolio construction. Assumptions of prospective underwriting results including returns, volatilities and correlations are critical to the framework.
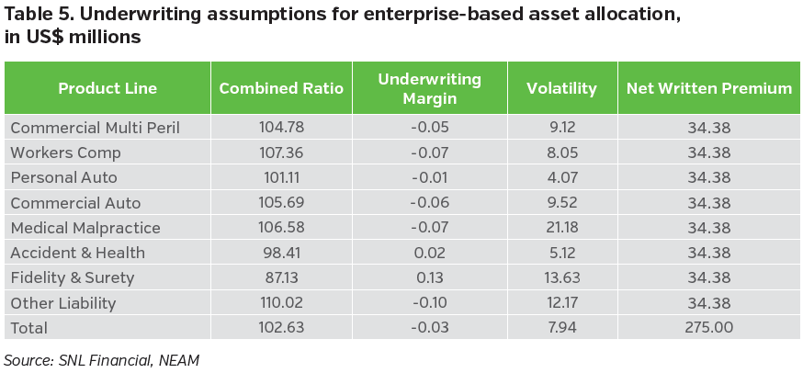
To understand the impact that underwriting correlations, and other risk dependency structures, can have on EBAA™ results, we use a proxy multiline non-life insurance company that underwrites the eight lines of business noted in Table 3. To isolate the impact of underwriting correlation, we assume three different portfolio optimizations based on three different liability correlation estimates across these eight insurance lines. All other assumptions remain constant, including NEAM’s expected asset risk and return estimates. We assume a middle market property-casualty insurer with US$275M in net written premium, US$600M in invested assets and US$300M in surplus capital. The insurer writes equal amounts of premium for each line and all correlations among assets and asset and liabilities remain constant – only liability correlations change. We calculate an expected insurance margin and insurance volatility by looking at the 20-year annual combined ratio performance from 1996 to 2015. (See the underwriting estimates in Table 5.)
For the baseline portfolio we use asset allocations of a “typical” U.S. middle market property-casualty insurer and we assume an enterprise risk tolerance equivalent to a one-year, 99.5 VAR of 20% of surplus (e.g., 99.5% confidence of not losing more than 20% of capital over a one-year period). We use liability correlations calculated across the entire 1996 to 2015 period shown in Table 1. For portfolios A, B and C we optimize to a 99.5 VAR of 20% of surplus, but assume different liability correlations. Portfolio A uses correlations from 1996 to 2015, Portfolio B from 1996 to 2005, and Portfolio C uses 2006 to 2015. Each optimization reflects the same set of asset allocation risk estimates, return expectations and constraints (e.g., yields, volatility, duration, credit quality, eligible assets, sector allocation bands, etc.). All assumptions and constraints are within ranges typical of U.S. property-casualty company portfolios that NEAM has worked with recently. Table 6 summarizes the results showing selected statistics, including estimated risk and return for the enterprise and portfolio, and high-level sector allocations.
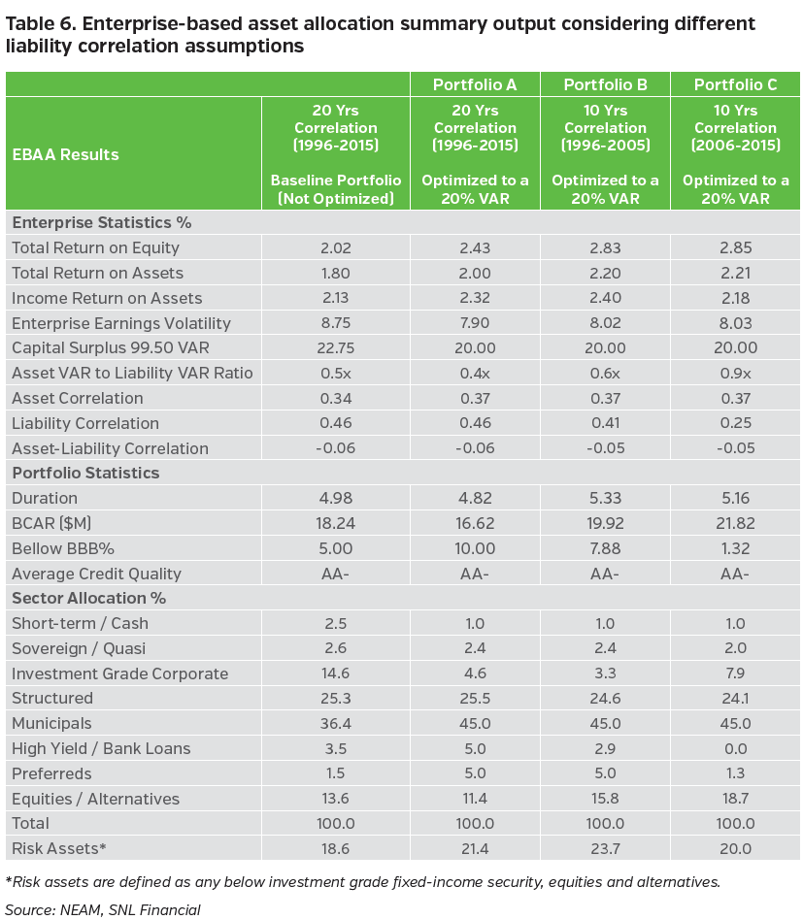
Each optimized portfolio shows increased expected returns for the enterprise and the asset portfolio, with lower earnings volatility. However, the optimal allocation of assets vary. This is due to key differences in the correlations within liabilities. All else equal, as liabilities exhibit less correlation with each other, this reduces underwriting’s risk contribution to overall enterprise risk. This enables more risk to be assumed by assets without breaching enterprise risk tolerances (see also General ReView, November 2004, Issue 29).
Portfolio A uses liability data from 1996 to 2015 and produces the highest liability correlations (0.46), with the relative lowest ratio of asset risk to liability risk (0.4x) compared to Portfolios B and C. This portfolio also has the highest allocation to preferred securities, lowest percentage of equities and lowest expected return on assets compared to Portfolios B and C. Portfolio B has liability correlation of 0.41 using the oldest portion of correlation data (1996-2015), and is expected to generate the highest income return on assets, but with the longest duration. In contrast, Portfolio C uses “fresher” liability data from 2006 to 2015 and produces the lowest liability correlations at 0.25, with the relative highest proportion of asset risk to liability risk (0.9x). Portfolio C also has the highest proportion of equities and alternatives, but not the highest allocation to risk assets overall. Each option gravitates to tax-preferred municipal securities to enhance yield, maintains a similar allocation to structured securities and reduces investment grade corporates.
Portfolios A, B and C are each more efficient compared to the baseline portfolio, producing ROE increases by ~40-80 basis points while maintaining a lower VAR of 20%. Portfolio C shows the highest ROE increase and uses the most favorable liability correlation assumptions of the three. This increases insurance-related diversification, and lowers the liability risk contribution to VAR compared to Portfolios A and B. In turn, more risk can be budgeted to assets via equities and alternatives for Portfolio C while maintaining the 20% VAR threshold, all else equal. The structure of a risk budget between assets and liabilities is a key element of prudent enterprise-based asset allocation. It is also predicated on overall risk capacity of the enterprise, organizational risk tolerances and stakeholders’ expectations. No matter the risk tolerance, parameter assumptions including correlations on either side of an enterprise’s balance sheet can have meaningful impact on the outcome of any modeling process, including asset allocation.
Enterprise risk and capital management considers the levels and sources of risk across the organization. This holistic understanding supports decisions on capital allocation, areas for growth and investment strategy. NEAM’s EBAA™ framework supports this. Recognizing both an insurer’s liability profile and cash flow sensitivity and its assets is equally important. Liability correlation is one of the key assumptions used within modeling processes for risk and capital measurement, including measures related to asset allocation. We present combined ratios as one way to assess correlations over different blocks of time across a 20-year span. Reported calendar year and realized accident year loss and combined ratios will differ across product lines, but our analysis indicates similar directional changes between calendar year and accident year ratios over time.
Time periods and methods used to represent underwriting performance relationships are very important assumptions. NEAM works with clients to understand the implications. Reflecting the relationships across insurance products considering the impact of reserves, attritional versus catastrophe losses coverage terms and reinsurance utilization help shape dependency structures within insurance portfolios. We help measure and assess the impact of risks and returns within liabilities and assets collectively, including interdependencies across the enterprise, to ultimately develop an appropriate and holistic investment strategy.
WE PRESENT FOUR HIGHLIGHTS FOR COMPANIES TO CONSIDER:
- U.S. property-casualty lines are positively correlated on average, but the degree and direction of correlation varies over time.
- Overall underwriting portfolio correlation evolves as characteristics of specific pairs of product lines within the portfolio evolve; some are spurious.
- Different correlation assumptions can have significant impact on expected enterprise risk and return expectations, including optimal asset selection. NEAM’s Enterprise Based Asset Allocation™ framework helps identify and evaluate these expectations.
- Investment asset allocation, particularly among risk assets, can vary as different underwriting correlations are considered for an enterprise based asset allocation.
OTHER CONSIDERATIONS
CONSIDERATION 1 – GROSS VERSUS NET COMBINED RATIO DATA
Gross combined ratios do not consider the impact of reinsurance, while net ratios look at loss performance net of reinsurance. In this study, we choose net over gross since different insurers have different choices and decisions on how and when to utilize reinsurance, and these differences cannot be extracted from public information. Some insurers, perhaps in high premium growth phases, may purposely write more than others on a gross basis, anticipating reinsurance support on the back end to set their net exposure. In contrast, other insurers, for a variety of reasons, may maintain higher retentions and utilize very little reinsurance for specific lines of business.
In our opinion, these factors are not more or less prevalent to particular business lines. We feel that over time this potential “noise” in the data becomes less relevant, suggesting net combined ratios are an appropriate metric for a broad industry assessment. That said, any industry study may overlook or (over)understate certain company-specific nuances that should be accounted for with any risk parameterization and modeling process.
CONSIDERATION 2 – ACCIDENT YEAR VERSUS CALENDAR YEAR
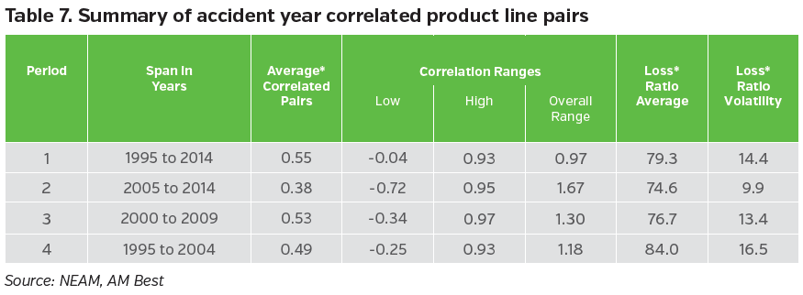
A second consideration is to assess if accident year combined ratios pose different results than calendar year ratios. Accident year average product line correlations are generally higher, but show similar directional moves over time, as with the calendar year ratios. Like calendar year results, the 2005 to 2014 and the 1995 to 2004 time periods show lower correlations relative to both the 2000 to 2009 period and overall 20 years from 1995 to 2014. That said, we are looking at a point in time estimate of accident year ratios as of the time of this writing. We would caution that a full evaluation of accident year performance and related correlations needs to consider how accident year loss ratios develop over time.
ENDNOTES
1 Pearson correlation coefficients are one of multiple measure of how two variables vary with one another. It considers the linear movement between two variables. Statistically speaking it is the covariance of two variables divided by the product of the two variables’ individual standard deviation. This is a standard measure (or coefficient) bounded between -1.0 (perfectly negative) and +1.0 (perfectly positive). Positively (negative) correlated variables tend to move in similar (different) directions or behave in similar (different) ways.
2 Pearson correlations of net combined ratios over time are one of several means of measuring insurance risk dependency structures. Some firms may use different correlation measures or copulas, or may consider reference data such as premium growth rates, loss ratios, gross combined ratios or other measures. These measures and data may produce different results. We are not advocating using any one measure or method over another, but encourage using assumptions that best represent the risk characteristics of the firm in question.
3 It is particularly noteworthy how the correlation between commercial multi-peril and commercial auto changed dramatically over the period. This could have been due to a structural issue across the industry or perhaps a change in classification in how certain products were categorized over time. Note that SNL Financial excludes auto physical damage from reported commercial auto premiums and combined ratios.


