
In this issue of Quick Takes, we will look at how certain risk factors in the muni market have evolved over the past decade. The states were in reasonably good credit condition in early 2008, the municipal market was operating smoothly and the financial crisis was beginning to unfold. Now, once again we find ourselves late in a credit cycle, so it’s natural to ask how does today’s municipal landscape broadly compare to what it was pre-crisis?
Market Characteristics
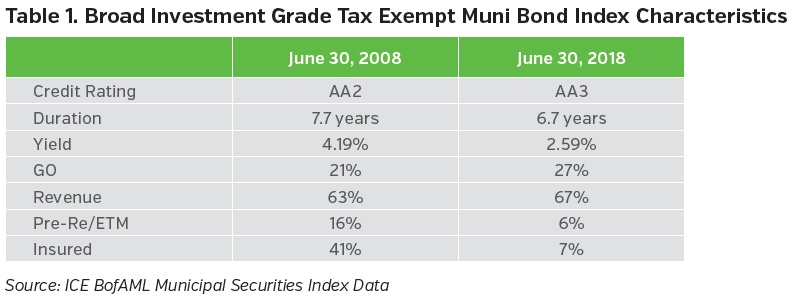
In some respects, today’s municipal bond market looks rather similar to its pre-crisis profile. In fact, the market has grown just 5% since 2008, a technical positive, and far less than the growth in U.S. Treasury debt and corporate debt (+150% and +63%, respectively).1 As for market characteristics, credit quality has declined slightly from AA2 to AA3 (due in part to the sharp decline in the number of insured bonds) and effective duration has shortened from 7.7 to 6.7 years.2 Muni sub-sector and state weightings have shifted modestly, including the migration of most Puerto Rico bonds out of the index following the island’s record setting defaults.
Ownership
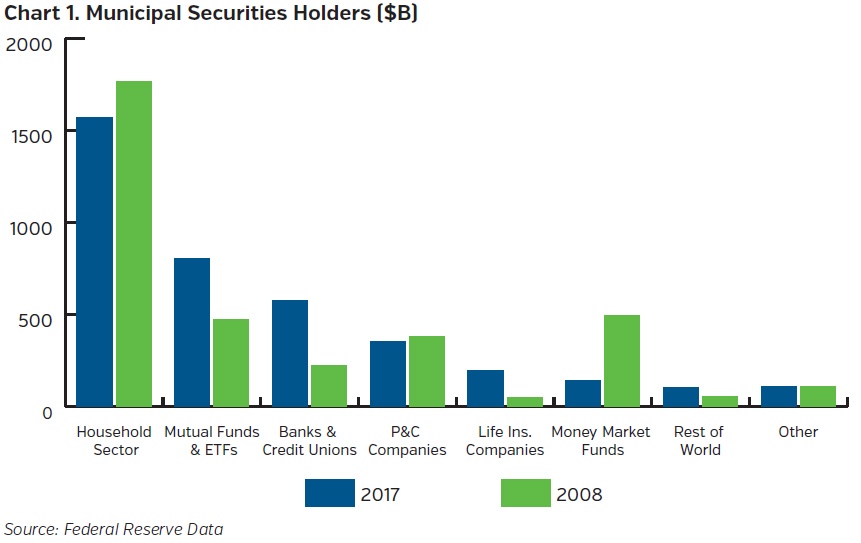
Municipal bonds remain largely owned by individual investors, though increasingly through mutual funds and ETFs rather than via direct bond ownership. Further, the share of households holding muni debt has trended lower and is more concentrated among the very wealthy.3 On the other hand, bank holdings have surged in recent years to 15% of municipal debt outstanding. However, along with P&C companies, bank involvement is expected to moderate given lower corporate tax rates effectuated by the Tax Cuts and Jobs Act of 2017 (see our Quick Takes titled “Impact of Tax Reform on Municipal Bonds and Preferred Stocks”). In all, the municipal bond buyer base is more concentrated today than it was a decade ago, a technical negative.
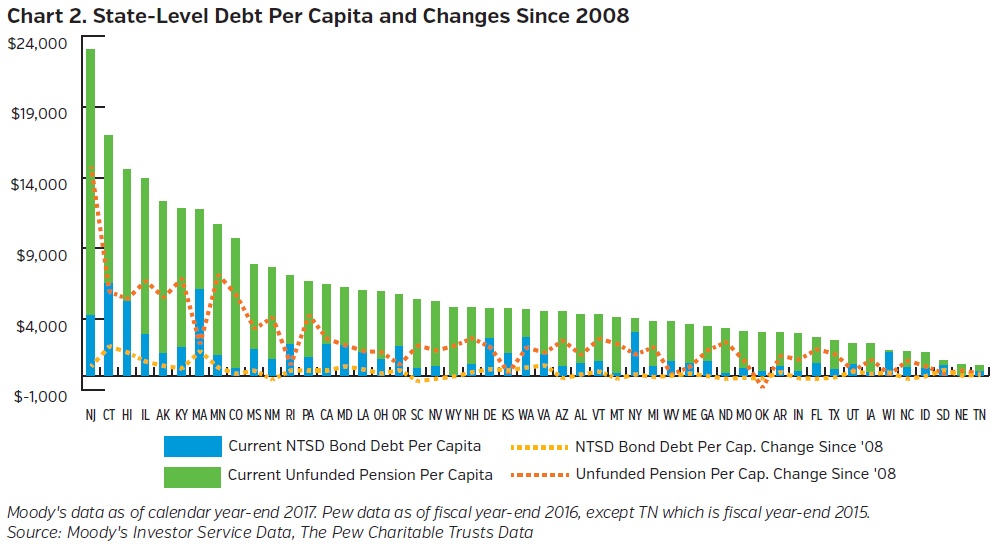
In terms of debt issuance, the states have proceeded cautiously since the financial crisis, despite the accommodative capital markets backdrop. State-level net tax-supported bond debt (debt secured by statewide taxes and general resources) has increased on average by just $283 per capita to $1,484.4 Unfunded pensions, on the other hand, have grown far more meaningfully, despite what has been the second longest U.S. economic expansion on record. State-level pension liabilities, at $4,376 per capita,5 have grown to nearly three times that of tax supported bond debt outstanding. This is due to a variety of factors, including GASB reporting changes that paint a more realistic (and far more onerous) picture of these liabilities. The pension issue, though, has become a leading topic of debate in town halls and state houses across the country which should lead to further reform.
Credit
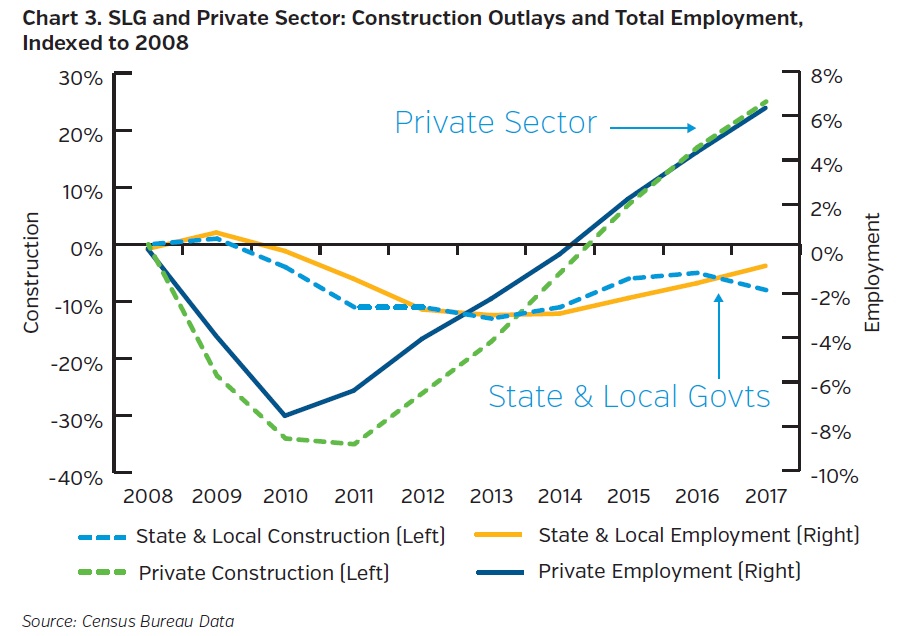
In our estimation, the near to intermediate term credit outlook for states and local governments is good (as one would expect at this point in the economic cycle). General funds are largely balanced, cash reserves are at multi-year highs and enterprises are performing well. When considered holistically, however, credit remains weaker than pre-crisis. Despite negative inflation-adjusted growth in bonded debt, states and local governments, in the aggregate, are more levered today than a decade ago. This is not just due to rising pension liabilities but also in terms of service delivery. States and local governments have balanced their books since the financial crisis, in part, by providing fewer services (i.e. deferred infrastructure investment and smaller workforces). This should remain a common theme as rising legacy costs collide with weakening demographics, not just in the heavily indebted “blue” states, but in parts of rural America as well.
Additionally, surging debt and deficits at the Federal level, coupled with a polarized Congress have increased policy/appropriation risk for the states. While this may not be of immediate concern, states are reliant to varying degrees on the Federal government which provides almost a third of their revenues overall. On a positive note, recent Supreme Court decisions may provide some relief, both in terms of additional revenues and (perhaps) long-term, secular changes. Most notably, in “Janus vs. AFSMCE,” the court‘s decision restricts the ability of state and local governments to collect certain agency fees from non-union members which could weigh on the political clout that organized public sector labor has wielded for decades. Combined with decisions that expand a state’s ability to collect sales taxes on e-commerce and that allow states to administer sports gambling, these recent rulings provide additional revenue sources which at the margin, serve to improve credit quality.
Political Will
While not easily quantifiable, we think the political narrative remains reasonably supportive of the muni market. The vast majority of states and local governments continue adjusting to economic and demographic conditions, albeit unevenly and painfully slowly at times. As a barometer of political will, municipal defaults remain rare, though have become more concentrated in general government debt.6 Is municipal bankruptcy no longer considered “taboo,” or were Detroit and Puerto Rico simply outliers? That remains to be seen but there will almost inevitably be other issuers that experience stress in the next downturn.
In sum, municipal credit is arguably a bit riskier today than it was pre-crisis not because of heavy debt issuance per se but because of pensions and other liabilities that are outpacing economic growth. This obviously affects certain states and locales much more than others but in the aggregate, this dynamic is keeping a lid on pro-growth spending (and municipal bond debt issuance).
Key Takeaways
- Underlying market composition similar to pre-financial crisis
- Buyer base narrowing, a technical negative
- Credit in reasonably good condition, though arguably weaker than pre-crisis
- Rising legacy costs crowding out pro-growth spending
- Defaults remain rare
- NEAM will retain its focus and preference for revenue bonds vs. GOs, particularly in states with onerous legacy liabilities
Endnotes
1 SIFMA data
2 ICE BofAML US Municipals Securities Index data
3 Bergstresser, Daniel. "Changing Patterns in Household Ownership of Municipal Debt." Hutchins Center Working Paper #20.
4 Based on data from Moody’s Investor Service, States Median Reports
5 Based on data from The Pew Charitable Trusts
6 "US Municipal Bond Defaults and Recoveries, 1970-2017." Moody’s Investor Service. 31 July 2018.


