
Recently, we explored how tax changes have influenced the attractiveness of tax-preferenced investments and the impact of accounting regimes and taxes on rating agency and regulatory solvency assessments.1 This Perspectives addresses the impact of these tax changes on risk tolerances and asset allocation when taxes are explicitly considered in the decision process.
To summarize our findings:
- Risk tolerance estimates are impacted significantly by tax changes – and may be counter intuitive
- The return hurdles and low volatility advantages of tax-preferenced securities rise with tax reform
- Asset allocation decisions will become increasingly more dependent on enterprise risk tolerance measures and require a tightly woven integration with prospective underwriting outcomes
This issue of Perspectives is divided into four sections. The first reviews the basic enterprise framework for insurer return on equity and risk based on formulation using industry-wide results. The second shows the impact of alternative approaches to accounting for taxes in downside risk estimates. In the third section, we discuss how the recently enacted tax law impacts asset allocation. We conclude with key takeaways and an expanded summary of findings.
The Basic Enterprise Return and Risk Framework
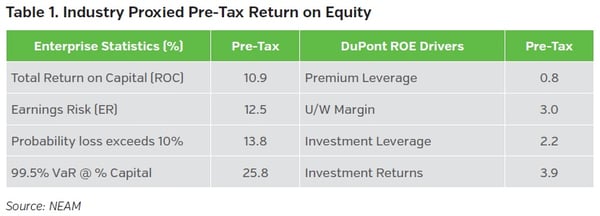
NEAM’s enterprise-based asset allocation framework follows the DuPont return on equity formulation.2

Table 1 shows estimated industry pre-tax total return scaled to 2017 premiums, invested assets and capital. The resulting total return on equity is derived from the DuPont formulation where premium and investment leverage, premiums to capital (0.8:1.0) and invested assets to capital (2.2:1.0) are multiplied by the underwriting margin (one minus the combined ratio) of 3% and investment total returns of 3.9%, respectively.
Earnings risk is the combined leveraged volatility of the underwriting and investment returns, plus any correlation effects. The industry’s estimated pre-tax return on capital and earnings risk are 10.9% and 12.5%, respectively. The 99.5% VaR is 25.8% of capital within the next year.3
Accounting For the Impact of Taxes on Estimated VaR
Most U.S. domiciled insurance companies are subject to U.S. Federal income taxes. As shown in the first two columns of Table 2, taxes reduce expected rates of return, their volatility and VaR estimates. The extent of the impact depends on the type of earnings (ordinary income, preferenced items, and capital gains and losses) and pre-tax VaR estimates.4 Occasionally, practitioners tax affect the returns but not earnings risk, in which case the estimated VaR is greater than the pre-tax amount. This is shown in column three (mixed rates).5
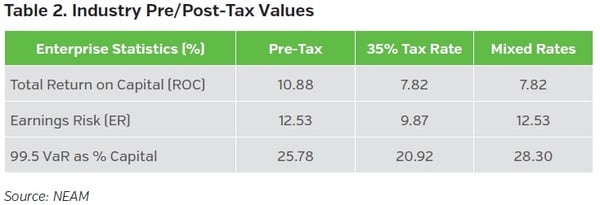
Table 3 shows pre-tax and after-tax statistics using historic 35% and newly enacted 21% tax rates. Columns one and two are identical to what was shown in Table 2 above. As taxes decrease, returns and volatility increase – leading to higher estimates of VaR, and potentially counter-intuitive results.
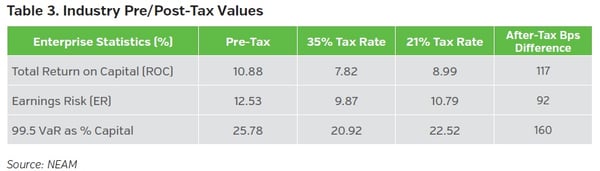
There are two takeaways from Table 3:
- As tax rates fall, both returns and earnings volatility migrate to their pre-tax levels – and so does the estimated VaR.
- Downside risk metrics are asymmetric: the benefit of a higher expected return (117 bps, or nearly 15% improvement) is offset by a lesser increase in earnings risk (92 bps, or 9.3% deterioration), yielding an increased estimate of VaR (22.52%).
The Impact of Enacted Tax Changes on Asset Allocation
Table 4 shows after-tax total return and risk statistics for municipal and broad market securities. As tax rates fall, the relative value of municipal returns declines from 85 bps (4.88 – 4.03) to 5 bps (4.94 - 4.89). However, municipal’s volatility becomes relatively more favorable at 81 bps (3.84 – 3.03) versus 58 bps (3.16 – 2.58). The estimated VaR increases for both security types as rates decline. But, municipals have a superior “net-net” outcome, resulting in a less dominant after-tax return and an increasingly favorable risk profile as tax rates fall.
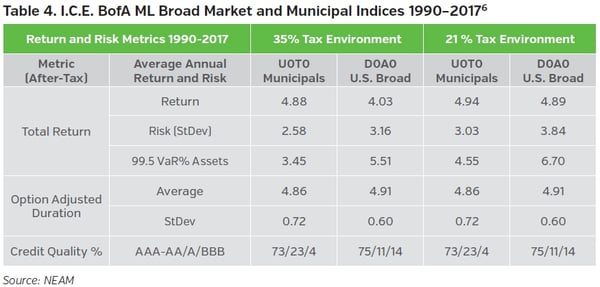
Table 5 highlights results of the industry’s portfolio holdings reallocation in response to the recently enacted tax law. The focus is on changes in the “optimal” municipal bond allocation. Column one shows current holdings’ enterprise statistics and broad sector allocation at the prior 35% tax rate. Column two displays the corresponding optimal similar VaR portfolio achieving an expected after-tax return of 8.67%. This is driven by an increase in (longer dated) municipals and a lessening of overall credit quality. In the new 21% tax rate environment, the similar VaR portfolio is achieved with a similar duration extension, an unchanged credit quality and a lesser municipal bond allocation increase.
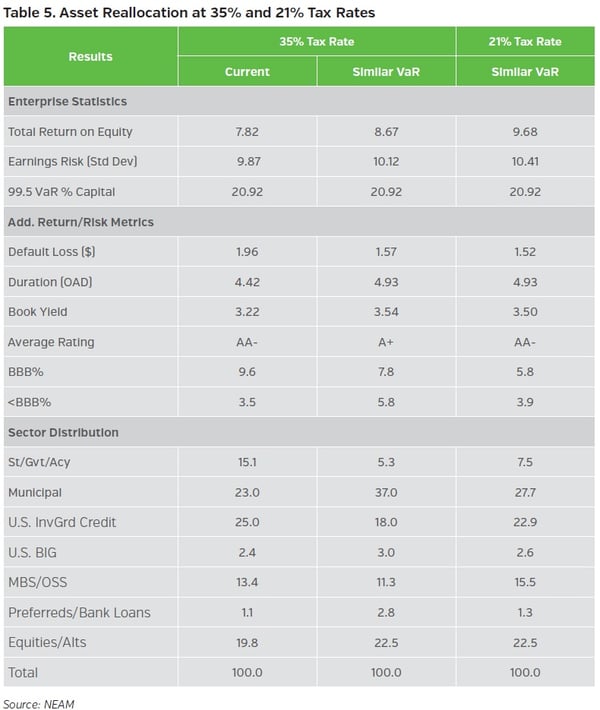
Prior to the enacted tax law changes, many individual companies were likely to have been significantly underweight in tax-preferenced securities. Thus, the industry portfolio reallocation above identifies a large municipal increase in column two.7 With lower tax rates, the potentially overwhelming advantage for municipals diminishes, requiring a far lesser increase to achieve an optimal allocation within estimated enterprise risk levels.
The results in Table 5 are based on industry holdings at year-end 2016 and capital market opportunities in 2017. Individual company results will vary depending upon their current tax-exempt and taxable embedded yield term structures and future capital market opportunities which meet their market risk tolerances. These will evolve with time. As they do, the relative attractiveness of current holdings to tax-preferenced securities available in the capital markets will change…as they have done during all prior tax regimes. It might be “in with the new,” but for astute practitioners it definitely is not “out with the old”…at least not yet.
Key Takeaways and Summary Findings
- The impact of lower taxes on downside risk metrics (such as VaR) is asymmetric. Increases in after-tax returns are off-set by smaller increases in volatility that lead to higher VaR estimates.
- Measuring VaR on an after-tax basis is consistent with an Enterprise Based Asset Allocation™ framework. However, prudent risk management requires monitoring both after-tax and pre-tax metrics due to issues of recoverability and timing.
- Lower tax rates diminish the relative return advantages of tax-preferenced securities. They also improve their relative volatility advantages which leads to a continued superior higher after-tax risk adjusted profile.
- An after-tax review of industry holdings, underwriting results and leverage suggests lower tax rates will reduce the allocation to tax-preferenced securities. However, we expect that tax-preferenced securities will remain a key component within taxable insurance organizations.
- How the details of asset allocation play out in the future remains to be seen, and how individual companies respond will depend on their capacity for tax-preferenced securities, their embedded yield term structures vis-à-vis capital market opportunities and their risk tolerances. In our view, lower tax rates will require an ever tighter integration of investment opportunities with underwriting results in companies’ Enterprise Based Asset Allocation™ decision process.
For more information on this topic or past discussions on the impact of tax changes, please contact us.
Endnotes
1 See these past issues of Perspectives: “The New World Order: Bridging the Gap,” February 2018. “There’s a New Sheriff in Town: Now What?,” January 2017. “The (Ir)relevance of Value-at-Risk: An Oxymoron?,” April, 2010.
2 Conceptually, this formulation applies regardless of the measurement regime. The components may be estimated differently, depending on how the estimated VaR is intended to be used.
3 As losses occur throughout the year, it is more likely that their total sum accumulates to the VaR threshold at any time during the year than precisely at the end.
4 The percent reductions in total return and earnings risk are not identical nor equal to 35%. This is because of the impact of proration rules on income components of total return and the difference in the relative price volatility of preferenced versus non-preferenced items.
5 The discussion of taxes in VaR calculations is rare and we have observed a variety of mixes and matches of tax treatment. Calculations are laborious and errors may be the result of oversight or inability to account for diverse tax rules.
6 The returns shown are total returns. The tax rate for tax-exempt bond coupon income is unchanged at 5.25%. The tax rate for price changes of both taxable and tax-preferenced securities declines from 35% to 21%. The later causes the increase in the after-tax total return of municipal securities.
7 This comment is based on many years of compiling peer reviews.


