
Regulatory and rating agency solvency assessment methods are evolving. A.M. Best is deploying its new capital adequacy model. NAIC Own Risk and Solvency Assessment (ORSA) regulatory documents are being filed by insurers. And, modifications to Solvency II requirements and the adoption of International Financial Reporting Standards (IFRS) are underway.
A common metric within this evolution is value-at-risk (VaR), which is the amount of loss occurring within a specified period of time at a stated confidence level. VaR was formally introduced in the U.S. banking industry in the 1920’s. However, its antecedents can be traced to the middle 1700’s and has served as a cornerstone to risk theory and solvency evaluation in insurance since the very early 1900’s.
VaR can be expressed as an absolute amount or as a percentage. It can be defined for whatever time period is desired. It can capture a single event (such as a hurricane), a combination of extreme events (man-made or natural disasters) or the cumulative impact of discrete (or correlated) occurrences (trading losses, automobile accidents, etc.). The confidence level can reflect whatever degree of certainty is sought (50-50, one in 500 years, etc.). The meaning of VaR is not uniquely bound by a solitary regulatory regime: it is any metric of shortfall.
However, the devil is in the details where evolving VaR metrics can seem contrary to existing solvency methods and measures, frustrating insurers and hindering its usefulness. This can occur for those steeped in statutory accounting and traditional ALM. In this Perspectives, we seek to reconcile VaR metrics to conventional methods, emphasizing its usage for evaluation and guidance rather than dicta to be proscriptively followed.
There are several key takeaways to highlight:
- Statutory amortized cost metrics mask fixed income return volatility and can ignore favorable diversification benefits – potentially misstating insolvency risk and influencing investment behavior.
- Leverage can normalize the order of magnitude differential between insurance and investment volatility.
- Underwriting metrics show less than expected impact upon VaR estimates due primarily to leverage and correlation effects.
- Taxes greatly impact VaR estimates, requiring their consideration in benchmarking capital adequacy (and asset allocation).
- Point-in-time single period solvency assessment is confounded by evolving loss development and multi-year views implicitly assume that as adverse results unfold corrective action is not taken.
- The results we show are based upon industry aggregates and individual company results may vary, often significantly.
Statutory rules-based historic enterprise VaR estimates
Below is a simple formulaic representation of the DuPont framework for insurers’ return on equity.1

Chart 1 displays the key drivers of insurers’ statutory return on equity: underwriting results (and a small amount of miscellaneous related income); net earned investment income and realized investment gains and losses; and premium and investment leverage (premiums to surplus and invested assets to surplus, respectively).
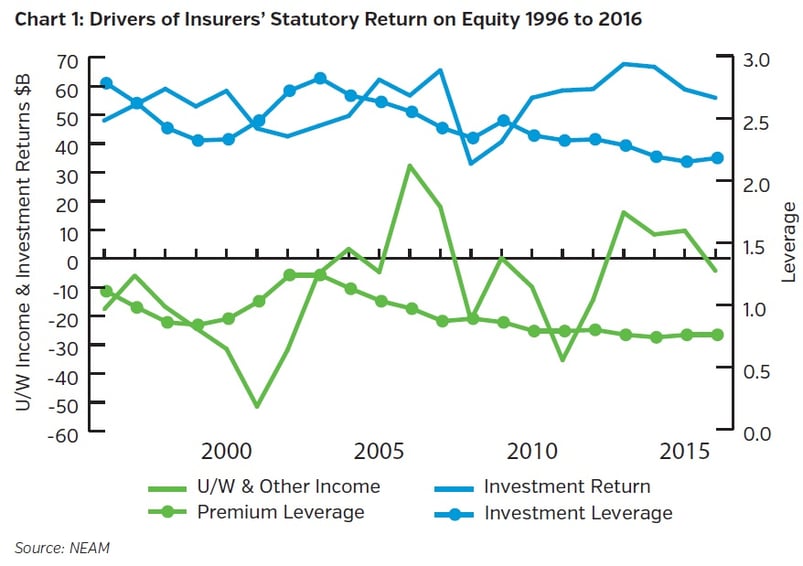
Underwriting results vary from a loss of nearly $55 billion to a gain of over $30 billion, while investment earnings range from $33 billion to $67 billion. Leverage is trending downward. Importantly, the ratio of investment leverage to premium leverage (continuing at less than 1:1) is increasing, allowing the potential for more stable reported investment earnings to dampen the impact of higher volatility underwriting results upon surplus.
Chart 2 displays both reported year-end statutory surplus and after-tax return on surplus. Reported statutory surplus reflects net income, capital withdrawals and contributions, changes in surplus notes, other miscellaneous items and unrealized gains or losses from equities, but not those of fixed income securities. The latter is noteworthy given that fixed income holdings for most companies exceed four times the amount of equities, thereby greatly amplifying fixed income shortfalls upon capital.
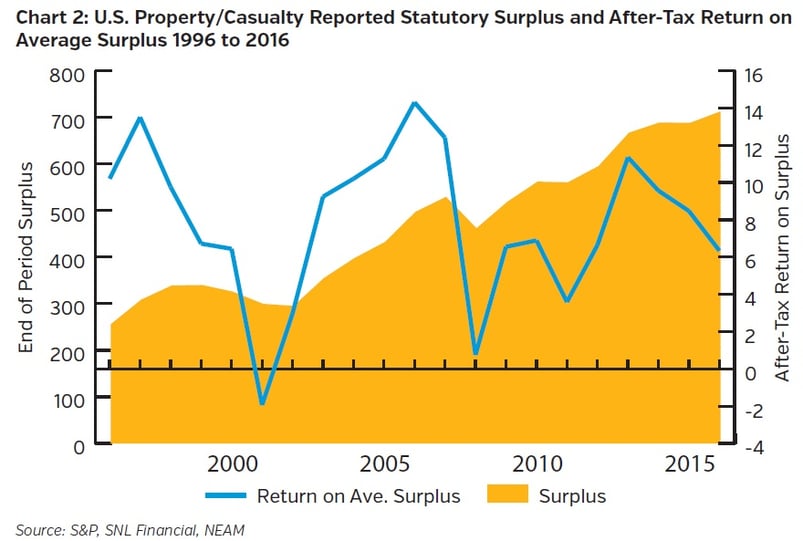
Table 1 summarizes the return, volatility and 99.5 VaR estimates derived from annual return and reported surplus. The average annual after-tax rate of return was 7.87% and the volatility of the return as measured by the standard deviation was 4.1%, with annual returns ranging from nearly a 2% loss of capital to a gain exceeding 14%.2 On a pre-tax basis the return and volatility were 9.96% and 5.18%, respectively.
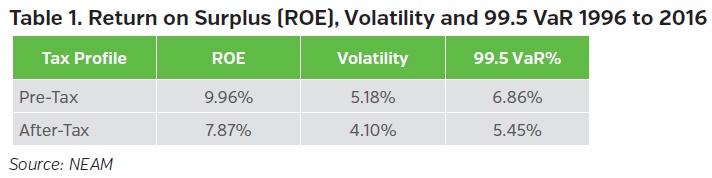
The estimates of VaR shown above might appear low, perhaps too low, challenging perceptions as to the “riskiness” of the business. In fact, by computation they are low: one can be 99.5% certain that the pre-tax (after-tax) loss of capital will not exceed 6.86% (5.45%) of capital within any one year. Yet, the expectation is to achieve nearly 10% and 8% positive returns, respectively, so the estimates of VaR represent a meaningful shortfall from expected return on capital although not a severe loss of capital.
However, the VaR might also seem low because it is constructed based upon statutory-based definitions of returns, which as noted above exclude unrealized marked-to-market gains and losses of fixed income investment grade securities and allow for the tempering of underwriting volatility due to reliance upon net calendar year results rather than accident year estimates. We will explore the significance of these considerations and their impact upon VaR estimates in the following sections.
Filling in the gaps – Underwriting metrics
Chart 3 below displays estimated industry-wide combined ratios. The combined ratios are shown for the calendar year, that year’s reported accident year result and that lead accident year with five years of development.
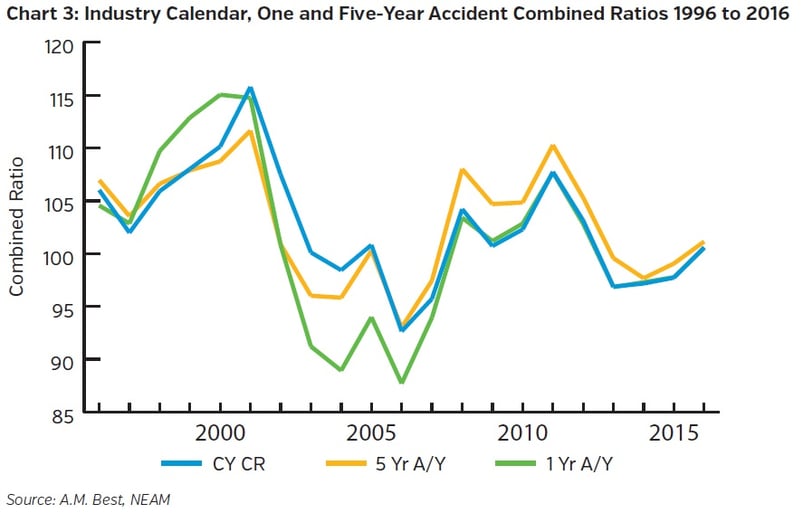
The reported combined ratios show similar directional change patterns due to the large portion of each metrics’ share of current accident year losses and calendar year expenses. However, as shown in Table 2 there can be meaningful differences for the average combined ratio, volatility and estimated VaR depending upon the underwriting metric and its seasoning.
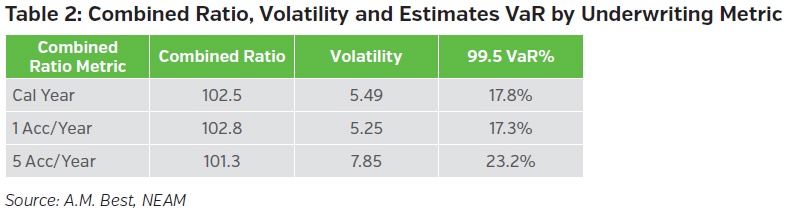
The calendar year combined ratio averaged 102.5. This equates to a negative underwriting margin of 2.5% of premium. Volatility was 5.49 combined ratio points. The 99.5 VaR is estimated at 17.8%, meaning that there is a 99.5% chance the underwriting loss will not exceed 17.8% of premium. The calendar year and lead accident year statistics are very similar, coincidentally. However, as the accident year develops, the estimated combined ratio improves over a full point – representing more than a 50% margin improvement. Unfortunately, the volatility also increases leading to an increase in estimated VaR of 5.9% of capital from 17.3% to 23.2%, more than a 33% degradation. We caution that individual company results may vary greatly.
Filling in the gaps – Investment results
There are several gaps with respect to investment results that need to be closed to move from the previous statutory-based results to a marked-to-market framework contemplated by more recent comprehensive VaR measures. These include the decomposition of fixed income total return into price and income (coupon) components, risk factor components (principally rate and credit), and diversification effects within fixed income sectors, including the impact of equities (and other assets such as Schedule BA).
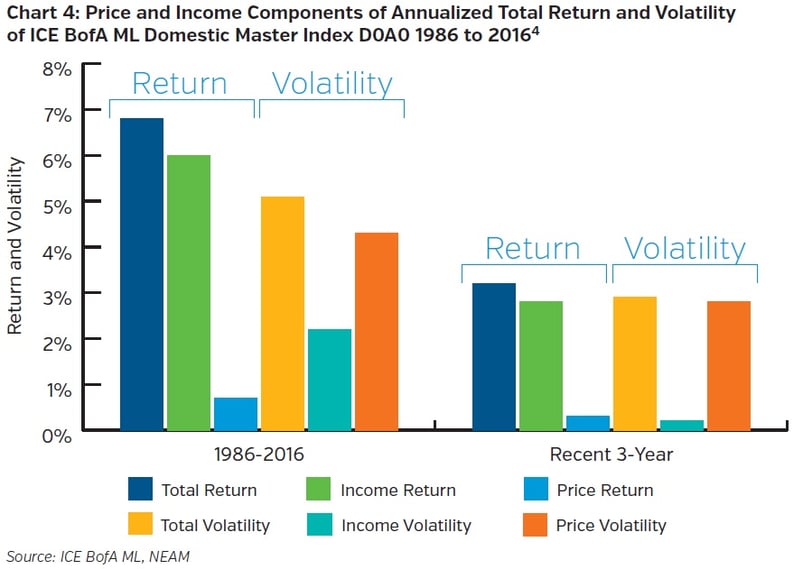
As shown in Chart 4, total return of fixed income assets is driven by the income component of total return.3 The price component of total return is the principal driver of total return volatility, particularly in more recent years, as rates have drifted down to near historic lows from the peak years in the 1980’s. Excluding fixed income (unrealized) gains and losses from VaR considerations can seriously understate volatility.
Fixed income returns and volatility are frequently decomposed into their rate and credit risk components. The focus can be either a bond’s total return and excess return and the total return of the underlying U.S. Treasury bond, or the bond’s market yield and spread and the market yield of the underlying U.S. Treasury bond. Chart 5 displays BBB Corporate bonds’ total returns and excess returns and the total returns of the underlying U.S. Treasury bond for the time period of 1997 to 2016. The key takeaway is that the magnitude of episodic spread changes is the driver of credit-based securities’ recent volatility rather than the underlying rate risk.5
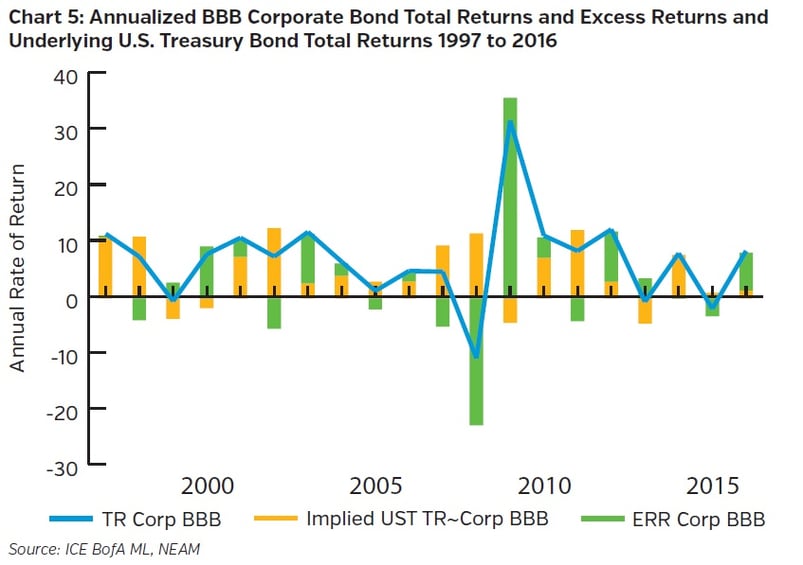
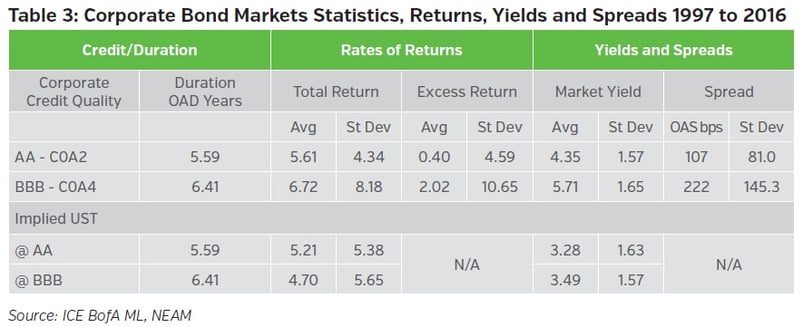
Table 3 summarizes risk statistics for two ICE BofA ML U.S. corporate bond indices: C0A0 and C0A4. For AA corporate securities, excess return volatility exceeds total return volatility, but the implied underlying treasury volatility trumps both, reflecting negative correlation of rate and spread risk. Similarly, the underlying implied Treasury market yield volatility exceeds that of the AA corporate index. For BBB corporate securities, total and excess return volatility dwarfs underlying Treasury volatility and BBB market yield volatility marginally exceeds that of the underlying treasury, reflecting the more extreme spread volatility.
Rating agency and regulatory regimes which focus solely on default risk to account for fixed income “investment risk” and are otherwise silent with respect to spread volatility will significantly understate insolvency exposure. This approach ignores the likelihood and magnitude of a valuation shortfall when securities might need to be liquidated to pay for losses which were not expected or modeled to occur when they did. A solvency assessment needs to address shortfalls in valuation regardless of their timing or cause; rates; defaults; or perceptions of the risk of default. A full accounting is required for all of these risk factors, not simply rate and default risk.6
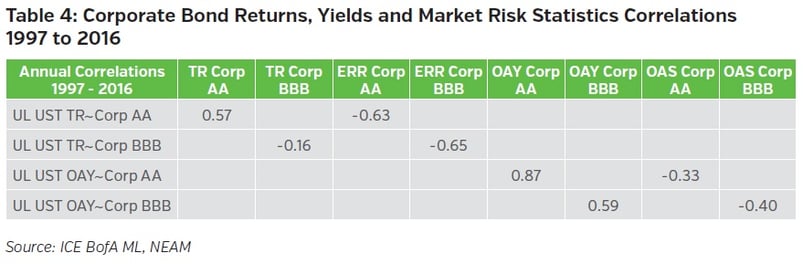
Table 4 shows correlations of total returns and yields of the implied underlying U.S. Treasury (UL UST) bonds of AA and BBB corporates to the total returns, excess returns, market yields and spreads of the AA and BBB corporate bonds. These require careful scrutiny:
- In the case of AA corporate bonds, the total return correlation with that of the underlying Treasury bond (UL UST TR Corp AA) is 0.57, whereas the correlation of the underlying Treasury with the excess return is -0.63.
- Similarly, the market yield and spread of the AA corporate bond with its underlying Treasury yield is 0.87 and -0.33. In both terms of rates of return and yields, credit risk whether measured by excess returns or spreads is negatively correlated with underlying treasury returns and yields, respectively.
- The same is all the more true for BBB corporate bonds.
Filling in the gaps – All together now: Underwriting/Investments/Leverage and Taxes
Chart 6 displays historic fixed-income taxable, tax-exempt and equity pre-tax total returns and calendar year underwriting margins. Taxable and tax-exempt bonds scarcely experienced negative total returns, due in part to coupon offsets to price depreciation. Equities’ total return volatility was muted as it combines with taxable and tax-exempt fixed income, yielding a weighted pre-tax total return series (shown in dark blue below). Underwriting margins exhibited wide variation awaiting a volatility muting combination with a levered diversified investment portfolio.
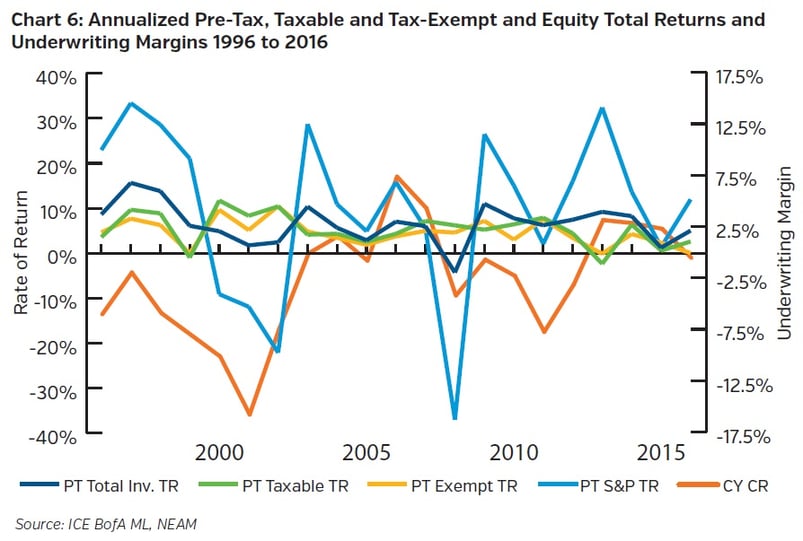
Table 5 shows correlations and statistical averages and standard deviations for investment pre-tax total returns and underwriting margins. Tax-exempt and taxable bonds have an estimated correlation to one another of 0.88 indicating scant diversification benefits. They are, however, negatively correlated to equities over the time period at -0.31 and -0.37, respectively suggesting potentially favorable diversification benefits. The weighted total return on assets (Total ROA TR) is highly correlated to the S&P, although equities represent less than 30% of industry holdings (until the most recent four years) reflecting the directional change impact of the S&P upon the weighted total return but not necessarily the magnitude.
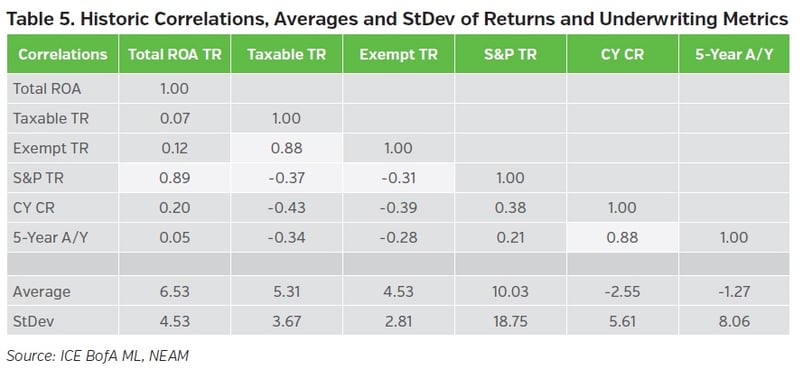
Fixed income assets are negatively correlated to calendar year and five-year developed accident year combined ratios (and the latter are highly positively correlated at 0.88).7 However, the correlation between equity returns and underwriting margins is modestly positive, which results in a very modest positive correlation between the Total ROA TR portfolio and underwriting margins. The negative correlation between fixed income and equities is reflected in the volatility estimate of the Total ROA TR portfolio (4.53).
Table 6 summarizes the combined impact of alternative underwriting metrics, marked-to-market investment return, leverage and taxes on estimates of enterprise VaR. Results are shown on both a pre-tax and after-tax basis.8 The marked-to-market views are shown for both calendar year combined ratios and the five-year developed accident year. Statutory results are as reported. Marked-to-market results are based upon investment total returns proxied by taxable and tax-exempt fixed income indices and the S&P 500 total return index and the industry’s asset allocation.
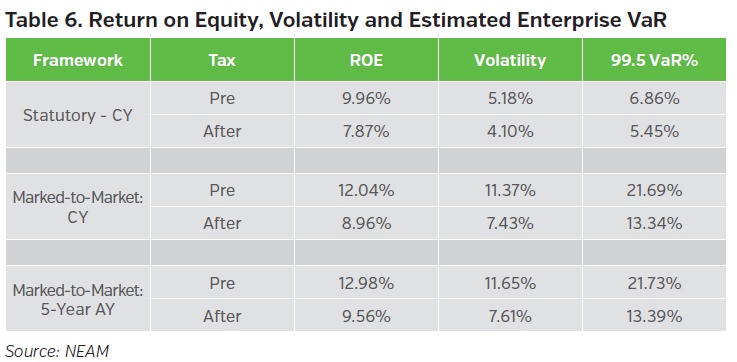
The reported statutory results framework, due principally to the treatment of unrealized gains/losses, provides low estimates of downside risk. Whereas taxes impact rates of return by nearly 210 basis points, their dampening effect upon volatility also lessens their impact upon the estimate of VaR, reducing the amount by about 20%.
Fully accounting for marked-to-market investment risk increases return on equity over 200 basis points to a pre-tax value of 12.04% and triggers more than a doubling of volatility to 11.37% from 5.18%, leading to over a trebling of estimated pre-tax VaR. The incidence of taxes reduces the estimated pre-tax VaR nearly 40%.
Shifting the underwriting metric from calendar year to a five-year developed accident year further increases the rate of return on equity from 12.04% to 12.98%. However, volatility increases but only 18 bps to 7.61%, resulting in a faint 4 bps in pre-tax VaR to 21.73%.
Key takeaways
- Adopting marked-to-market investment metrics can provide more comprehensive estimates of solvency risk than a statutory amortized cost default centric framework.
- Leverage is an important equilibrator of underwriting and investment risk on enterprise volatility.
- Correlation risk and diversification effects can significantly impact VaR estimates and lead to nearly counter intuitive conclusions, requiring continual re-assessment and stress testing. It is important to note that correlation need not imply causality, but, must be accounted for.
- Underwriting metrics have significant impact on assessing underwriting volatility, but less impact on enterprise VaR due to correlation effects and declining leverage. Additionally, loss development has largely been favorable, begging the question of whether there has been a near regime change in pricing and reserving or merely limited response to the secular decline in rates since the 1980’s.
- Taxes greatly impact VaR estimates, requiring their consideration in benchmarking capital adequacy. However, the precision with which this is done is not as simple as we portray; instead, it is part of the multi-period consideration referenced in the beginning of this Perspectives.
- The results we show are based upon industry aggregates and individual company results will vary.
Reader’s feedback and observations are always welcome.
ENDNOTES
1 Conceptually, this formulation applies regardless of the regulatory or rating agency regime or capital model. The components may be estimated differently, which can depend on how the estimated VaR is intended to be used. It is also the framework underlying NEAM’s Enterprise Based Asset Allocation™ process.
2 Taxes are estimated assuming a full rate payer and reflect the appropriate preference rates.
3 On a marked-to-market basis, a bond’s total return equals price change plus coupon. For the holder of the bond, a portion of the bond’s price change from period to period is the amortization of premium or discount to par at the time of purchase. Periodic book income of an insurer equals the coupon plus the amortization (positive for discount and negative for premium). In the three-year period ending 2016 the average annual amortization was -10 basis points for D0A0.
4 Please see U.S. High Grade Indices, January 2, 2018, ICE BofA ML Indices, for complete attribution of D0A0 total return attribution.
5 Total return volatility of credit is based on underlying risk free market rates and credit risk, which can be decomposed further into market valuation due to defaults and the “fear” of defaults. The later overwhelms the former with respect to observable price volatility which is the final arbitrator of risk.
6 This is a real dilemma for solvency assessment, i.e., to distinguish between “incurred” capital drawdowns versus those converted to cash withdrawals. Securities’ valuations might revert to carrying or par value from the time incurred losses are known until they are paid. However, they might also further deteriorate if general market conditions decline. In the latter case, the metrics of measurement must be used, which can account for such a possibility. Traditional ALM and default risk management will not account for such events. Additionally, there are momentary episodic periods when markets size up and there is no bid for the price offer to sell.
7 The income return of taxable and tax-exempt fixed income securities is nearly 20% more negatively correlated with both calendar and accident year underwriting margins than their respective total returns.
8 Statutory results are shown at the actual effective tax rate incurred year-by-year. Marked-to-market taxes assume full rate payer by income source.


