
FINANCIAL HIGHLIGHTS
Recent History and Trends
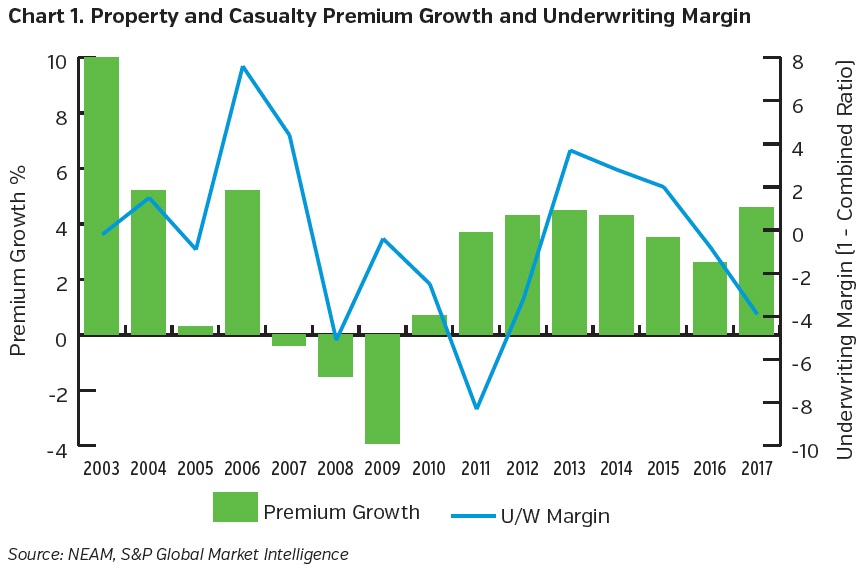
Recent premium growth for the property and casualty insurance industry has been hovering at 4% as the underwriting margin continues to show volatility and returned to unprofitable levels.
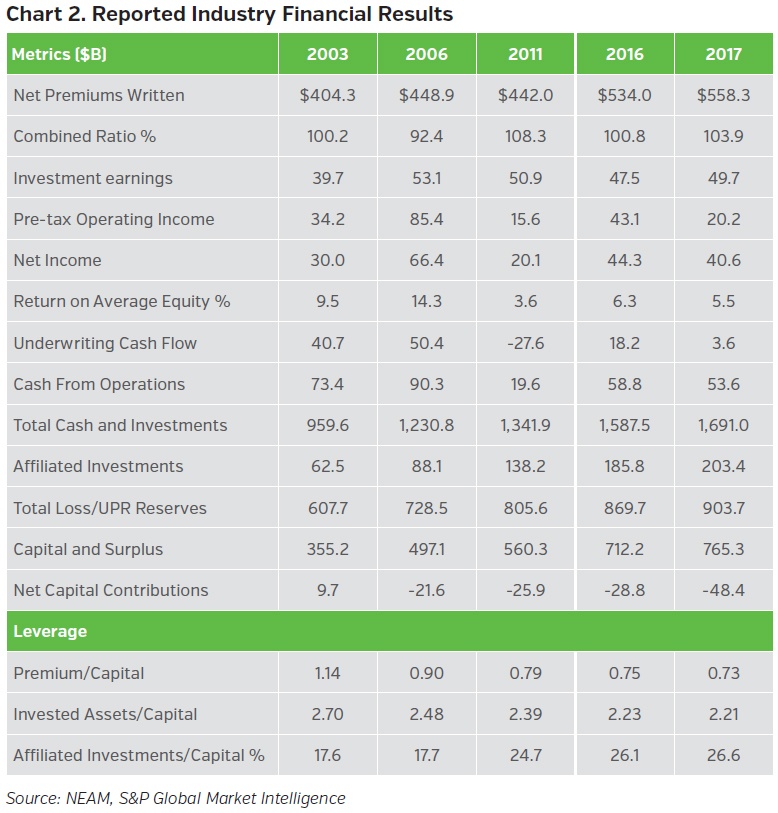
In the overview of industry financial results below, Return on Equity (ROE) remains in the low to mid single digits. Capital and surplus continues to increase despite steady capital withdrawals. Operating leverage declines to a new low reflecting these increases and trailing premium growth. And, despite robust asset growth which leads to declining investment leverage, investment earnings are significantly less than pre-crisis levels as yields remain at record lows.
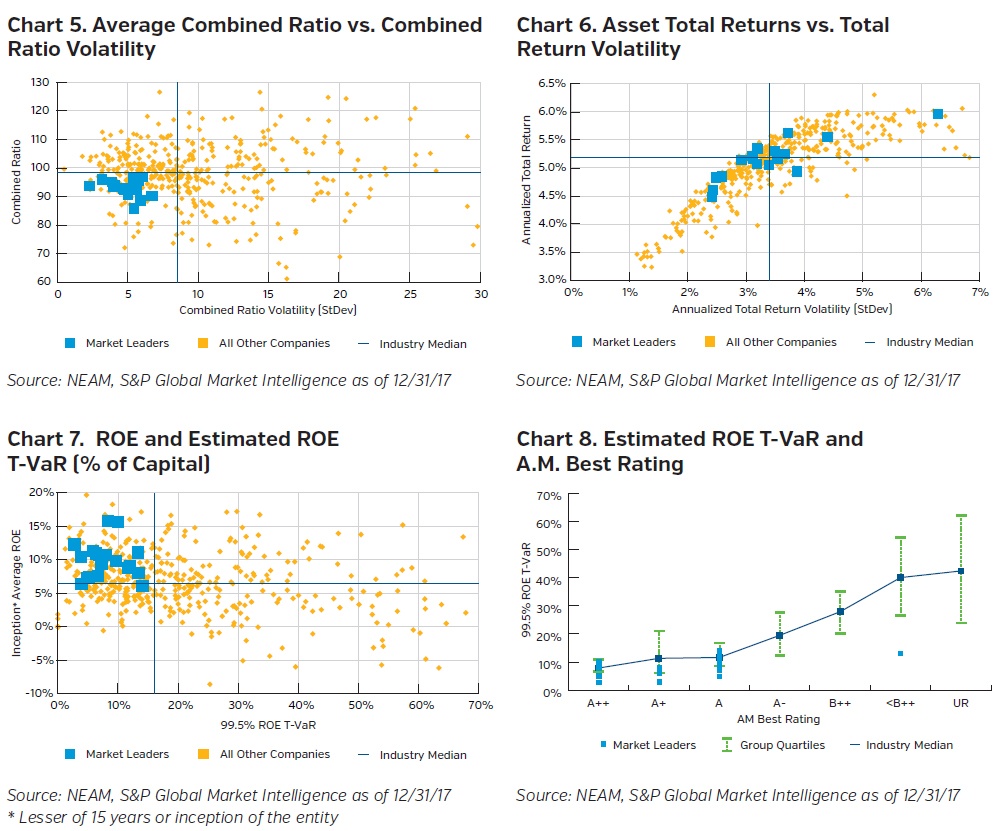
Against this backdrop of modest industry aggregate results there are underwriting market leaders that consistently outperform industry averages (see Chart 3). When compared to industry-wide averages, these insurers achieve superior results in these key criteria:
- Combined ratio
- Combined ratio volatility
- Premium growth
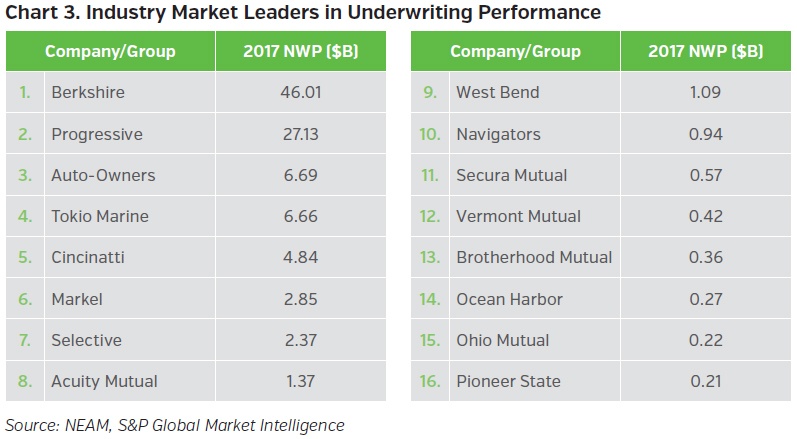
Chart 4 compares market leaders’ underwriting results to industry aggregates for the last 20- year, 10-year and 5-year periods. Across the board the results are impressive, displaying stark differences to industry wide results.
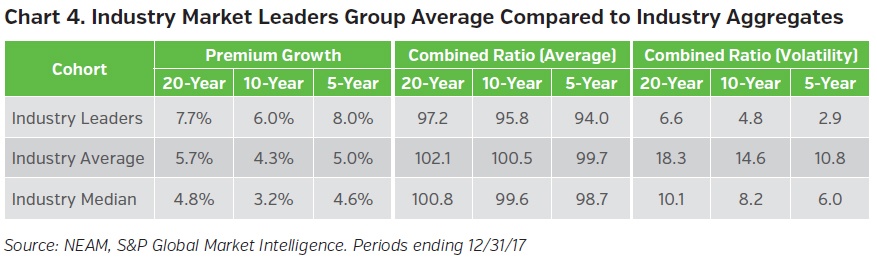
Market leaders are well-positioned with their superior underwriting results which most often drive favorable enterprise ROE performance and support for favorable A.M. Best ratings, as shown in story book Charts 5 to 8 below.
INVESTED ASSETS
Key Trends to Watch
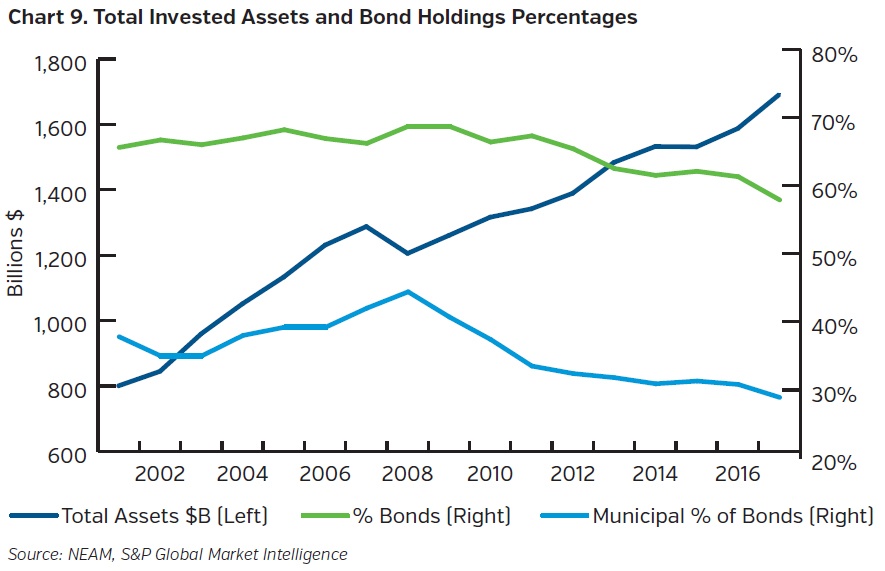
Within the realm of invested assets, the most notable trends are the declining (municipal) bond allocation and the growth of affiliated “alternative” (Schedule BA) assets. Chart 9 below specifically addresses Schedule D and (municipal) bond holdings as a percent of total invested assets. Within the last two decades, total bonds and municipal bonds peaked in 2008, however, the decline has been most severe for municipals. While whereas the decreasing municipal allocation was widely spread across the industry, four companies accounted for 100 percent of the net decline with one of these for very apparent underwriting loss reasons.
Municipal bonds historically have been favored heavily by those companies with superior underwriting results, as shown in Chart 10. These same companies further demonstrate their commitment to municipal securities by owning longer dated bonds taking advantage of the historically more dominant relative value for longer dated municipal bonds.
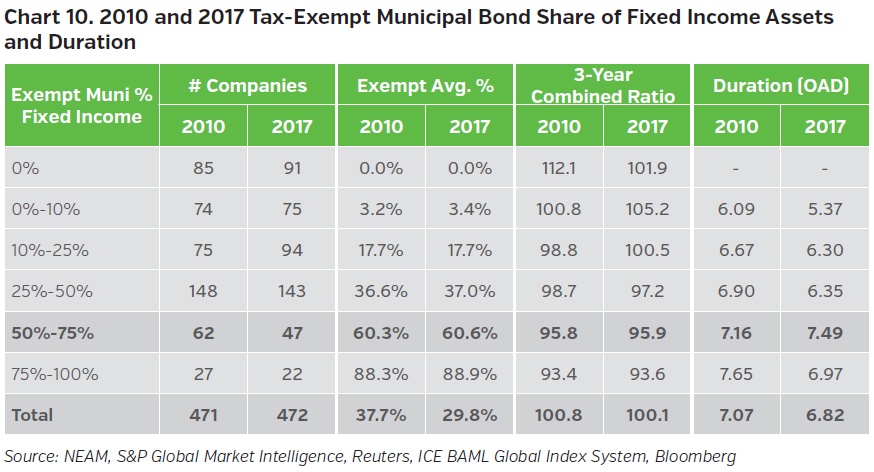
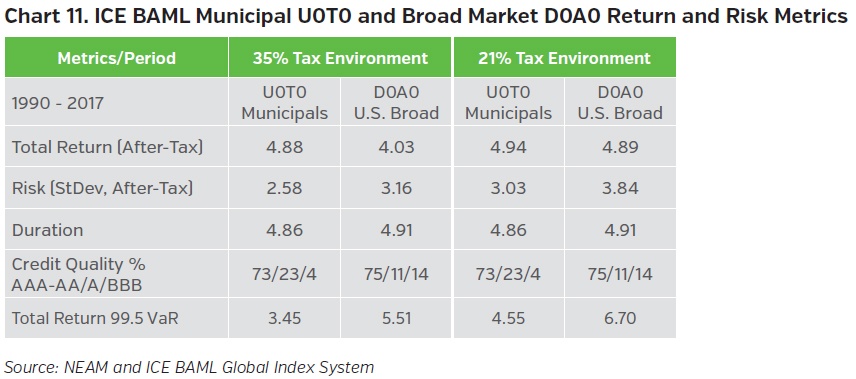
Chart 11 below highlights the impact of recent tax law changes upon municipal and taxable bonds of comparable credit quality and duration. The changes have significantly lessened the after-tax return advantages of tax-exempt municipal bonds. However, their relative low volatility advantage actually increases in the lower tax rate environment. Net-net, widespread municipal ownership–even among underwriting leaders–will be challenged by tax law economics and further aggravated as interest rates increase as we will demonstrate in our final section.
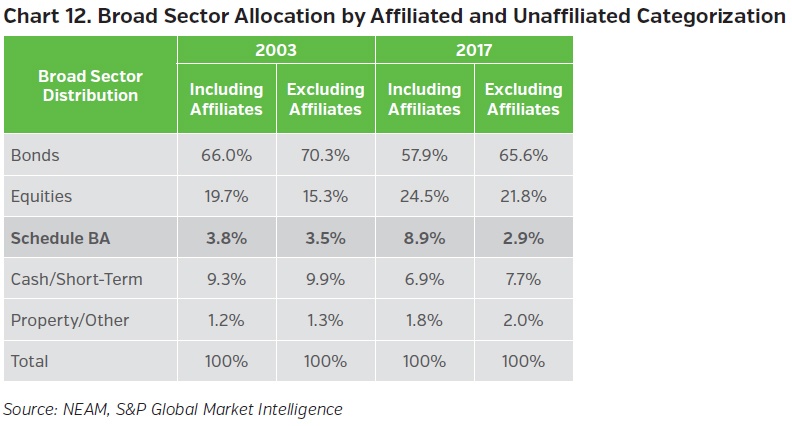
The distinction between “affiliated” and “unaffiliated” invested assets can be crucial when examining asset allocations. Affiliated assets can include captive distribution systems or 100 percent owned railroads. Unaffiliated assets are arms-length investments most often in publicly traded securities and requiring less (preventing) operational involvement.
Chart 12 displays these distinctions across broad asset categories. The asset share for affiliated and unaffiliated bonds and equities had similar directional change: bonds declining and equities increasing. However, whereas Schedule BA (“alternatives”) affiliated assets increased significantly, unaffiliated assets actually declined lessening the relevance of the folklore of widespread alternative asset ownership.
FIXED INCOME
Sector Allocation – An Evolving Landscape
Within fixed income, the municipal allocation peaked in 2008. Corporates were the greatest “winner,” and structured securities (ABS/CMBS and MBS/CMO) were a wash (Chart 13). 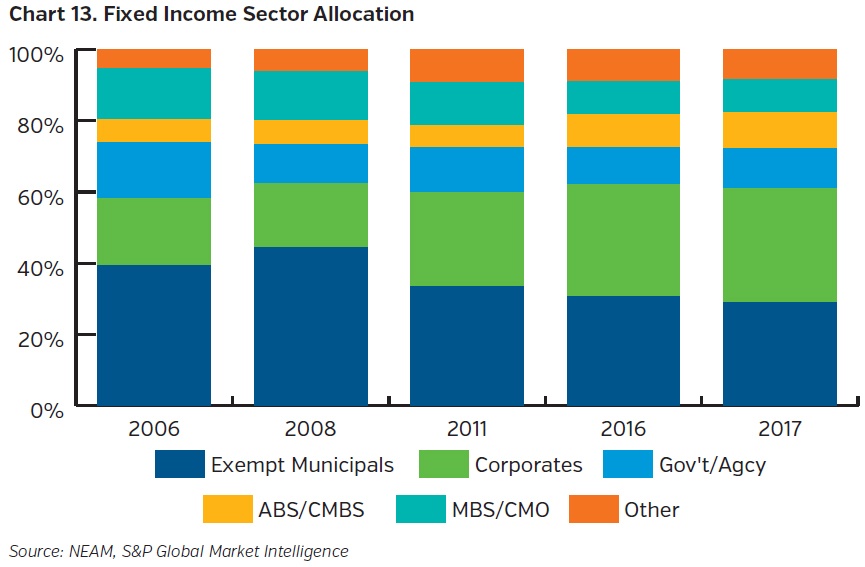
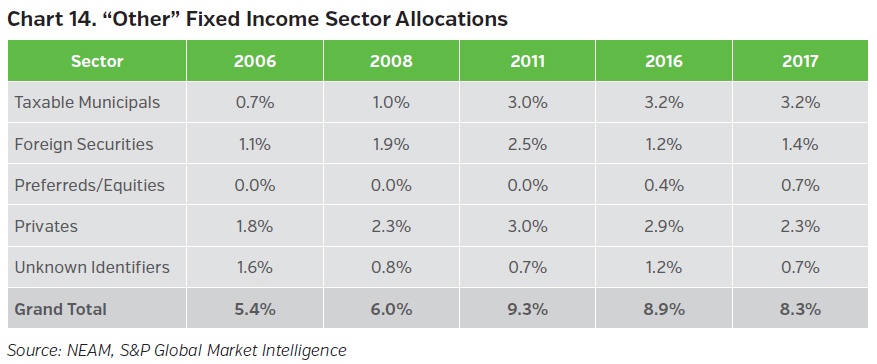
Taxable municipals gained (and have retained) fixed income share within the increasing “other” category as shown in Chart 14. Their ownership is broad based. Holdings among the remaining categories ebb and flow and are less broadly owned.
Book Yield and Option Adjusted Duration
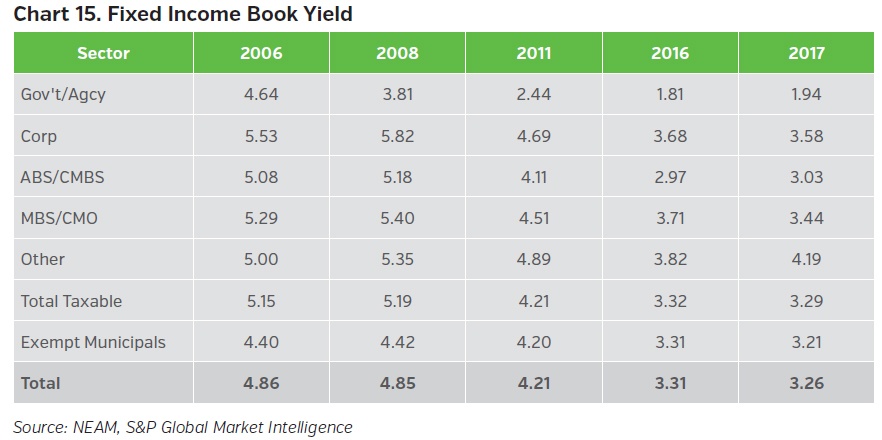
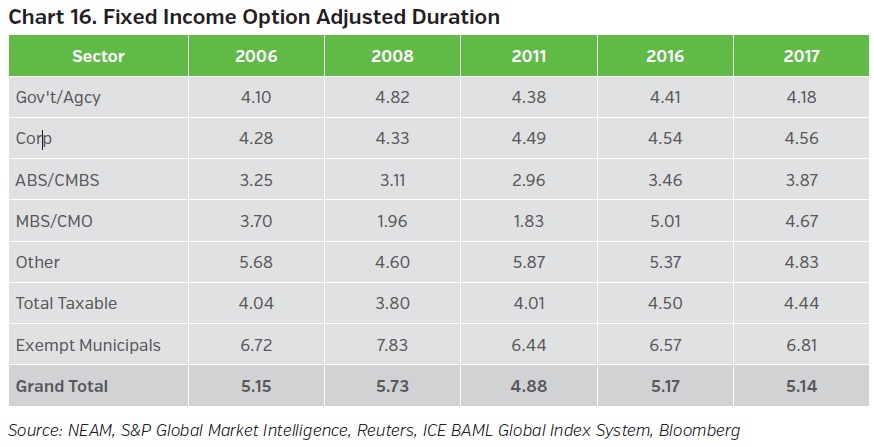
The fixed income overall book yield declined 160 bps from 2006 to 2017. The book yield for taxable bonds exceeds the municipal exempt yield, reversing the 2012 to 2015 municipal average advantage of 20 bps. Taxable bonds book yield declined more than 180 bps while municipal bond yields decline was less than 120 bps. The differential was due to changes in market yield and a greater portion of taxable bonds maturing in the declining rate environment because of lower duration purchases and a lowering of taxable credit quality.
The total year-over-year 2016 to 2017 option adjusted duration (OAD) remained basically unchanged as shown in Chart 16 although there were different directional changes among the sectors. Tax-exempt OAD was two-to two-and-a-half years greater than taxable bonds over the 2006 to 2017 period.
Credit Quality
Credit quality peaked prior to the financial crisis, as shown in Chart 17. At that time, bonds rated triple BBB or less totaled 7.5%. By 2017 their share increased three-fold to 22.5%.
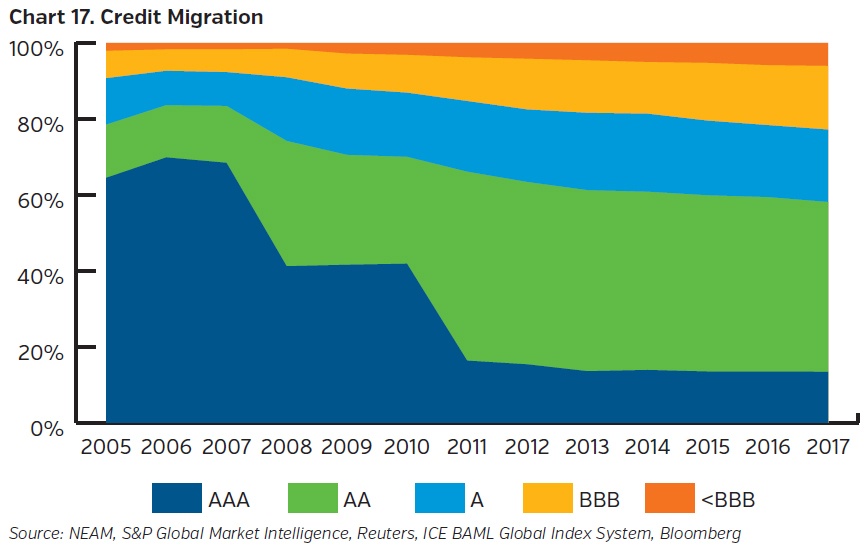
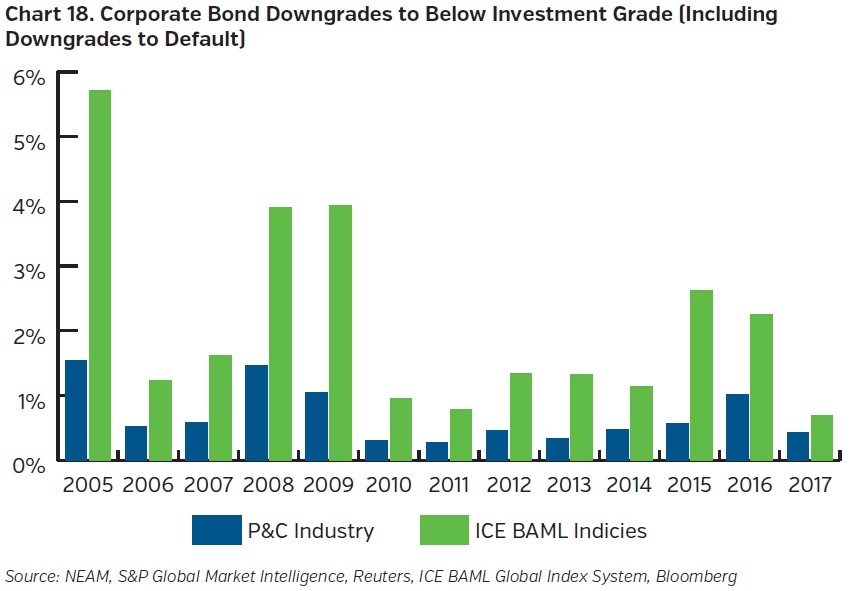
Overall, industry downgrade experience of year-end holdings is better than the U.S. corporate credit universe measured by the ICE BAML corporate bond indices’ constituents. Credit deterioration is due primarily to purchases, not downgrades. While industry downgrades remain low, there is wide variation among companies and credit quality drifted downward.
CREDIT-DURATION
Comparison of Taxable Bonds
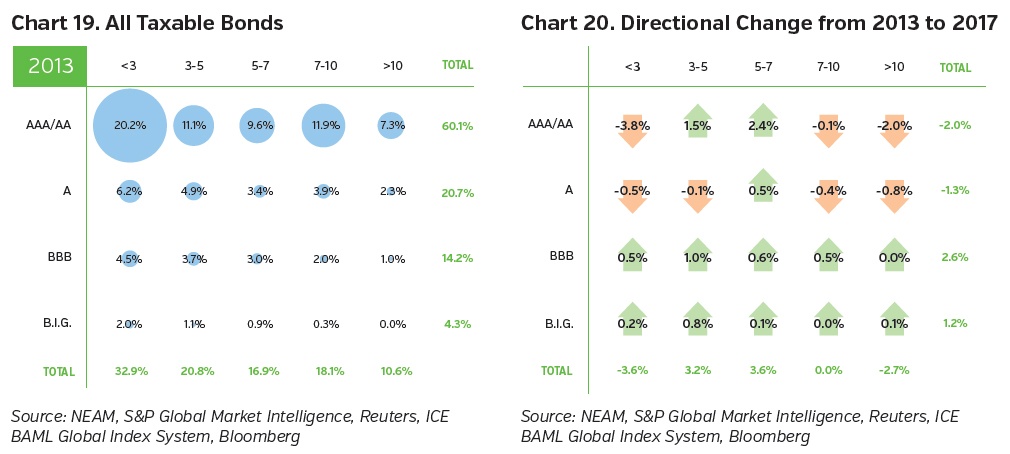
Taxable bonds displayed modest credit-duration as shown in Chart 19. Generally speaking, lesser rated bonds were proportionately shorter in duration. Chart 20 shows the directional change to 2017; BBB and lesser rated securities increased their share of holdings across the term structure and higher rated securities were mixed.
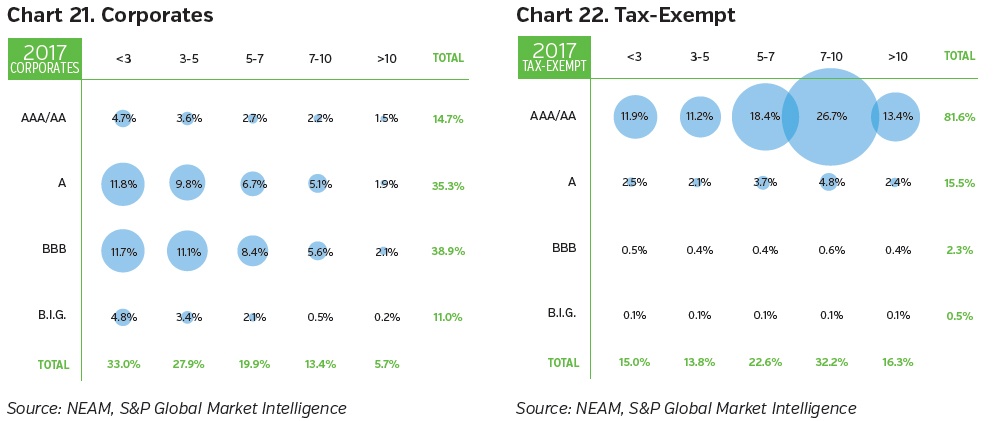
2017 CORPORATE AND TAX-EXEMPT COMPARATIVE
Considerations as Tax-Exempt Securities Wane
Since 2008 corporate securities have been the “go to” sector as the tax-exempt municipal bond allocation has declined. In total, structured securities have held steady despite their favorable credit quality and risk adjusted return attributes. Charts 21 and 22 below display the 2017 credit-duration profile of corporate and exempt holdings, respectively. As the municipal allocation continues to move lower, portfolio credit quality will decline unless higher quality securities, such as structured bonds, are purchased. Even market leaders will need to realign their allocations.
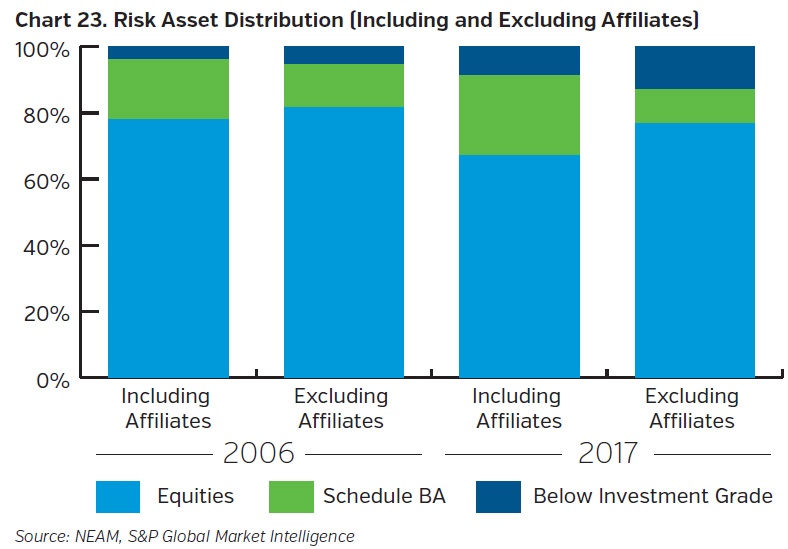
RISK ASSETS
Risk assets are defined as Schedule BA assets, equities and below investment grade securities. They are associated with higher capital charges, greater marked-to-market price volatility and occasionally less liquidity (other than equities). Risk assets continue to be dominated by public equities. BA assets, or “alternatives,” are most prominent when affiliated with an insurer. “Unaffiliated” risk assets are dominated by public equities and bonds, not Schedule BA “alternatives.” Chart 23 highlights these categorizations.
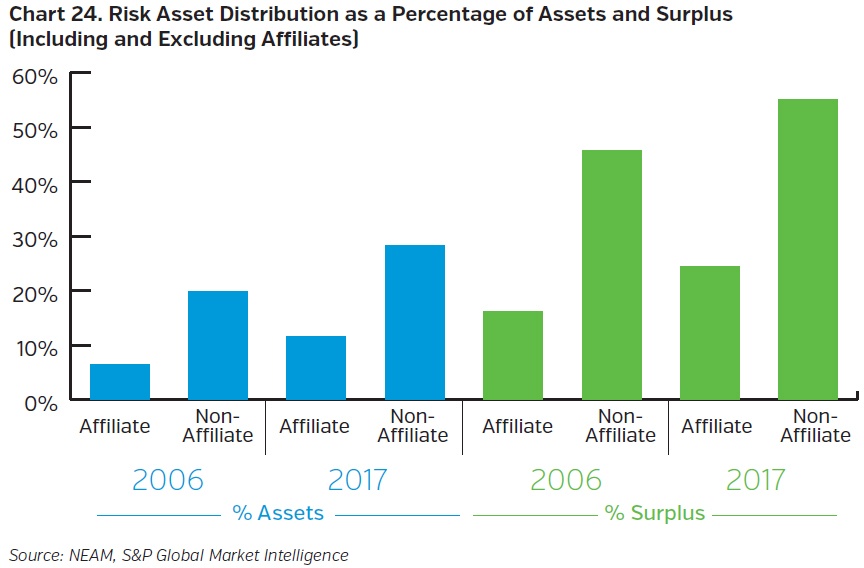
Affiliated and unaffiliated risk assets increased their asset share to 5 and 8 percent, respectively, from 2006 to 2017, as illustrated in Chart 24. Their corresponding share of surplus increased by 8 and 9 percentage points.
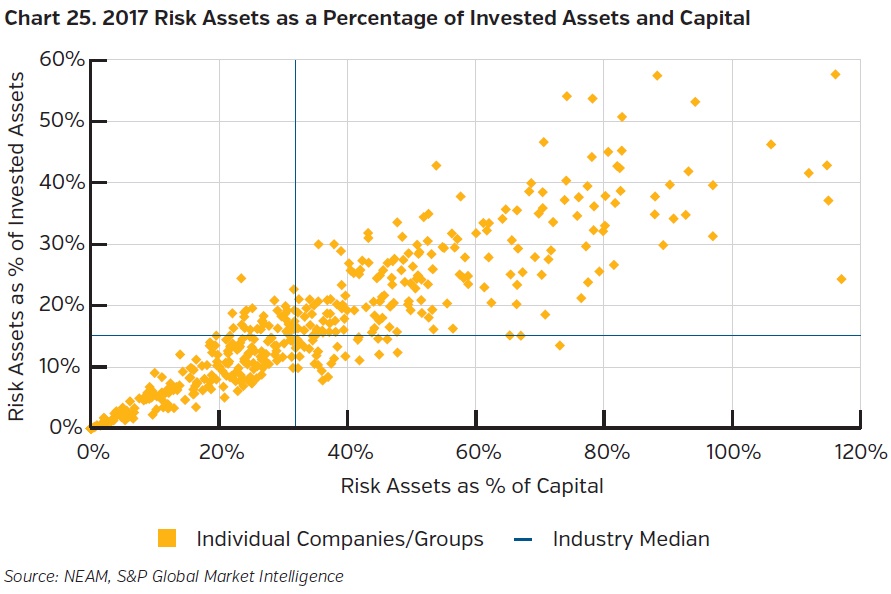
A wide variation exists among companies’ risk assets as a percentage of assets and capital, as shown in Chart 25. Publicly traded equities and below investment grade fixed income securities drive the increase in risk assets, not unaffiliated BA “alternative” assets. The dispersion amongst companies is not size dependent.
MOVING TO THE FUTURE
In the New World Order, optimal portfolio composition requires aligning the combined impact of tax law changes and prospective market returns with the embedded after-tax yield term structure of current fixed income holdings.2 Whereas current capital market returns for eligible assets are the same for all companies, the embedded yield term structure is unique to each company, reflecting past fixed income investing decisions. By way of example, Charts 26 and 27 illustrate the after-tax embedded yield term structure of market leaders’ holdings and today’s and anticipated prospective rates one year forward.3
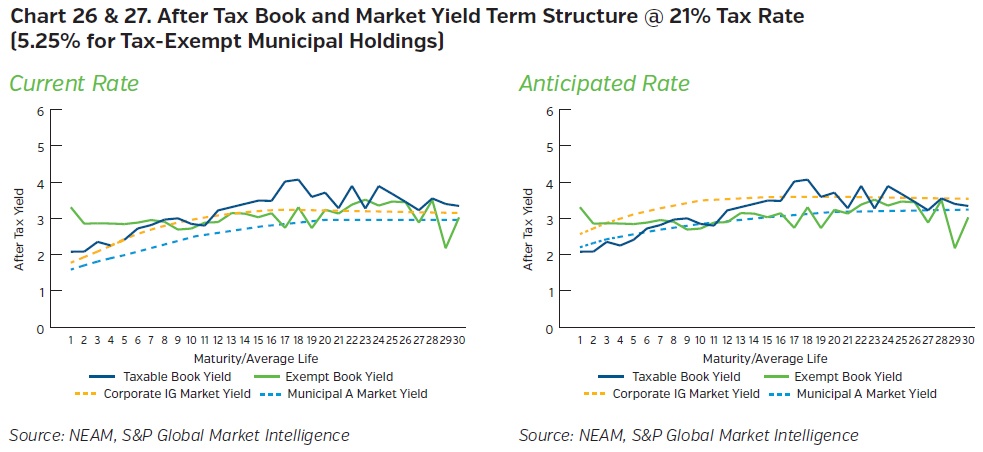
Note that in the first chart, the current embedded after-tax exempt yield term structure dominates after-tax embedded taxable and market yields out to 9 years. Beyond 9 years, taxable bonds most often provide the greatest after-tax yield. If rates rise as anticipated in the second chart, the after-tax market yield term structure of taxable bonds dominates all but the first two years of the tax-exempt embedded term structure. This means that at current rate levels, tax-exempt bonds maturating after nine years are likely sale candidates and rising rates further threaten all tax-exempt holdings with maturities of more than two years.
Enterprise Based Asset Allocation™ (EBAA™)
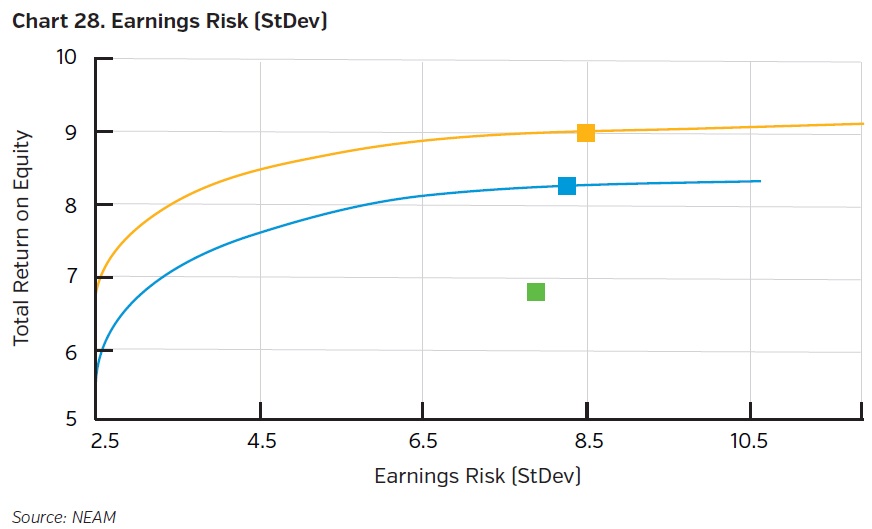
NEAM’s EBAA™ process reflects both underwriting and investment results on an after-tax basis enabling an assessment of both changes in tax law and rising interest rates. Chart 28 depicts the expected enterprise total return and risk based upon market leaders’ year-end 2017 asset allocation (green square) and two after-tax efficient frontiers (blue – current market yields and gold – one year forward projected market yields).
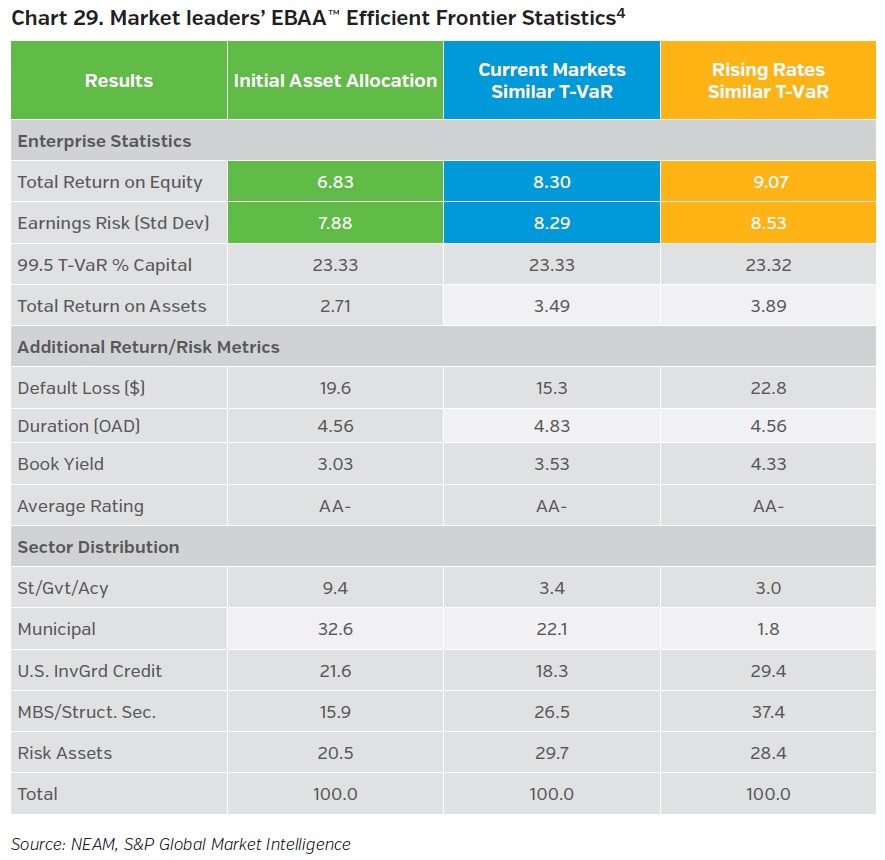
The following Chart 29 displays the associated enterprise statistics, investment metrics and summarized asset allocation. The allocation associated with the blue frontier reveals a meaningful reduction in municipals from current allocation levels due to the impact of the tax law change. Rising rates further disadvantage municipal holdings in the gold frontier. Structured securities, both amortizing fixed rate and floating rate become the primary replacement asset. They are high quality, providing competitive risk adjusted returns and offering greater interest rate protection in rising rate environments than bullet fixed rate corporate bonds.
KEY TAKEAWAYS
- Continued underwriting volatility and return of underwriting losses spawn continuation of low return on capital.
- A very diverse group of underwriting market leaders significantly outperform industry averages consistently over extended periods of time. However, even they are not immune to the impact of The New World Order.1
- Fixed income yields continue to decline, duration holds fairly constant and credit quality has weakened, reflecting downgrades and purchases of lesser rated (corporate) securities as municipal holdings have waned.
- Growth in “alternative” and risk assets is driven by affiliated assets. The share of unaffiliated schedule BA assets (a large portion of risk assets) has declined.
- The historic decline in the municipal allocation appears due to weakened underwriting results of several large companies. The allocation will decline further and impact even market leaders due to tax law changes. The decline in municipal allocation will accelerate for all companies as (if) interest rates continue to increase.
- Changing tax laws require a “municipal bond replacement solution” and rising, volatile interest rates might require re-evaluation of capital preservation strategies and traditional “buy and hold” fixed income investment practices. High quality amortizing structured (and floating rate) securities help reduce interest rate risk and provide competitive risk adjusted returns.
- NEAM’s Enterprise Based Asset Allocation™ process provides unbiased investment solutions reflecting insurers’ risk tolerances, underwriting results and investment opportunities consistent with tax, regulatory, rating agency and other stakeholder requirements. When was the last time your asset allocations were assessed? Do you think your current investment policy guidelines and benchmarks position you to thrive under the New World Order? Contact us if you’d like to reevaluate your financial goals with the help of NEAM’s EBAA™ process.
ENDNOTES
1 The New World Order is actually driven by three financial considerations: change in tax law; rising rates; and, changes in A.M. Best BCAR capital model. We ignore the third factor in this Perspectives because the impact of these changes upon company positioning is, with few exceptions, inconsequential. Please see Perspectives, ”Investment Capital Charges: Serving Many Masters – Who Matters to You?” January 10, 2017.”
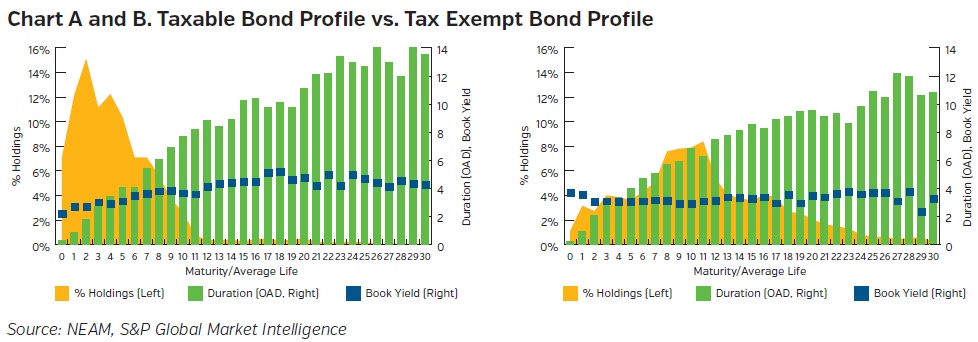
2 The aggregated market leaders fixed income portfolios’ run-off and embedded yield term structure are shown in Chart A (taxable) and B (tax-exempt). There are stark differences in the run-off distributions and the embedded yields across their respective term structures. Other fixed income metrics such as credit quality, defaults, liquidity and duration are also considerations and non-fixed income assets characteristics–including correlations effects–are relevant.
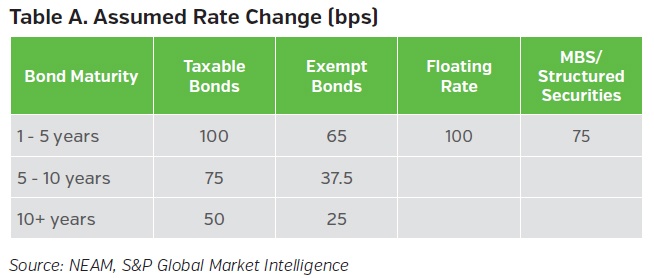
3 In the near-term NEAM expects rates will increase but unevenly by sector and maturity. Table A below summarizes one possible scenario to consider in the portfolio construction process. As rates rise, existing holdings of tax-exempt bonds are increasingly more vulnerable. Rising rates also (temporarily) diminish the market values of existing holdings.
4 The after-tax expected total return on equity for market leaders based upon their 2017 asset
allocation and underwriting margins is estimated at 6.83 percent, assuming reduced tax
rates. Although this amount is roughly 200 basis points higher than industry averages due to
superior underwriting results, it is less than ideal to the relatively low premium and investment
leverage of the market leaders. This sub-optimal capital structure permeates the industry and
is the topic of a future Perspectives.
NEAM’s portfolio management tools utilize deterministic scenario analysis to provide an estimated range of total returns and other investment metrics based on certain assumptions. No representation and warranties are made as to the reasonableness of these assumptions. The projected results contained herein are for illustrative purposes only and do not reflect actual trading or the effect of material economic or market factors.


