
The focus of this issue of Perspectives is to determine whether these regimes, each with different standards and capital adequacy metrics, develop different relative investment capital charges when applied to individual insurers.1 For example, when contrasting the 10 or 25 most (or least) intense capital consumers, are they the same organizations or are they ranked differently across regimes?
The answer has important consequences. If the differences among the regimes are benign, then companies which achieve a favorable position based upon a particular regime would not to be impacted adversely by another regime’s methods. Conversely, if the differences are significant, then aligning to one regime might conflict greatly with others. How should differences be reconciled and managed, given that a company’s global asset allocation needs to satisfy the “one-fits-all” criteria?
We divide this topic into four sections. The first describes the methodology of our review, the second summarizes the results, and the third highlights (any) inconsistencies among the varying regimes. The last identifies a process each insurer might consider to successfully navigate differing regime outcomes. This process will be demonstrated in a companion issue of Perspectives.
A Three-Step Methodology
First, we download the 2011–2015 cusip-level holdings of unaffiliated Schedule D assets, short-term positions and cash for all property and casualty (P/C) insurance companies or groups with invested assets greater than $50 million (approximately 450 entities). The fixed income holdings are enriched with market statistics such as duration, convexity, spreads and ratings from the Nationally Recognized Statistical Rating Organization’s (NRSRO), and added to various book statistics.2 For equity holdings, we capture price and income statistics.
Second, we map the annual holdings of each company or group to one of 58 fixed income or equity indices for which we have maintained daily income, price and market statistics since 1997.3 This mapping classification provides sufficient granularity to calculate fixed income and equity BCAR and risk-based capital (RBC) charges by sector and credit quality; and rate, spread and equity market risk factor charges for the S&P and Solvency II standard formulas.4 The time series of the indices further allows for estimation of Value-at-Risk (VaR) and Tail-Value-at-Risk (T-VaR), based upon historical observable total returns of the constituents which underlie the indices for a “mark-to-market” consistent assessment of risk.5
Finally, for each company or group, we calculate the annual capital charge for each regime (99.5% confidence level and AA aspirational rating for stochastic BCAR and S&P, respectively) and estimate the portfolio VaR and T-VaR at the 99.5% confidence level. We summarize the results to highlight the regimes’ similarities and differences as they apply to the P/C industry in aggregate, and the rankings of companies based upon the various regimes’ charges by year and across time.6
Table I summarizes the sector and fixed income credit quality allocation and capital charges for the P/C industry’s 2015 year-end holdings. Current deterministic BCAR and RBC provide the lowest charges and are the most similar, reflecting their emphasis on default risk-based credit ratings and equity valuation. In these two regimes, spread volatility is not assigned a separate charge; rather, it is embedded in interest rate risk which is explicitly assigned only if a threshold level of fixed income asset and reserve duration mismatch is exceeded.7

Overall, Solvency II and T-VaR capital charge estimates on a pre-diversification basis are quite similar ($282.7 billion versus $300.5 billion). However, there are notable differences among fixed income sectors. Cash, government and agency differences are due to large historic price volatility reflected in the observable return framework of T-VaR estimates, which is not addressed in the Solvency II standard formula.8
MBS securities are more adversely affected by the assumed rate and spread factor charges in the Solvency II framework than their corresponding observed total return based T-VaR estimates. This is the opposite for ABS/CMBS, wherein the spread and rate risk factors significantly understate historic observable price-based T-VaR, volatility and potential liquidity shortfalls in periods of financial stress.
Diversification accounts for the single greatest difference between Solvency II and historic-based T-VaR estimates. The Solvency II standard formula assumes a positive correlation between rates and spreads, thereby reducing diversification benefits. The T-VaR methodology reflects the observed negative correlation of rates and excess returns (total return counterpart to spreads), thereby increasing diversification benefits.9
S&P’s capital model’s results, in total, are most similar to T-VaR estimates. However, by sector (except for MBS), credit quality and diversification components they are very dissimilar. Solvency II and S&P are more aligned in their estimates for cash, government and agency, MBS-agency, ABS/CMBS and diversification estimates. By credit quality rating, S&P differs significantly from Solvency II and T-VaR estimates.
Finally, across all regimes – whether the metric is the notional amount of capital charges, the charge per unit of investment or the share of capital charges – equities are a real poster child for capital consumption. And within credit quality ratings, T-VaR estimates ascribe the highest capital charges to high yield, reflecting high historic marked-to-market total return volatility – albeit not necessarily default losses.10 This is shown in Table II.

When we optimize a portfolio, we usually aim to maximize the total return of a portfolio for a given set of constraints. One such constraint may be the limitation of capital charges. We note that the optimal portfolio for one set of capital charges may not be the same portfolio when calibrated for another and moreover, the optimization process for one regime might adversely affect the capital requirement in another to a greater extent than it improves in the first instance.
We have reviewed the relative ranking of insurance entities by capital charges per regime in order to capture the challenges faced by these firms as they move between regulations and rating agencies. We found that the absolute capital requirement can vary greatly across regimes, which is valuable information for entities as it directly affects the capital required for the same investment portfolio.
More importantly, however, when entities are ranked by the capital charge as a percentage of the portfolio, the rank order of the participants also varies, and often to a surprising degree. This means that the regimes we evaluated measure the same entities to diverse standards and place emphasis on different portions of the asset base. This highlights the dilemma that firms face when operating in multiple jurisdictions when capital is a key consideration in the asset allocation process. In this section, we provide charts and data to support our findings.
Chart 1 highlights results for the largest 10 entities in the U.S. P/C industry based on year-end 2015 holdings. The Y axis shows the rank order of a particular entity for the respective regime that is displayed along the X axis. A low rank order position implies a high charge in that regime, so a rank of 0 (area at the top of the chart) for a company means that it has incurred the highest capital charge (as a percent of the portfolio) within the large companies or groups for that regime. BCAR-S and BCAR-D refer to A.M. Best’s prospective stochastic-based and current deterministic frameworks, respectively.
By simply observing some of the rank order moves, we understand the magnitude of differences among the regimes. The more the respective companies’ relative rankings change, the greater the disparate impact of the regime’s approaches and the more convoluted the visual in contrast to flat lining. This is especially the case as we move from factor-to-sector-based approaches and to the more complex modeling of Solvency II and T-VaR.
![]()
It should be noted that not all insurance companies are subject to each regime, in which case this information is not wholly relevant. However, we believe that it will come as a surprise to see such varied capital charges’ rankings for the same portfolio. Furthermore, we believe it is important to quantify the different treatment of entities by the various regimes and to understand situations where these conflict.
In Chart 2 we take a closer look at the drivers of the charges to provide a better understanding of the change dynamics. Benchmarking some portfolios allows us to do this easily. We added four simple portfolios to the analysis: a short duration corporate bond portfolio, a 15-year+ corporate bond portfolio, a structured product portfolio, and, an equity portfolio. A portfolio that is 100% invested in equities will incur the highest possible capital charges across all approaches considered. In a similar manner to Chart 1, as the rank increases (moving from the top area of the chart to the bottom) the capital requirement decreases for a particular regime.

As shown in Chart 2, the largest moves in terms of relative ranking are driven by fixed income holdings. Regimes that take into account maturity as a source of risk will return a much higher capital charge than those where a charge is allocated purely on sector or credit rating. Bond portfolios that have a lower ranking in RBC and BCAR settings move further up the rankings when a maturity or duration dimension is taken into account in Solvency II and NEAM’s observable total return VaR methodology. While this may not be that surprising, the magnitude of some moves is severe.
Modeling techniques such as VaR which use historical returns to measure risk, inherently capture the different behavior and risk of longer-term assets. These approaches, while more complex (and transparent), return an estimate which we believe more accurately captures market risk.
Results – A.M. Best Framework Comparison
A further insight we gained during this exercise is related to the new A.M. Best framework due to be effective in 2017. Introducing a new approach always brings uncertainty, but we have noted a high level of stability among the ranked order of entities when transitioning from the current A.M. Best framework to the proposed stochastic-based one.
In Chart 3 we plot both the absolute charge (blue dots) and the rank order of entities (green dots) for the two approaches. We note that the absolute charge for the same investment portfolio increases by an average of 2.8 times, while the rank order or the relative treatment of firms remains very consistent between the stochastic-based and deterministic frameworks. This is especially true for entities with either the highest or lowest charges.
However, there are a number of entities that appear as “outliers” in terms of ranking differences. When we took a closer look, some of these entities have relatively high concentrations of either equities and/or “BBB and Below” rated holdings, which in one instance resulted in a capital charge increase of over seven times – circled in orange in Chart 3. The rank ordering of the overwhelming number of firms is quite stable on the basis of evaluation changes: the rank order regression R-squared is 0.97.
![]()
Taking our review of the new A.M. Best approach one step further, we examined the differences between their 99.5% and the 95% capital charges by comparing the relative rank differences for entities when switching between the confidence levels. While clearly we expected the absolute capital charge under the 95% approach to be lower than at 99.5%, we were unsure of the “tail” estimate’s impact on the relative rank order.
Chart 4 shows the differences. Entities that fall along the diagonal have the same ranking across the two confidence levels: points for entities below the line show a lower rank under VAR 99.5%; while those above the line will have a lower rank under VAR 95%. Plotting the rank order in this example underscores our focus on the differing treatment across regimes and less on the absolute capital charge in each case, however is it correct to infer that the amount of capital required decreases as we move from the bottom left towards the top right area of the chart for both regimes.
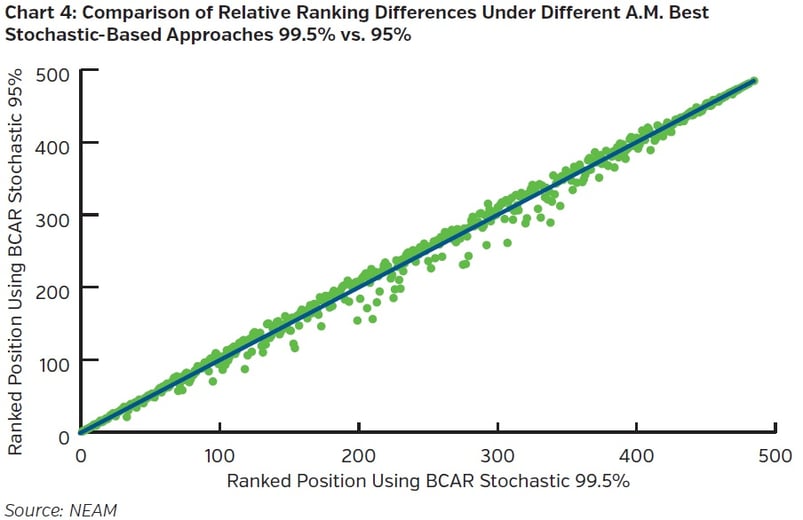
Given that a large number of points appear off the diagonal, we believe the data shows that diverse tail risk exists for different confidence levels and that A.M. Best has captured the differential in the new framework.
Results – Solvency II and S&P Comparisons
A further area of study that is of interest is the approach to capital requirements when moving outside of the U.S. In particular, U.S. companies with European operations are subject to Solvency II and will face the challenges associated with meeting a new set of standards. Moreover, many of these companies are also rated by S&P. While the Solvency II standard formula is now well understood, it has faced criticism from many for the complex approach it has taken to applying capital charges and especially its treatment of sectors such as securitizations.11
In Chart 5 we contrast the S&P double AA aspirational rating capital charges to those of Solvency II‘s standard formula framework. Points which fall along the diagonal are entities where the capital charge (as a percentage of the portfolio market value) is the same in S&P and Solvency II. Those above the line indicate a higher charge in Solvency II, while those below the line show that S&P has captured a higher charge. The overwhelming majority are above the line.
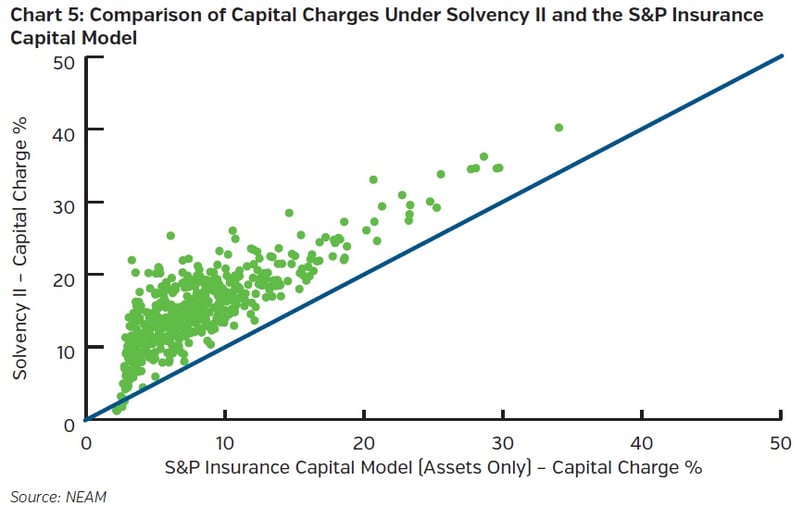
As clearly demonstrated, the capital requirements under Solvency II are higher than they are in S&P for the vast majority of the portfolios considered. Ignoring the change of ranked order outcomes for a moment, companies involved in multiple jurisdictions or considering expanding to other jurisdictions should be aware of the differences and determine the effect this can have on constructing investment portfolios.
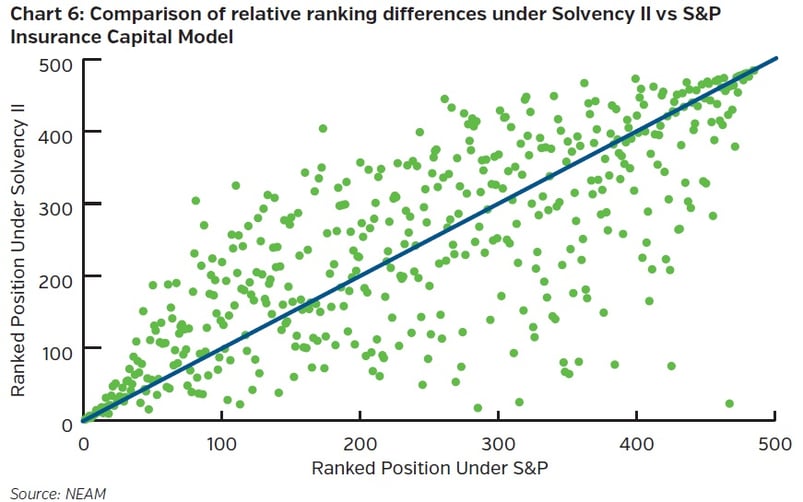
In Chart 6 we show the change in rank order when moving from S&P to Solvency II. Taking the same approach used in Chart 4 we plot the rank order to highlight the differing treatment across the two regimes while ignoring the capital charge. It is also correct to infer that the amount of capital required decreases as we move from the bottom left towards the top right area of the chart for both regimes compared. Unlike the A.M. Best deterministic and stochastic-based frameworks’ comparison, the differences between S&P and Solvency II display a much weaker relationship, suggesting the approach to asset risk is fundamentally quite different. This highlights the need for a comprehensive and robust asset allocation framework given that the optimization process will be complicated: optimizing for one regime may in fact be detrimental to the other.
We do not show the impact of ranked ordered outcomes from contrasting any rating agency or regulatory regime to NEAM’s observable total return marked-to-market consistent VaR/T-VaR estimates in this Perspectives for several reasons. To do so would require a lengthy explanation beyond a reasonable indulgence from our readers. And second, as stated below, we believe the proper role of this method is either as a benchmarking compass or as an alternative to the Solvency II standard formula which individual entities can pursue.
Summary
There are several key points for companies to consider:
- There are only a few similarities among all regimes, such as the high level of charges assessed upon equity holdings.
- The rank ordering of companies’ investment capital consumption can vary dramatically depending upon regime.
- The capital charges rank order between A.M. Best current and stochastic-based frameworks is nearly identical and quite similar to RBC rankings.
- Solvency II and historic T-VaR observed price methods have several similar factor charges, but there are enormous differences in diversification effects due to the magnitude of Solvency II spread and rate correlations which have never been observed.
- Although not shown, the relationships summarized above hold true for prior periods of 2011-2014.
All U.S. domiciled insurers are subject to at least A.M. Best and RBC investment charges. Many larger insurers may have their investment charges assessed by S&P, and, a small number of groups and/or their affiliates are subject to all four regimes. As the NAIC refines its capital charges approach, and if FIO expands its efforts to assess insurer solvency levels, differences in measured outcomes might increase further.
To the extent that the various regimes capital charges can impact enterprise risk tolerance decisions, we believe an enterprise approach to account for and manage capital charges across all regimes is critical to achieving the most favorable risk-adjusted return outcomes. Furthermore, we recommend that organizations subject to Solvency II assessment either utilize an observable total return method of estimation to develop their investment capital charges or deploy such a method to benchmark their economic scenario generators and internal capital models. We will address the multiple regime capital optimization approach in a future issue of Perspectives.
We hope these insights are helpful and informative. As always, your feedback is appreciated.
Endnotes
- FIO is not part of this review as they have yet to provide sufficient details to be included.
- NEAM maintains a proprietary data base of all schedule D fixed income holdings for P/C and Life companies. The data base has been refreshed each year for year-end holdings since 2004. At each year-end market statistics are obtained via Bloomberg and NEAM Analytics and ratings via the NRSO. Replication of the data base would be difficult due to the expiration of market statistics shortly after each year end’s reporting.
- The BofA ML indices are comprised of individual constituent bonds. Prices and market statistics are updated daily. At year-end 2015, the corporate indices accounted for more than 95% of investment grade and below investment grade holdings of the P/C and Life industry. Coverage varies by other sectors. NEAM augments coverage with additional data partners. Contact NEAM for further details
- The appropriate co-variance (correlation) effects are applied to the sector and factor charges to estimate the respective regimes total asset capital charge.
- The S&P and Solvency II standard formula sector and factor charges and correlations appear not to be based upon observable total return data or prospective return estimates, or with the level of granularity to capture the risk profiles of individual insurers’ holdings. This is a central failing within the two regimes. Additionally, neither regime accounts for default risk independently of spread risk. Current BCAR and RBC explicitly address default risk, but not spread risk. Instead, they account for the later as an element within interest rate risk which is related to reserve duration.
- To account for changes in capital charges across time, we “freeze” the legal entity structure as of year-end 2015 and “re-state” individual companies’ prior year asset allocations as if only the 2015 entities had been members of the group in each prior year. Accordingly, a company’s evolving asset allocation could be the consequence of asset allocation changes due to buying or selling securities or mergers, acquisitions and divestitures.
- Note that this review considers asset charges only, and does not consider the relative weighting of an asset charge in relation to other charges or any correlation or diversification between asset and other charges within the various regimes’ models.
- In all regimes, other than the observable total return marked-to-market consistent VaR/T-VaR approach price volatility due to rate and spread is either ignored completely or, accounted for only in instances of deterministic asset/liability duration mismatch. Unfortunately, to be valid, solvency margin estimates for the underlying method must anticipate the collapse of deterministic assumptions.
- See General ReView, September 2014. “Benchmarking Capital Charges: A Top-Down Observable Price Approach.” The standard formula correlation estimates do not isolate excess returns (risk) from interest rate returns (risk). Accordingly, the correlation between spreads and rates within the standard formula methodology is greatly overstated due to the “double accounting” of rate risk.
- Credit market total return volatility measured by cap-weighted indices reflects interest rate sensitivity, perception of credit loss risk and actual default or downgrade losses. NEAM review suggests the perception of credit loss overwhelms actual default losses across the investment grade rating cohorts.
- Punitive capital charges and the additional layers of governance required by Solvency II make securitizations unattractive for insurers, thereby limiting these structures as capital-raising vehicles and investment products. This, combined with the treatment of lesser-rated government bonds and the assumed correlation disconnect from observed historical values suggests modifications to the standard formula are needed when it is used for internal purposes.


