
A cursory view of industry results presents a picture of improvement:
- The largest increase in net premiums (10.7%) in 16 years
- A reduction in the combined ratio to better than breakeven (99.3%)
- Investment income growth at its highest level (14.7%) in the recent past
- A continued high level of policyholder surplus
A more thorough review reveals:
- A sharp reduction in ceded premiums masking a nominal 5% increase in direct premiums
- The combined ratio improvement due to a halving of insured catastrophe losses and aided by continued favorable prior year reserve development1
- Growth in earned investment income primarily due to affiliated asset returns and record operating cash flow
- Improved book yields that were illusory, a false positive, driven by maturities and sales of lower yielding securities
- Industry return on average statutory capital remaining near its longer-term (low) average
Underwriting and investment results show continued wide variation among insurers with industry market leaders recording resilient results.
Financial Highlights
Recent History and Trends
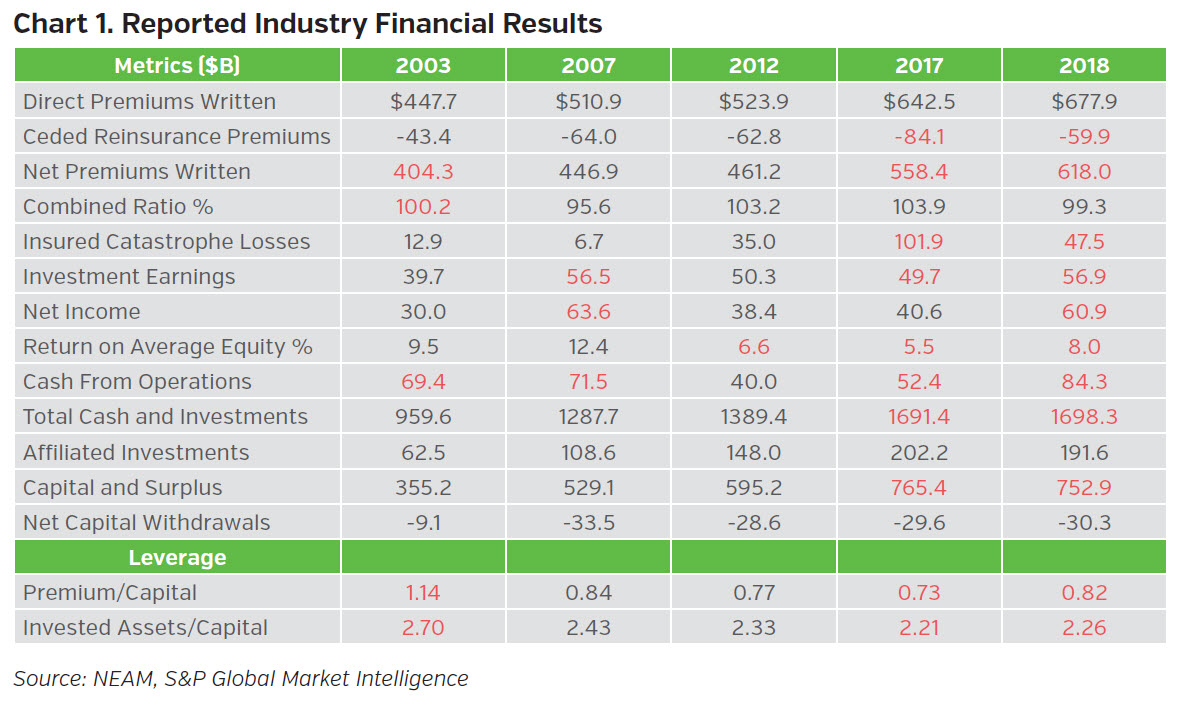
Net premiums written increased over 10%, but in large part due to a significant reduction in ceded reinsurance premiums from the prior year. Return on equity (ROE) increased due to improved underwriting results, led by a reduction in the combined ratio and an uptick in investment earnings largely attributable to affiliated investments. Regardless of the sources of the investment earnings, the increase is welcome albeit the current level barely eclipses pre-crisis levels when the asset base was 70% of 2018 levels.
Although industry ROE increased, it remains in the mid-single digits. Capital and surplus growth faltered due to the Q4 2018 equity market sell-off. Operating leverage (premium-to-capital ratio) reversed a 35-year decline, but for the wrong reasons: an aberrant increase in net written premiums and a decline in equity markets. Shareholder dividends and other net capital withdrawals and contributions remained in line with the last 10 years’ levels. Chart 1 summarizes the results.
Despite the vagaries of catastrophe losses and insurance market cycles, there are
underwriting leaders that consistently outperform industry metrics (see Chart 2). These
companies are a mixture of large, publicly-traded and often global companies and small
regional domestic mutuals2. They were deemed to have achieved superior results by
outperforming industry median results for each of the following three key criteria in each of
three most recent periods: three, five and 20 years.
• Premium growth
• Combined ratio
• Combined ratio volatility
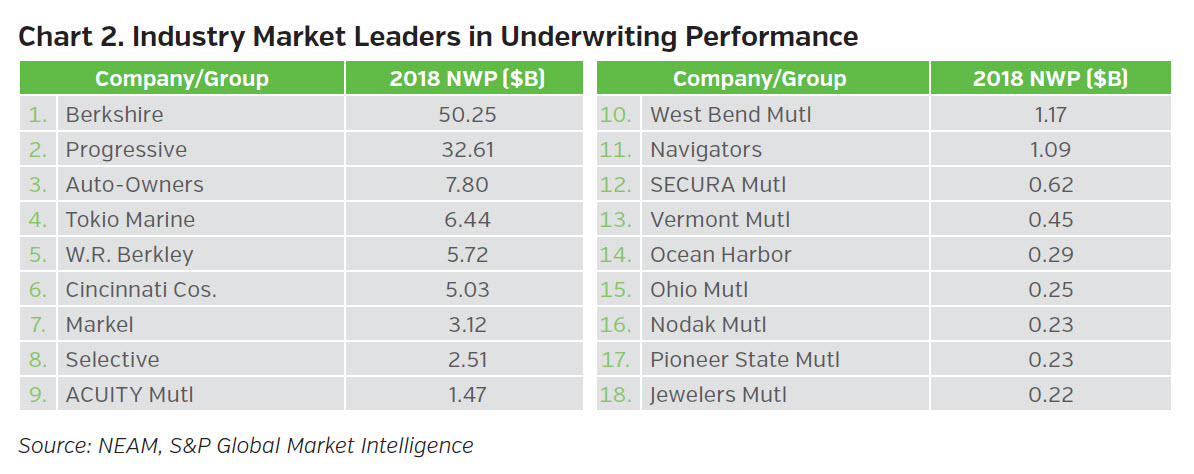
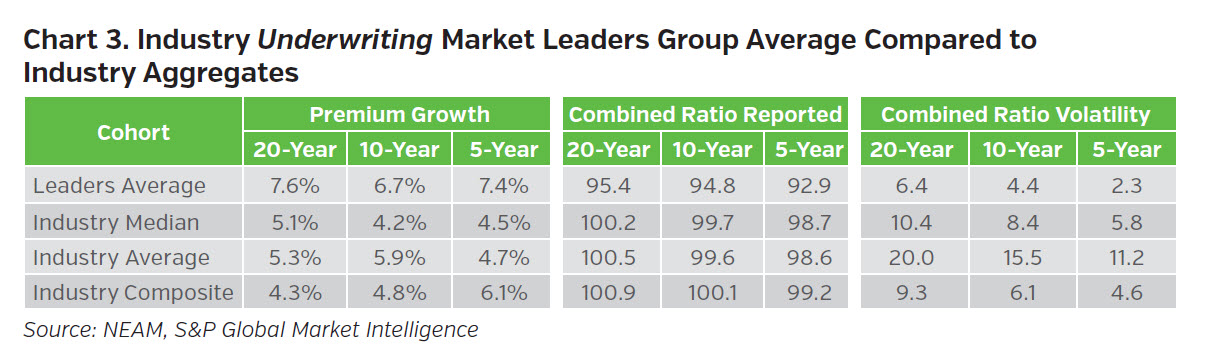
Chart 3 contrasts market leaders’ underwriting performance to industry outcomes. The results are impressive, displaying stark differences in all categories: premium growth, reported combined ratio, and combined ratio volatility.
The initial approach to determine investment leadership focused on total return and volatility across all publicly-held securities within our industry-wide company level cusip database for the most recent three, five, 10 and 14 years. The analysis proved too difficult due to data limitations, the diversity of investment objectives and changing asset allocations: it netted only one company.
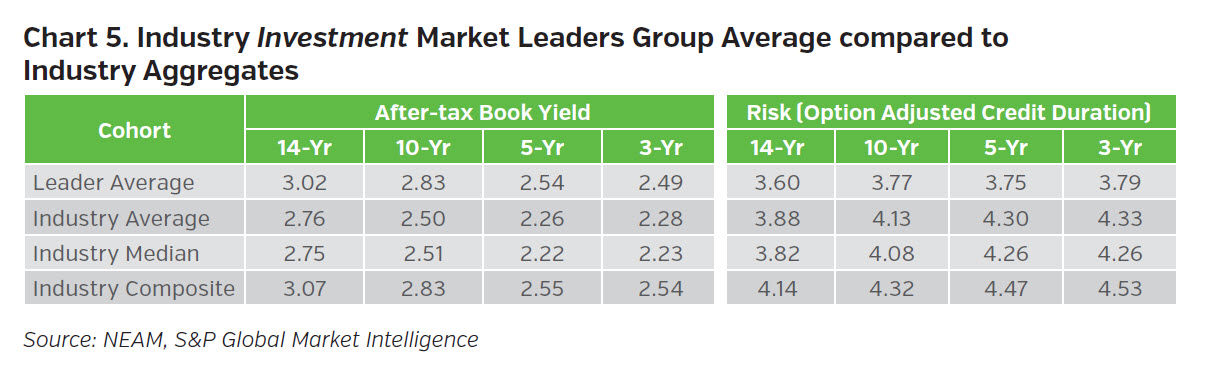
Accordingly, we opted for another approach, one addressing only fixed income and focusing on after-tax book yield and market risk defined as option adjusted credit duration. The leadership board is shown in Chart 4 below.
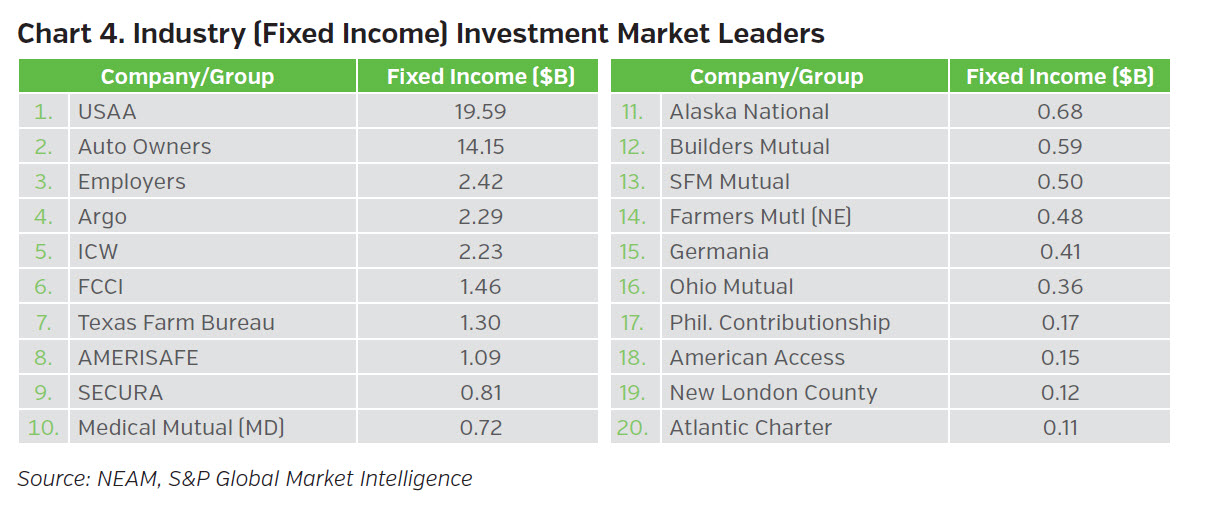
There are 20 companies surpassing the industry median company performance benchmark. The group is less diverse than the underwriting leaders group. The companies tend to be small to medium size with a nearly exclusive U.S. focus - mostly mutual and reciprocals with either a targeted customer demographic and/or specialty or monoline products. As shown in Chart 5, they soundly outperform industry and average returns, and all industry categories for risk metrics.
As shown in Chart 6 below, industry underwriting leaders are well-positioned with their superior underwriting results to most often drive the most favorable enterprise ROE performance to support favorable AM Best ratings. All but three leaders cluster in the northwest quadrant of the left-hand chart and all exceed industry median ROE estimates.3
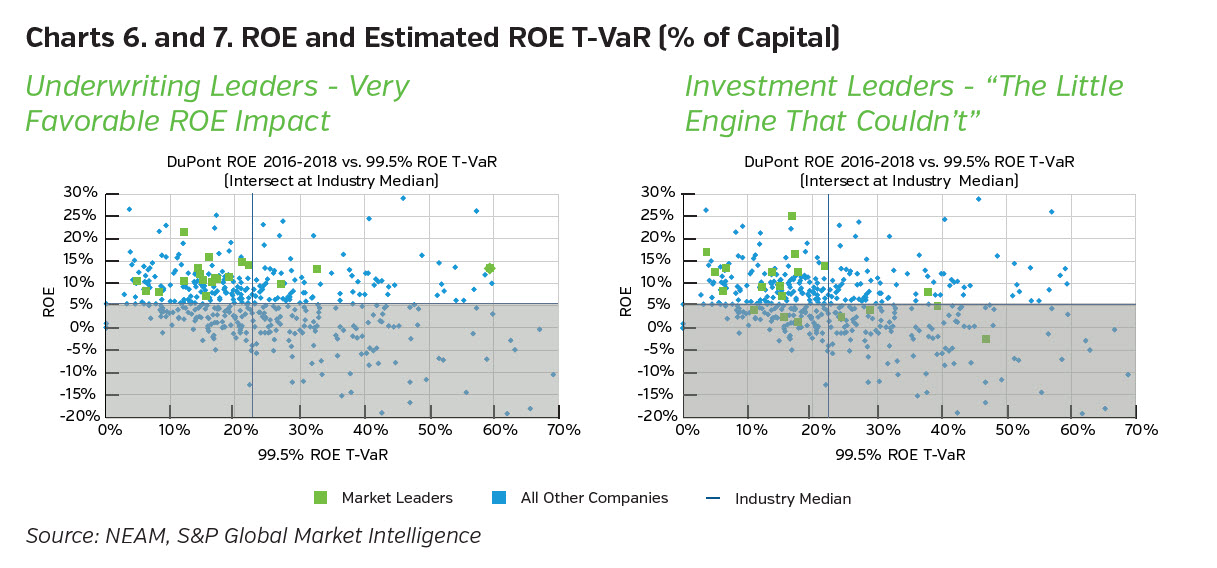
Industry investment leaders have a less direct impact on a favorable ROE as shown in the right-hand chart above, wherein several companies’ estimated ROE is below the industry median (suggesting less favorable underwriting results). However, the clustering in the northwest corner of the chart indicates a very favorable contribution for some companies.
WHAT’S NEXT?
This lead Perspectives highlights variations among insurers underwriting and investment results
and the impact on historic return on equity. Visit www.neamgroup.com/insights/2018highlights
to access the full report of 2018 investment results and read evolving trends in industry
investment practices, which might impact your assessment of your investment outcomes.
Endnotes
1 2018 insured U.S. catastrophe losses reported by Insurance Information Institute (I.I.I.) totaled $48B down from 2017 estimated loss of $102B, yet double the 10-year average excluding the 2017 all-time high amount.
2 Results reflect only U.S. Statutory Statement reported results.
3 The Green dots represent the 480 largest P&C entities accounting for over 97% of industry assets. The Blue dots are industry leaders.


