A cursory view of industry results presents a picture of improvement:
- The largest increase in net premiums (10.7%) in 16 years
- A reduction in the combined ratio to better than breakeven (99.3%)
- Investment income growth at its highest level (14.7%) in the recent past
- A continued high level of policyholder surplus
- A sharp reduction in ceded premiums masking a nominal 5% increase in direct premiums
- The combined ratio improvement due to a halving of insured catastrophe losses and aided by continued favorable prior year reserve development1
- Growth in earned investment income primarily due to affiliated asset returns and record operating cash flow
- Improved book yields that were a false positive, in part driven by maturities and sales of lower yielding securities and paydowns, not simply increased purchased yields
- Industry return on average statutory capital remaining near its longer-term (low) average
Underwriting and investment results show continued wide variation among insurers, with industry market leaders recording very resilient results.
Financial Highlights
Recent History and Trends
Net premiums written increased over 10%, but in large part due to a significant reduction in ceded reinsurance premiums from the prior year. Return on equity (ROE) increased due to improved underwriting results, led by a reduction in the combined ratio and an uptick in investment earnings largely attributable to affiliated investments. Regardless of the sources of the investment earnings, the increase is welcome, albeit the current level barely eclipses pre-crisis levels when the asset base was 70% of 2018 levels.
Although ROE increased, it remains in the mid-single digits. Capital and surplus growth faltered due to the Q4 2018 equity market sell-off. Operating leverage (premium-to-capital ratio) reversed a 35-year decline, but for the wrong reasons: an aberrant increase in net written premiums and a decline in equity markets. Shareholder dividends and other net capital withdrawals and contributions remained in line with the last 10 years’ levels.
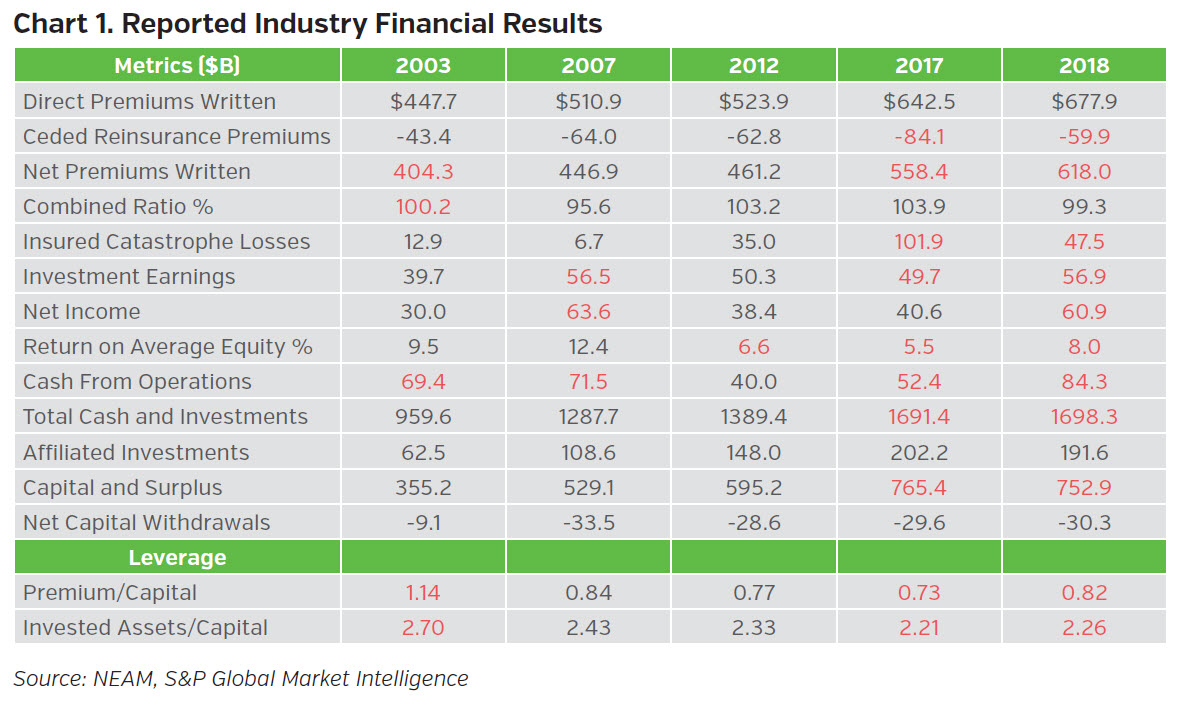
In summary, premiums trail exposure growth and claims inflation. Combined ratios with “normal” catastrophe losses barely breakeven. Core unaffiliated investment income trails operating cash flow, and ROE trails most of the last 15 years. Chart 1 summarizes the industry’s results, suggesting a need for market leaders which, like the children of Lake Woebegone, are all “better than average.”
Underwriting and Investment Market Leaders
We provided an update of underwriting leaders and an introduction to investment leaders in the teaser edition of Perspectives, “Don’t Uncork the Champagne.” The key takeaway is that despite less than spectacular industry operating results, there are select companies which consistently achieve superior underwriting or investment results across multiple metrics and time periods.
Chart 2 illustrates that industry underwriting market leaders are well-positioned with their superior underwriting results to most often drive favorable enterprise ROE performance. All but three leaders cluster in the northwest quadrant of the left panel and all leaders exceed industry median ROE estimates.2
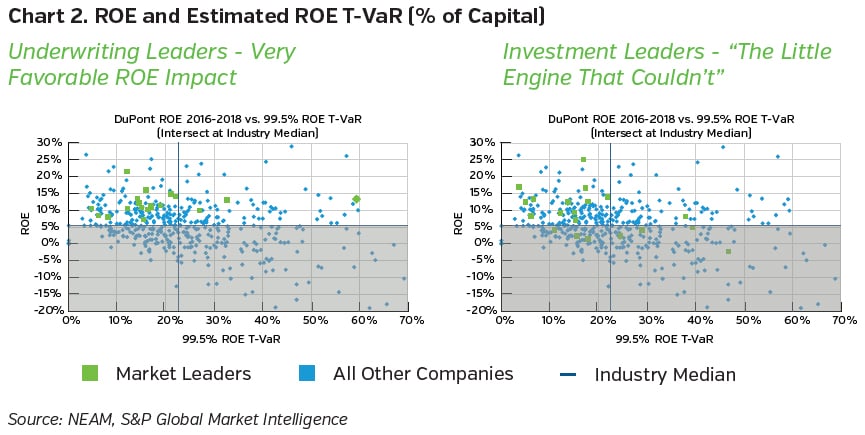
Industry investment leaders have a less direct impact on a favorable ROE outcome, as shown in the right panel in Chart 2 above where several companies’ estimated ROE is below the industry median (suggesting less favorable underwriting results). However, those companies clustering in the northwest corner of the right panel indicate a favorable contribution for some companies.3
Investment Highlights
Later in this Perspectives, we address the underlying components of investment outcomes. Our focus is on the role of affiliated assets in estimates of industry-wide earned investment income and the counter-intuitive behavior of reported book yields.
Broad Sector Allocations and the Role of Affiliated and Unaffiliated Designations
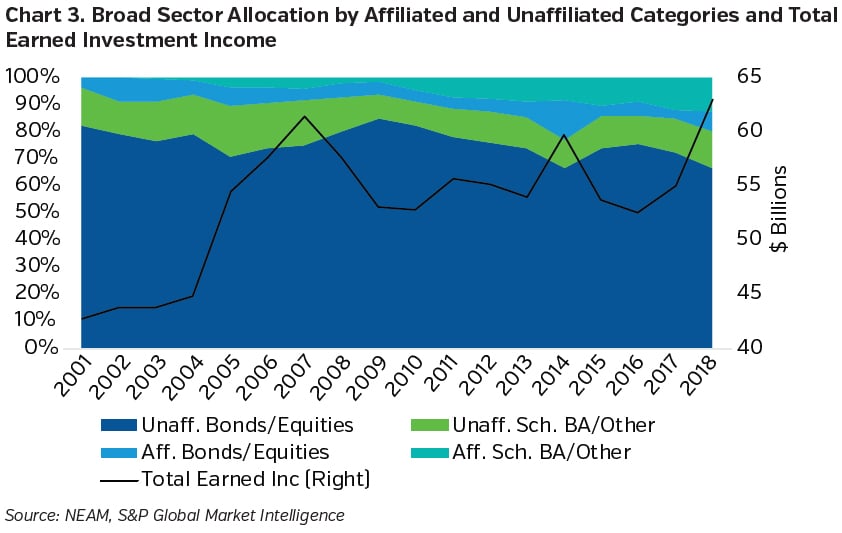
Chart 3 below displays the year-to-year progression of the affiliated and unaffiliated categories of long-term assets and total earned investment income. From 2001 through 2018 affiliated assets increased from 6.8% to 11.3% of invested assets. And importantly, total earned investment income eclipsed the 2007 peak for the first time in 2018 (albeit on an asset base of 30% greater value).
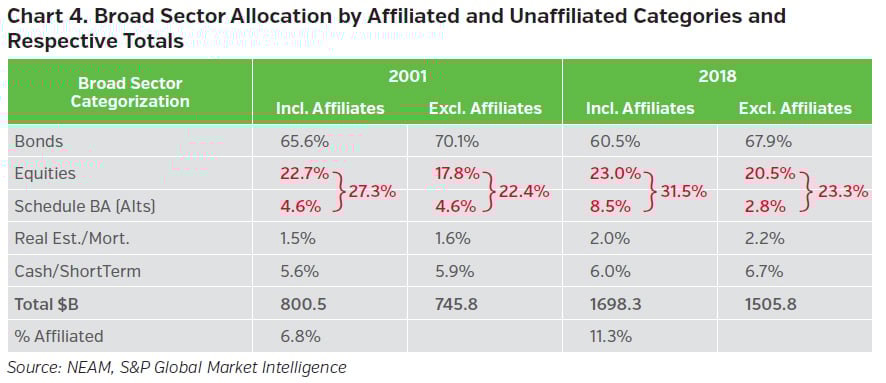
Frequently, Schedule BA assets are viewed as “alternative investments.” In Chart 4 below, we provide greater granularity of the broad asset class designations, but for only two time periods: 2001 and 2018. We note that whether including or excluding affiliate designations, bonds and equities are the dominant asset classes with nominal changes in their respective weightings.
However, of particular note and importance is the classification of Schedule BA assets. When including the impact of affiliate assets, the Schedule BA component has grown from 4.6% to 8.5% of total assets which, in turn, has more than doubled over the time period. This growth in share of an increasing asset base is used as an occasional “keeping-up with the Jones” argument that “alternative investments” should be a key component of insurers’ investments. Yet, when the focus is unaffiliated assets, we find Schedule BA assets have actually declined from 4.6% to 2.8%.
The distinction between affiliated and unaffiliated assets is key – but often ignored – in the “alternative investments” discussion. These assets are not viable options for most organizations. Affiliated assets can include captive distribution systems or 100%-owned railroads, whereas unaffiliated assets are arms-length investments most often in publicly-traded securities and requiring less (or preventing any) operational involvement.
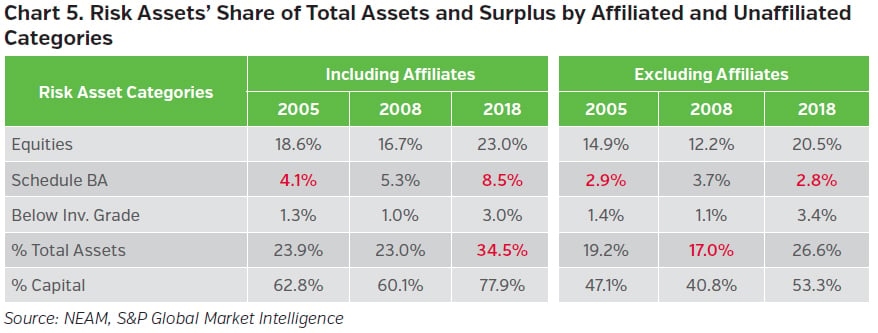
Risk assets (Schedule BA, equities and below investment grade fixed income securities) add another dimension to insurers’ investments. As shown in Chart 5 below, whether affiliated or not, in the aggregate, risk assets as a percent of total assets and surplus have grown from pre-crisis 2005 through 2018 to nearly 78% and over 50% of capital, respectively. And, risk assets are highly concentrated: Berkshire owns over 40% of the total; the top 10 largest owners including Berkshire own 70%; and, excluding Berkshire, the top 10 largest BA holders with 45% of total assets, own 55%.
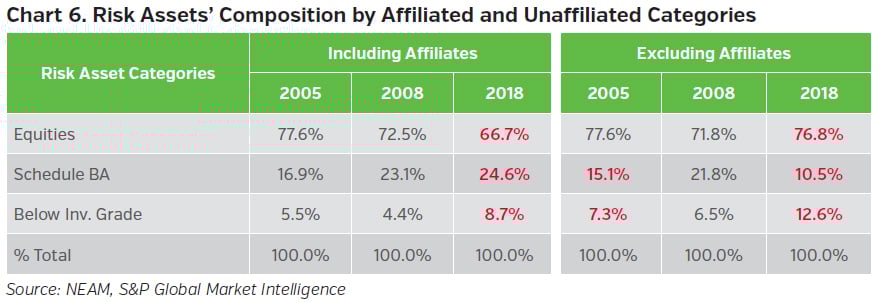
The distribution of risk assets among the three broad categories has changed, but the amount of change depends on the affiliated and unaffiliated status highlighted in Chart 6 below. Within the affiliated category, the reduction in equities “financed” Schedule BA assets and below investment grade holdings (note the impact of differences in marked-to-market treatment). However, excluding affiliated assets, equities held constant and there was merely a repositioning of Schedule BA and below investment grade holdings.
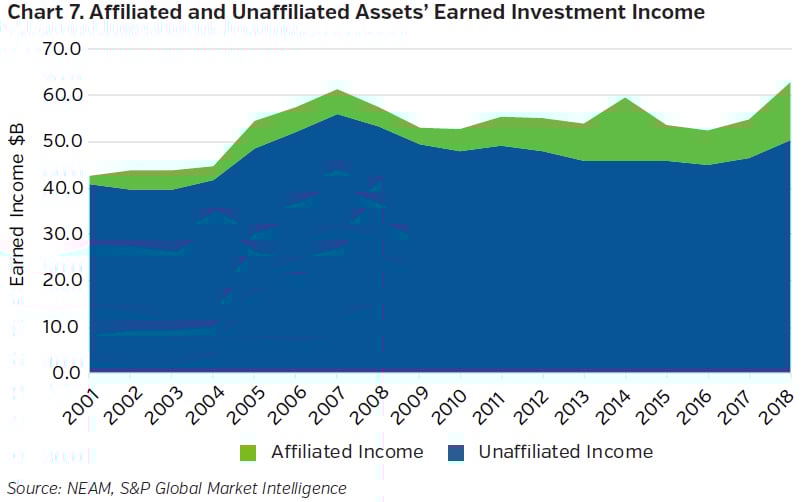
The growth of affiliated assets leads to its increased share of earned investment income, as shown in Chart 7 below. The share of income from affiliated assets is a key driver of recent earned income growth.
Trends in Core Fixed Income
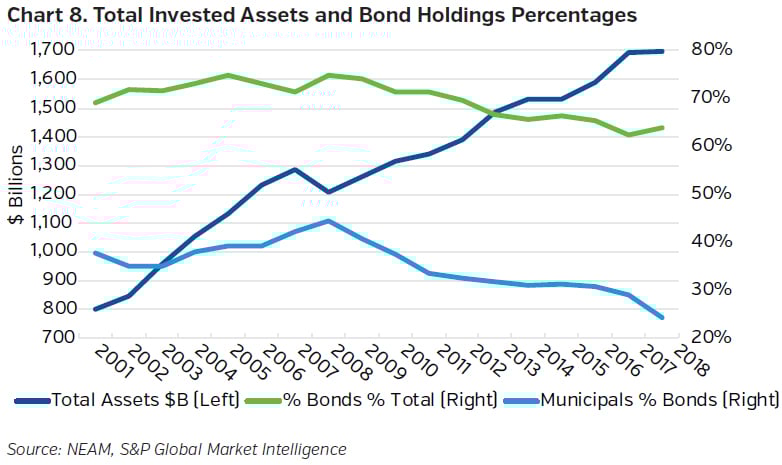
Across nearly all insurers’ portfolios, there has been a visible decrease in fixed income holdings. Total bond and exempt bond allocations peaked in 2008. The decline since then has been the most severe for exempts: in 2018 the allocation dropped over 4.5 percentage points to 28% of fixed income assets.
There are interesting cross currents in the municipal bond allocations. Prior to last year, just four companies accounted for 100% of the net decline, and one of these for very obvious reasons. In 2018, the decline was driven by the 2017 change in tax law impacting all municipal bond holders. Chart 8 highlights asset growth and the shrinking share of bonds and tax-exempt bonds, in particular from 2001 through 2018.
Municipal bonds historically have been favored heavily by those companies with superior underwriting results, as shown in Chart 9. These same companies further demonstrate their commitment to municipal securities by owning longer-dated bonds – taking advantage of the historically more dominant relative value for longer-dated municipal bonds.
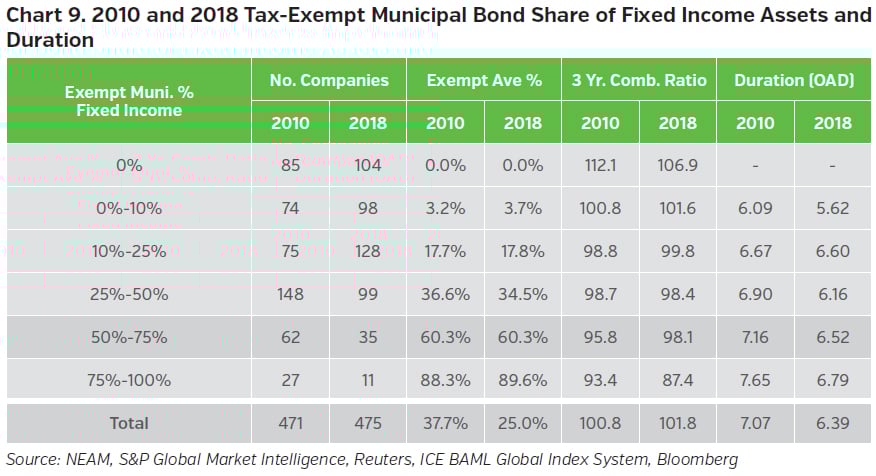
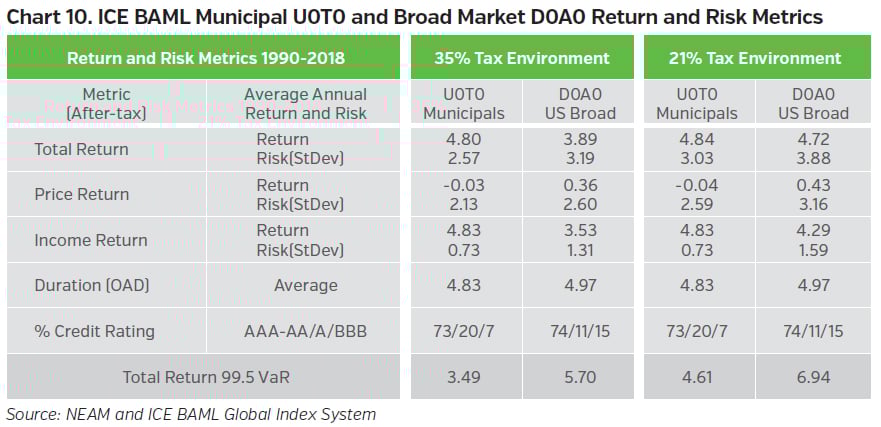
Chart 10 highlights the impact of recent tax law changes on municipal and taxable bonds of comparable credit quality and duration. While the changes have significantly lessened the after-tax return advantages of tax-exempt municipal bonds, their relative low volatility advantage actually increased in the lower tax rate environment. However, net-net, widespread municipal ownership – even among underwriting leaders – will be challenged by tax law economics and further aggravated if interest rates increase.
Fixed Income Sector Allocation
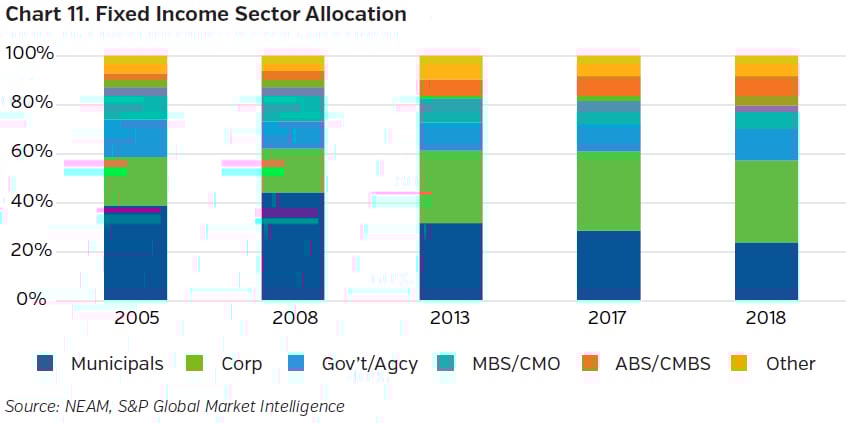
Within fixed income, the municipal allocation peaked in 2008. Corporates were the greatest “winner,” and structured securities combined (ABS/CMBS and MBS/CMO) were a wash (Chart 11).
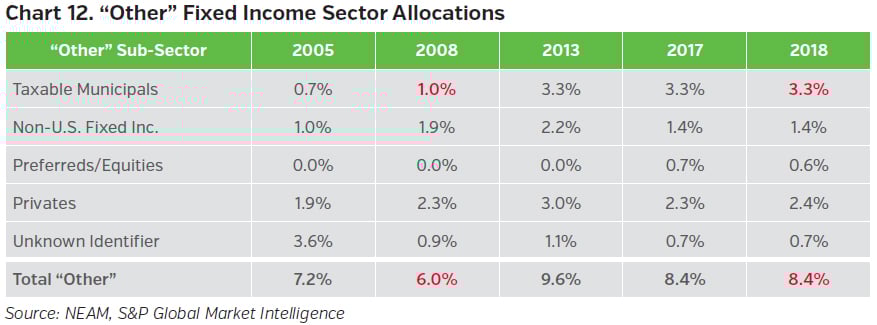
Taxable municipals gained (and have retained) fixed income share within the increasing “other” category, as shown in Chart 12. Their ownership is broad based. Holdings among the remaining categories ebb and flow and are less broadly owned.
Credit Quality
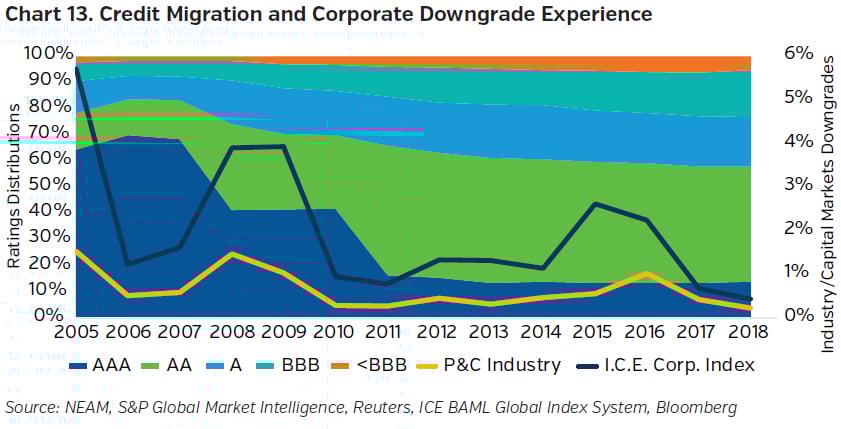
Credit quality peaked prior to the financial crisis, as shown in Chart 13. At that time, bonds rated BBB or less totaled 7.5%. By 2018, their share increased three-fold to 22.5%. Overall, industry downgrade experience of year-end holdings is better than the U.S. corporate credit universe, measured by the ICE BAML corporate bond indices’ constituents. Credit deterioration is due primarily to purchases, not downgrades. Industry downgrades remain low. There is wide variation among companies and credit quality drifts downward, reflecting what the market has to offer.
Option Adjusted Duration
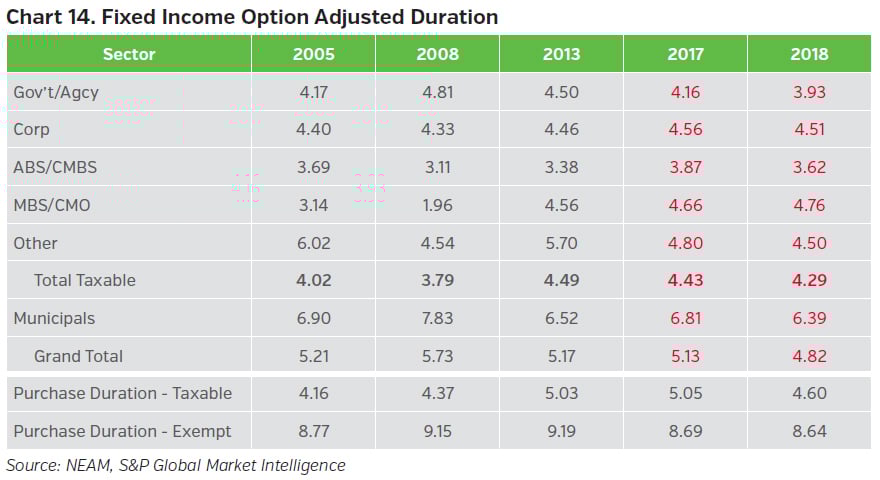
In 2018 option adjusted duration (OAD) declined in every broad sector except MBS/CMO, as shown in Chart 14. The reduction in the municipal bonds from their 2008 peak allocation and their duration level has accelerated the overall fixed income duration decline nearly 0.9 years. In 2008 tax-exempt duration was twice taxable duration; and, in 2018 it was only 50% greater. Except for 2005, purchase durations exceed embedded durations in each year.
Book Yields
Chart 15 shows the 2018 fixed income overall book yield of 3.43% was 131 bps lower than the 2005 ending yield of 4.74%. However, the overall 2018 book yield increased 17 bps from year-end 2017. At first blush, the year-over-year increase in ending yields seems cause for celebration, signaling a recovery of investment income. However, closer inspection of purchase yields suggests otherwise, in fact, a false positive.
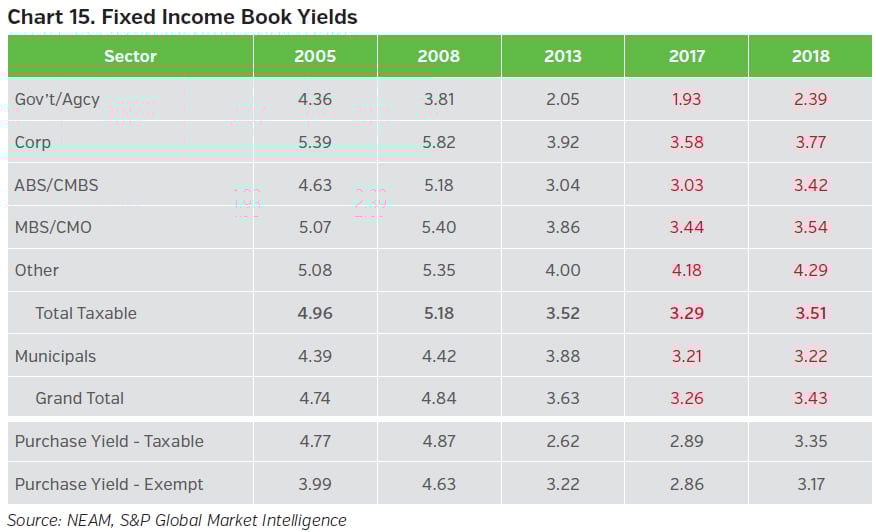
The purchase yields for both the taxable and exempt segments shown in Chart 15 have trailed the ending embedded book yields for all periods. And, whereas the 2018 taxable purchase yield exceeded the Gov’t/Agcy and ABS/CMBS ending 2017 book yield, it trailed the more dominant Corporate and MBS/CMO sectors and the “Other” bond category.
Similarly, exempt purchase yields, which increased 31 bps to 3.17%, failed to materially increase ending book yields. A combination of floating rate resets, paydowns, sales and maturities also affected the changing book yields from period to period for both taxable and tax-exempt securities, often offsetting a favorable impact of purchase yields. Only when purchase yields exceed beginning embedded book yields will there be possible cause to uncork the champagne.
Key Takeaways
- Reported underwriting results show year-over-year improvement. This is due largely to a reduction in ceded premiums and greatly diminished natural catastrophe losses leaving a net “so-so” result.
- Earned investment income increased, driven by strong operating cash flow and earnings sourced from affiliated assets, and investment types not readily available or manageable for many insurance organizations.
- Reported book yields increased uniformly across most fixed income sectors. However, purchase yields continue to lag the embedded book yields of several sectors that have large allocations. Sales, maturities and pay downs of lesser yielding securities will continue to lessen fixed income yield increases.
- Growth in “alternative” (Schedule BA) and risk assets is driven by affiliated assets. The
share of unaffiliated “alternative” assets has actually declined. - The historic decline in the municipal allocation was due to weakened underwriting results
of several large companies. The recent decline is driven by recent tax law changes
reducing the after-tax relative value of tax-exempt municipals. - Despite the past difficult underwriting environment and challenging capital markets,
there are market leaders in both arenas that have demonstrated an ability to
consistently outperform.
Endnotes
1 2018 insured U.S. catastrophe losses reported by Insurance Information Institute (I.I.I.) totaled $48 billion down from 2017 estimated loss of $102 billion, yet double the 10-year average excluding 2017 all-time high amount.
2 Industry underwriting market leaders need to have outperformed industry median results
for each of the following three key criteria in each of three most recent periods: three, five
and 20 years.
- Premium growth
- Combined ratio
- Combined ratio volatility
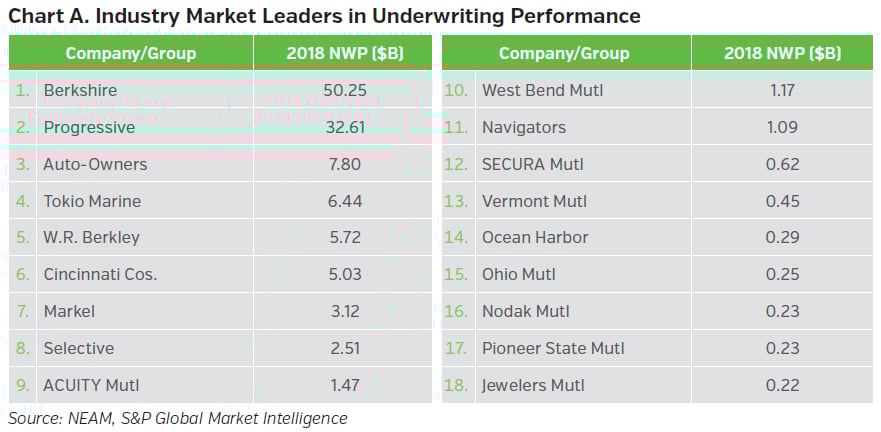
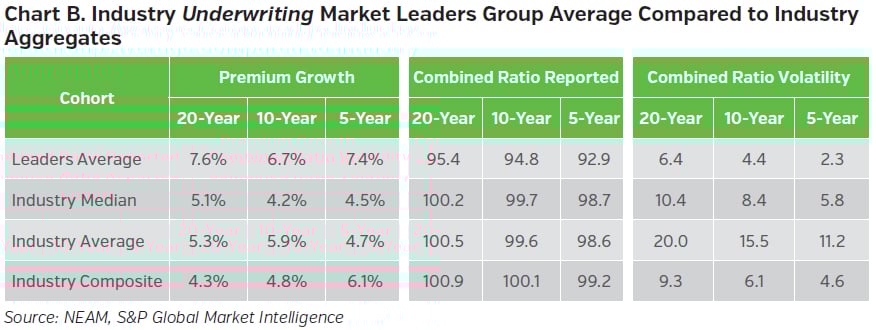
Industry underwriting market leaders are a mixture of large, publicly-traded and often global companies and small regional domestic mutuals. Chart B contrasts market leaders’ underwriting performance to industry outcomes. The results are impressive, displaying stark differences in all categories: premium growth; reported combined ratio; and, combined ratio volatility.
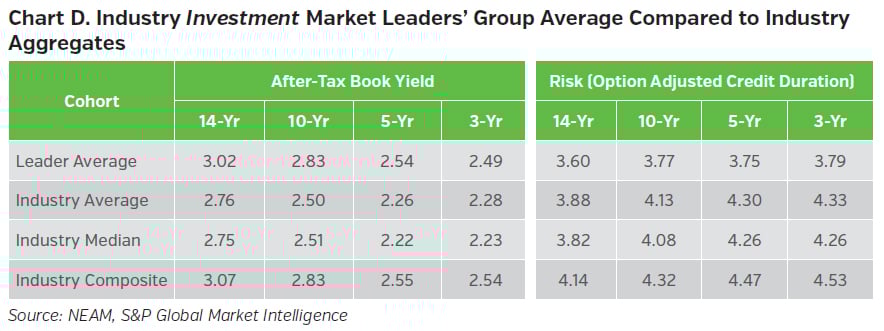
3 Industry investment market leaders were identified as companies having higher than median after-tax investment income and lower than median market risk (defined as option adjusted credit duration). The leadership board is shown in Chart C below.
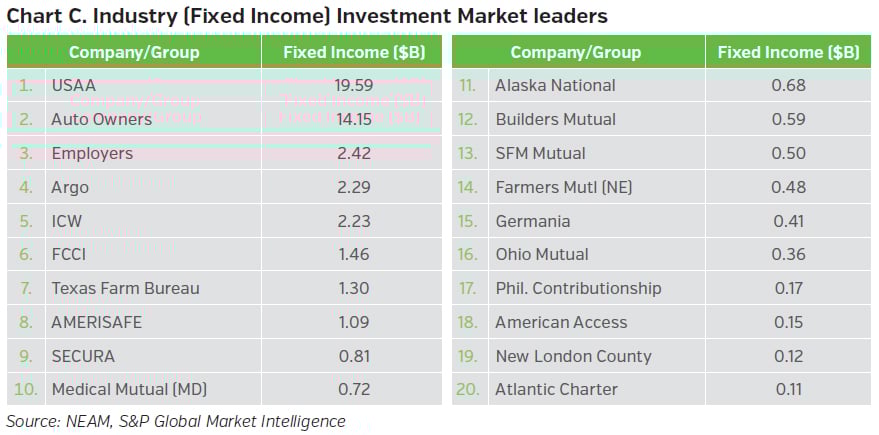
There are 20 companies exceeding the industry median company performance benchmark. The group is less diverse than the underwriting leaders’ group. The companies tend to be small to medium size with a nearly exclusive U.S. focus, mostly mutual and reciprocals with either a targeted customer demographic and/or specialty/monoline products. As shown in Chart D, they soundly outperform industry and average returns and all industry categories for risk metrics.