
In October 2017, AM Best released their new Best’s Capital Adequacy Ratio (BCAR) methodology that assesses the capital adequacy of the property/casualty and life/health insurers in North America.
This new BCAR framework evaluates an insurer’s capital adequacy at different confidence levels. It compares the insurer’s available capital against the required capital, utilizing Value-at-Risk (VaR) to evaluate the capital adequacy ratio at 95%, 99%, 99.5% and 99.6% confidence levels. Instead of using a single BCAR measure, AM Best will now look at the capital adequacy ratio at various confidence levels (or tail events).
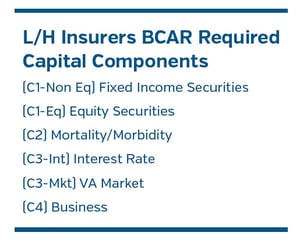
This new BCAR framework encompasses required capital risk components related to investment and underwriting. In this issue of Perspectives, we focus specifically on BCAR required capital related to investment risk; i.e. fixed income and equity securities, along with the potential impact on asset allocation for Life insurers.
For fixed income securities, the new BCAR model introduced additional dimensions of the capital charges. The baseline bond risk charges vary by letter credit rating and maturity. This additional granularity of the credit rating coincides with the currently proposed NAIC fixed income credit letter rating reporting requirement. However, the currently proposed NAIC RBC C1 (fixed income capital charges) factors do not vary risk charges by maturity. For equity securities, the new baseline BCAR capital factors range from 25% at 95% confidence levels to 44% at 99.6% confidence levels.
We will highlight the differences between the old and new BCAR fixed income and equity capital factors. We follow a similar approach as we had used to evaluate the proposed NAIC RBC C1 impact to life insurers’ portfolio optimization.1 The portfolio optimization case study in this issue utilizes U.S. life industry data to illustrate key differences between optimized portfolios under old and new BCAR investment capital factors.
Our analysis includes these key takeaways:
- The new BCAR, which varies C1 capital charges by letter credit rating and maturity, produces more restrictive efficient frontiers than the old BCAR.
- Portfolio optimization needs to evaluate the “risk-adjusted returns” of various asset classes along with their respective BCAR charges.
- The new BCAR would produce optimized portfolios with shorter duration and lower default loss than old BCAR; increased allocations to structured securities could be the result as this sector tends to have issues with high credit qualities and short durations.
BCAR Investment Capital Charges: Old versus New (VaR 95 and VaR 99.6)
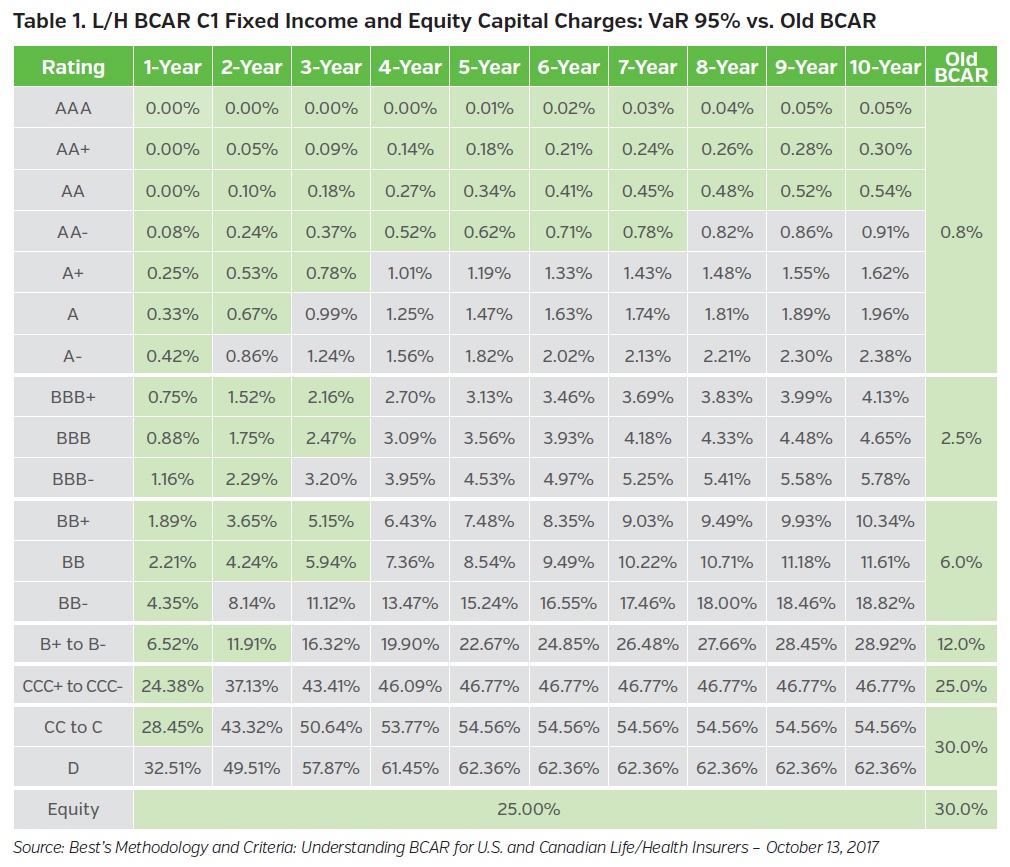
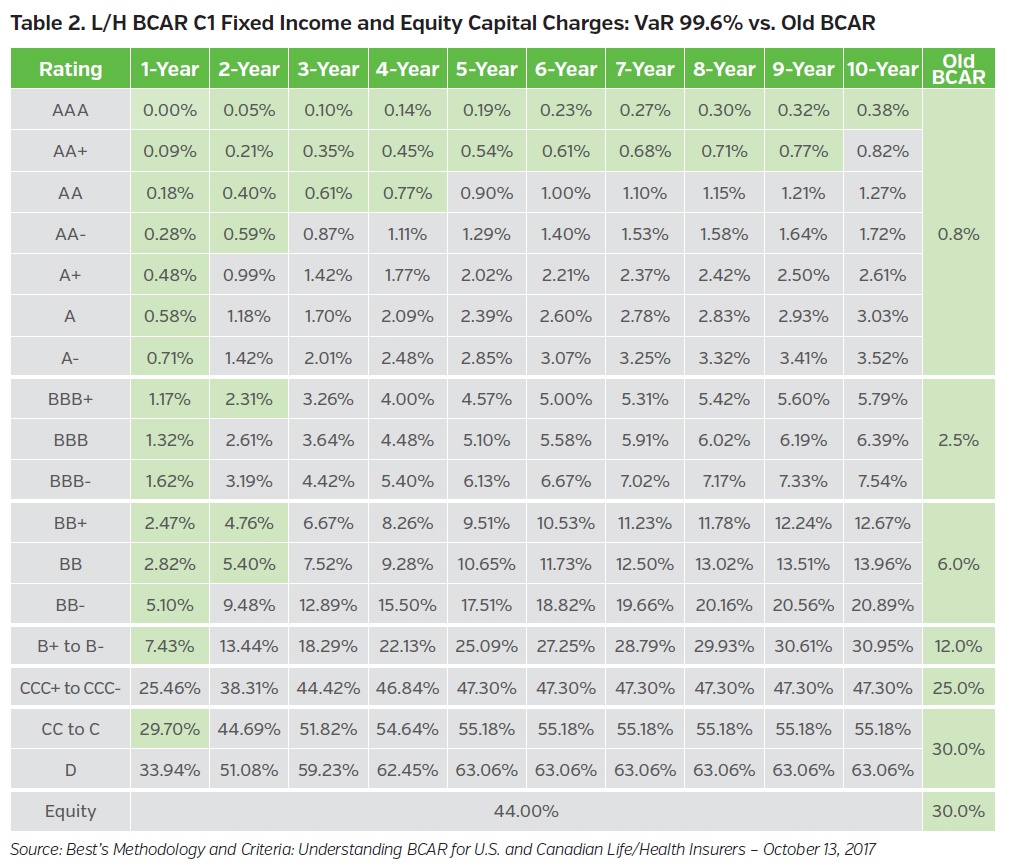
Table 1 and Table 2 show how the investment capital charges at the new BCAR – VaR 95% and VaR 99.6% levels (“new BCAR”) differ from the previous BCAR (“old BCAR”) charges. Highlighted cells (green) represent new risk charges that are lower than the old BCAR risk charges. Most new risk charges are higher than the old risk charges; i.e. 109 out of 171 factors under VaR 95% levels and 131 out of 171 factors under VaR 99.6% levels. Disregarding relative value considerations for the moment, at first glance, the levels of change in capital charges across rating and maturity categories might suggest potential benefits from replacing lower credit quality securities with higher credit quality (‘AAA’ or ‘AA’) securities. Later, we will show how optimization outcomes differ when constraining old BCAR versus new BCAR at VaR 95% and 99.6% levels.
Portfolio Optimization Case Study - Initialization
A portfolio optimization framework evaluates return and risk tradeoffs among different asset classes and identifies portfolio configurations that are optimal (or more efficient) in terms of selected return and risk metrics.
Under the NAIC statutory accounting framework, life insurers typically focus on enhancing book yield (income return) while targeting certain capital ratios or liquidity scores. The risk tolerance metrics used vary by company, depending on the enterprise’s objectives and stakeholders’ expectations. In this issue of Perspectives, our portfolio optimization is configured to maximize the book yield while maintaining initial dollar levels of BCAR investment capital charges. The goal of our optimization is to identify key directional differences between the optimized allocations, based on old BCAR versus new BCAR C1 Non-Equity charges at VaR 95% and 99.6% levels.
For this portfolio optimization review, we use U.S. life industry 2017 year-end reported statutory financials, investment holdings, and generic liability assumptions for an Enterprise Based Asset Allocation™ (EBAA™) process.2 The EBAA™ process starts with a breakdown of the return on equity (ROE) of a life insurance enterprise:
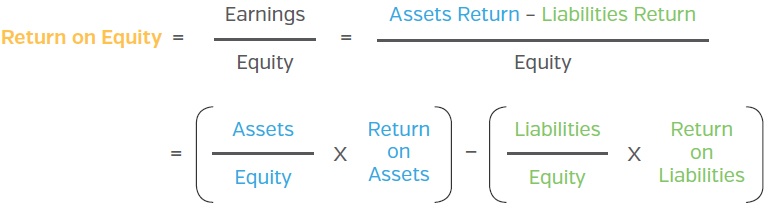
Table 3 highlights key components and contributions of ROE for the U.S. life industry. The investment and product leverage are based on 2017 year-end reported industry balance sheet financials. The return on assets reflects both the income return of fixed income securities and total return of equity-like assets in the investment portfolio outlined in Table 4 below. The return on liabilities assumes a representative life and annuity business mix, with appropriate return and volatility assumptions; the 4.1% represents the “cost” or “required rate of return” of liabilities.

Table 4 summarizes the asset classes that are included in the EBAA™ process. Given that the focus of our optimization review is to evaluate the impact of new BCAR C1 Non-Equity factors on the public fixed income portfolio allocation, allocations to short-term (2.8%), private placements (11.4%), commercial mortgage loans (12.5%), equity (1.3%), and alternative investments (5.3%) are maintained at current levels throughout the optimization process.

Portfolio Optimization Case Study – Results and Implications
With the initial life industry portfolio established, the EBAA™ optimization review takes place following these sequential steps:
- Optimize the portfolio to maximize the book yield (income return) while maintaining the initial BCAR investment C1 charges ($)
- Establish the optimal asset allocations under old and new BCAR C1 capital charges separately
- Evaluate the impact of duration constraints on the optimization results
- Identify key directional differences between the optimized allocations based on old and new BCAR C1 charges
Chart 1 compares three efficient frontiers, all maximizing the income return while maintaining the initial dollar level of BCAR C1 charges. The Current Portfolio represents the initial life industry portfolio (black dot) described above. The first efficient frontier (blue curve) uses old BCAR C1 factors, while the second (green curve) and third (yellow curve) use new BCAR C1 factors at VaR 95% and 99.6% levels respectively. New efficient frontiers (green and yellow) are more restrictive than the old (blue) efficient frontier. 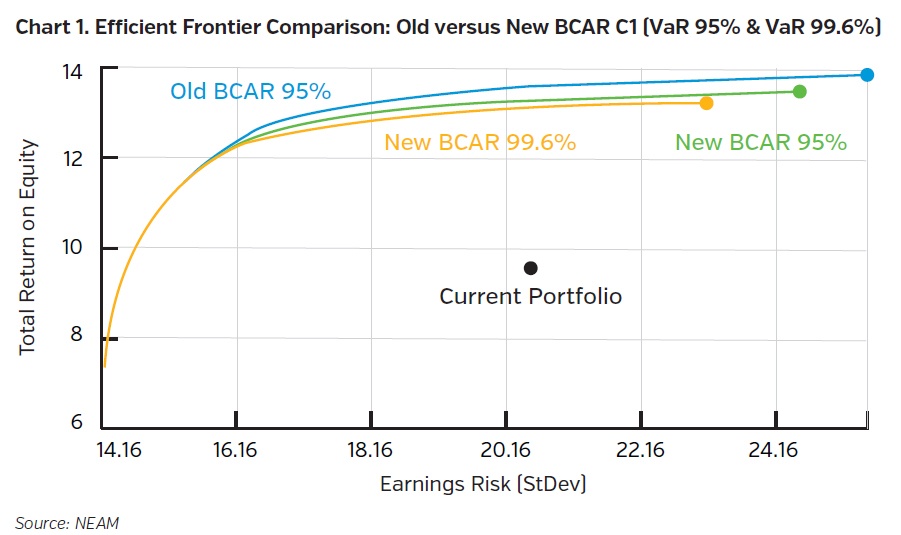
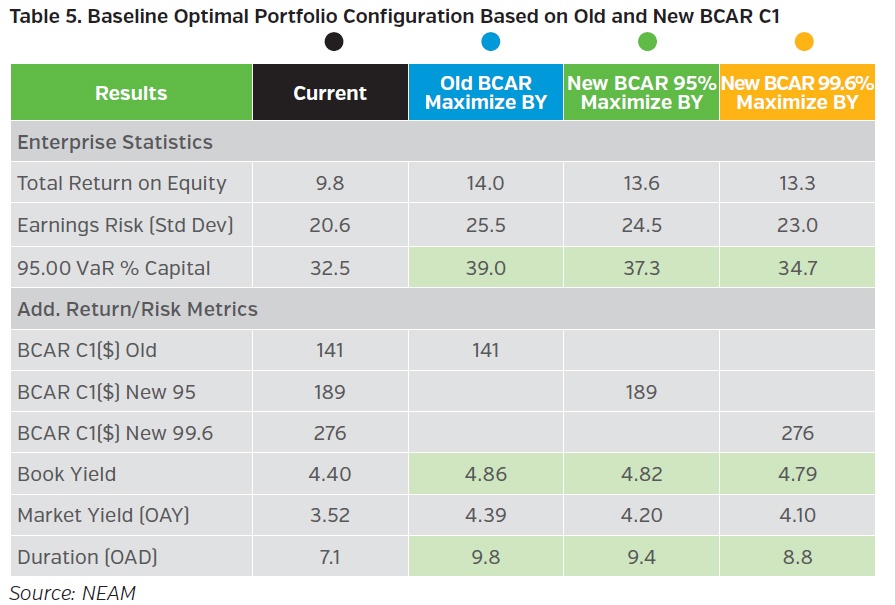
Table 5 provides key return and risk metrics of the current portfolio (black dot) and specific points (portfolios) from the three efficient frontiers in Chart 1 above. The blue dot represents the portfolio on the first efficient frontier with the maximum book yield (income return) at the initial dollar level of BCAR C1 charges (141). Similarly, the green dot and yellow dot represent the portfolios on the second and third efficient frontiers with the maximum book yield (income return) at the same initial dollar level of BCAR C1 charges (189 and 276, respectively) at the VaR 95% and 99.6% levels. The blue dot portfolio offers a slightly higher book yield (4.86%) compared to the green dot (book yield of 4.82%) and yellow dot (book yield of 4.79%) portfolios. Unlike the old BCAR, new BCAR C1 fixed income capital charges increase with maturity, which will result in optimized portfolios under new BCAR having shorter duration than optimized portfolios under the old BCAR. This is illustrated by the green and yellow dot portfolios showing shorter durations (9.4 years and 8.8 years, respectively) than the blue dot portfolio’s duration (9.8 years). Now let’s examine the credit quality and sector distributions of these three portfolios.
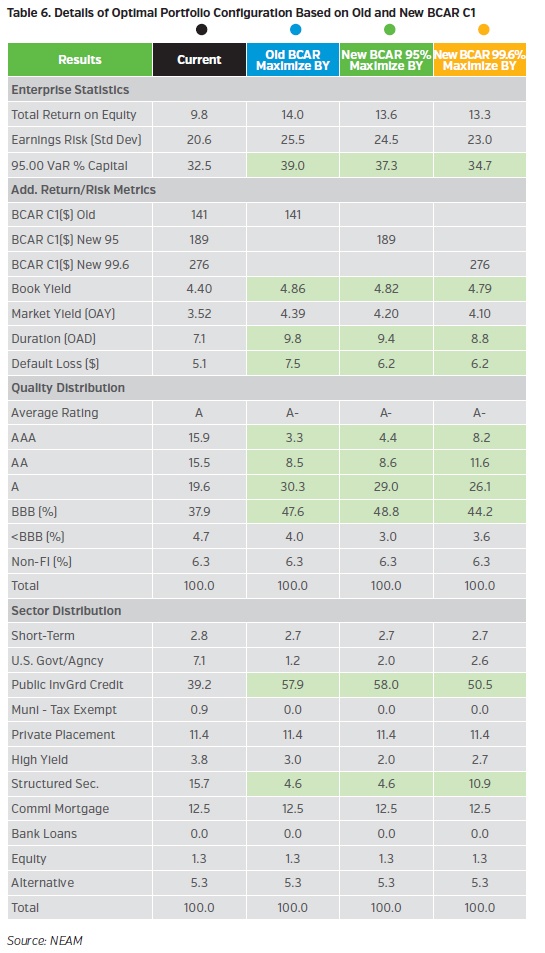
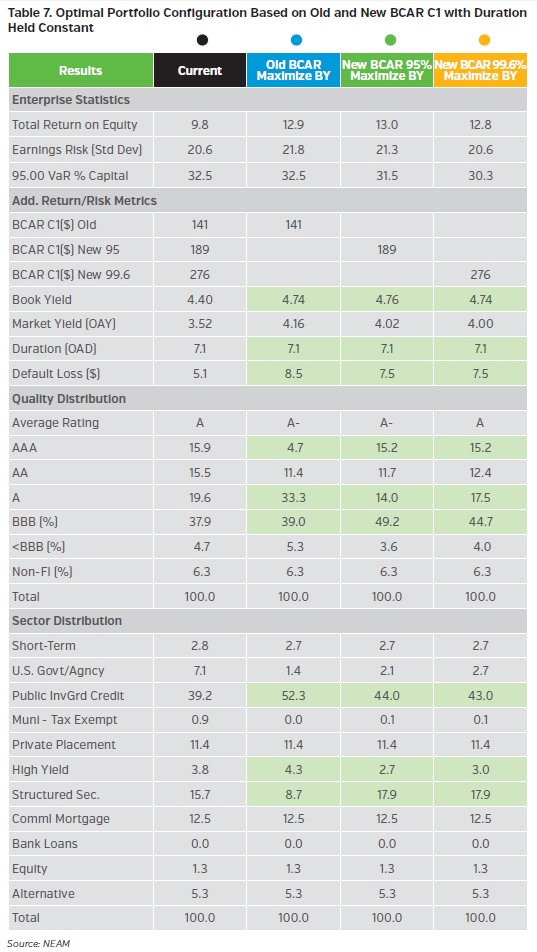
Table 6 shows the same portfolios as in Table 5 with additional credit rating and sector distribution details.
Optimized under old BCAR C1 charges, the blue dot portfolio’s enhanced risk-adjusted return is achieved through credit rotation or arbitrage (swapping ‘AAA’ and ‘AA’ with ‘A’, since ‘AAA’, ‘AA’ and ‘A’ have the same C1 capital charges under old BCAR) and duration extension (from 7.1 to 9.8 years). Unlike the old BCAR, new BCAR C1 fixed income capital charges vary by granular credit rating which will result in optimized portfolios under new BCAR having lower default loss than optimized portfolios under the old BCAR (6.2 vs. 7.5). All three portfolios have a similar average credit rating of A-.
Sector profile varies among the three portfolios: the blue dot portfolio has similar sector profile as the green dot portfolio but has higher investment grade corporate and lower structured securities allocations than the yellow dot portfolio. Next, we examine the impact of constraining duration.
Life insurers traditionally target their asset duration at certain levels based on their liability profile. Here, we impose duration constraints on the optimizations developed earlier. With the duration constrained at the initial level (7.1 years), these three efficient frontiers appear to overlap with each other and the optimized portfolios have similar book yields (4.74% vs. 4.76% vs. 4.74%).
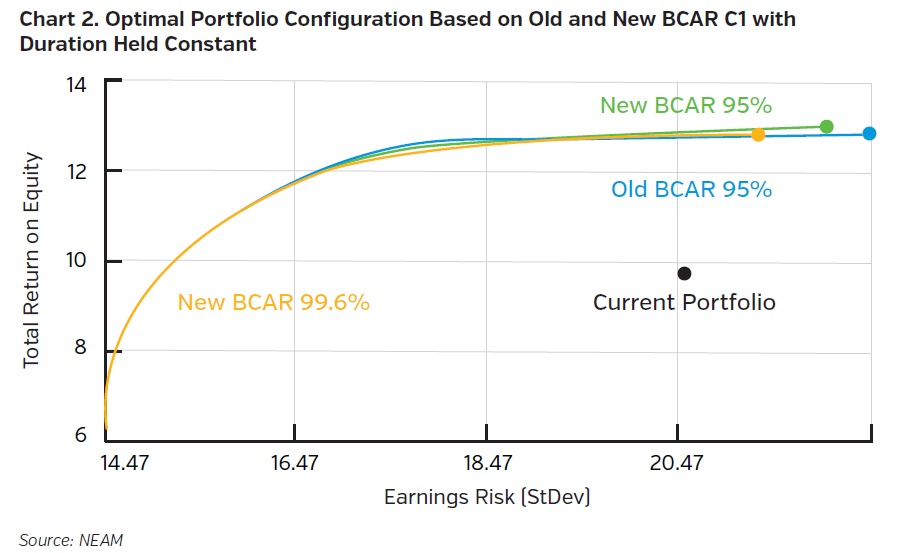
The portfolios in Table 7 correspond to those in Table 6, but are constrained by the initial duration of 7.1 years. As expected, the additional duration constraint reduces the maximum achievable book yield from 4.86% to 4.74% under old BCAR (blue dot) and 4.82% to 4.76% (green dot) and 4.79% to 4.74% (yellow dot) under new BCAR.
The duration constraint alters the optimal asset allocation. Optimized portfolios under new BCAR show lower default losses than old BCAR (7.5 vs 8.5). Among ‘AAA’, ‘AA’ and ‘A’ rating categories (current NAIC 1 category), optimized portfolios under new BCAR (green and yellow dots) favor ‘AAA’ over ‘A’ relative to the optimized portfolio under old BCAR (blue dot). The ‘BBB’ allocation (current NAIC 2 category) is actually increased under new BCAR optimizations. This credit rotation is contrary to the initial conclusion that might be reached based on Tables 1 and 2, which suggested that lower-rated fixed income securities (‘BBB’ or ‘BB’) might be replaced by higher credit quality (‘AAA’ or ‘AA’) fixed income securities. Thus, the relative risk-adjusted return is also important, not just the changes in relative capital charges. From an asset sector perspective, structured securities may be favored over investment grade corporate and high yield bonds under the new BCAR framework.
Concluding Remarks
AM Best implemented a new BCAR framework to assess an insurers’ capital adequacy at 95%, 99%, 99.5% and 99.6% confidence levels. For fixed income securities, new BCAR risk charges (C1 Non-Equity) vary by not just the letter credit rating category but also the maturity bucket. This issue of Perspectives evaluates the new BCAR investment risk charges and their potential impact on asset allocation for life insurers.
The new BCAR C1 factors are likely to influence life insurers to reconfigure their investment portfolios. The new BCAR model produces optimized portfolios with shorter duration and lower default loss than under the old BCAR. Under the new BCAR framework, VaR 99.6% factors result in an optimized portfolio with a lower default loss than VaR 95% factors.
When duration is constrained, the new and old BCAR produce similar efficient frontiers. However, the new BCAR produces optimized portfolios with shorter duration and lower default loss than old BCAR; fixed income sectors such as structured securities would be favored under the new BCAR as this sector tends to have issues with high credit quality and short durations.
We welcome your feedback and comments. Please contact us if you would like to know more about the implications that the new BCAR C1 charges will have for the life insurance industry and, more specifically, to your business.
Endnotes
1 Refer to NEAM’s April 2017 Perspectives – Proposed NAIC RBC C1 Factors for Life Insurers:
Impact on Portfolio Optimization?
2 Refer to NEAM’s June 2016 Perspectives – Life Insurer Asset Optimization: A Top-Down
Enterprise Approach


