



Executive Summary
In 2025, the U.S. life insurance industry’s net investment income continued to rise, though at a slower pace, extending the upward trend since 2023. Supported by elevated interest rates, book yield increased to 4.85%, its highest level in a decade, from a recent low of 3.78% in 2021.
Asset allocations remained broadly stable, with bonds, mortgage loans, and Schedule BA assets continuing to dominate insurer portfolios. Over time, bond allocations gradually declined, offset by increasing allocations to mortgage loans and Schedule BA assets. Bonds and mortgage loans together accounted for 77% of total investment income, underscoring their central role in industry portfolios.
Fixed income portfolios benefited from higher yields while credit quality continued to improve. Portfolio duration extended modestly in 2025, driven by shifts in sector allocation. Within fixed income, corporate bond allocations continued to decline, while private placements and asset-backed securities (ABS) reached record levels.
Net Investment Income (NII) Continued to Climb, Though Growth Moderated
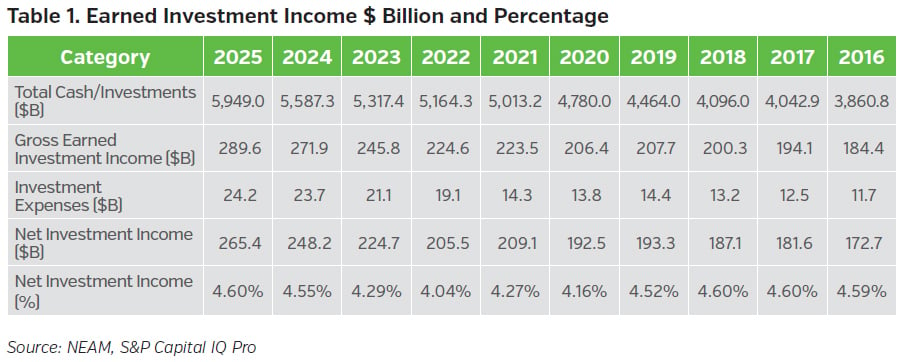
Total cash and invested assets increased 6% to $5.95 trillion in 2025, while net investment income (NII) rose to 4.60%, its highest level since 2018 (Table 1) and broadly in line with levels observed from 2016 through 2018. Benefiting from elevated interest rates, NII increased from 4.04% in 2022, although the pace of growth moderated.
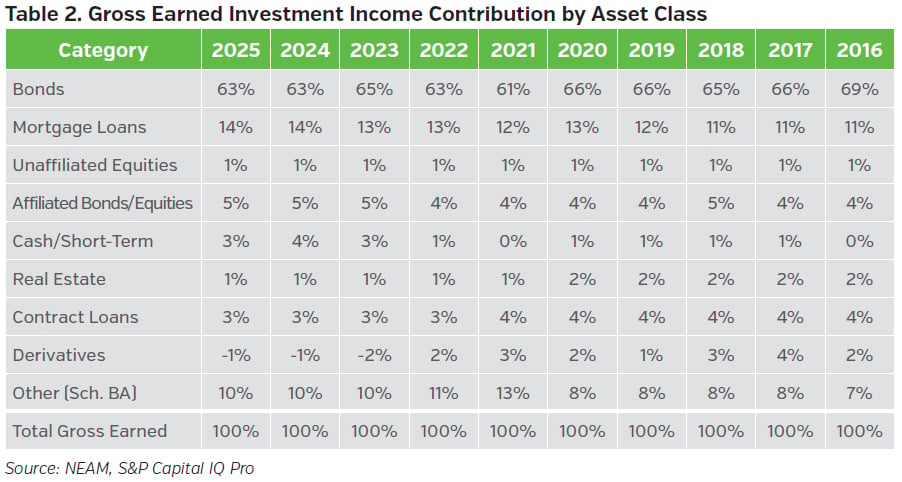
Investment income remains highly concentrated in fixed income assets. Bonds and mortgage loans accounted for 77% of total investment income, underscoring their central role in life insurer portfolios. Schedule BA assets were the third-largest contributor at 10%. In contrast, unaffiliated equities contributed just 1%, while cash and short-term investments accounted for 3%, up from near zero a decade ago (Table 2).
Broad Sector Allocations Held Steady, with Growth in Schedule BA Assets
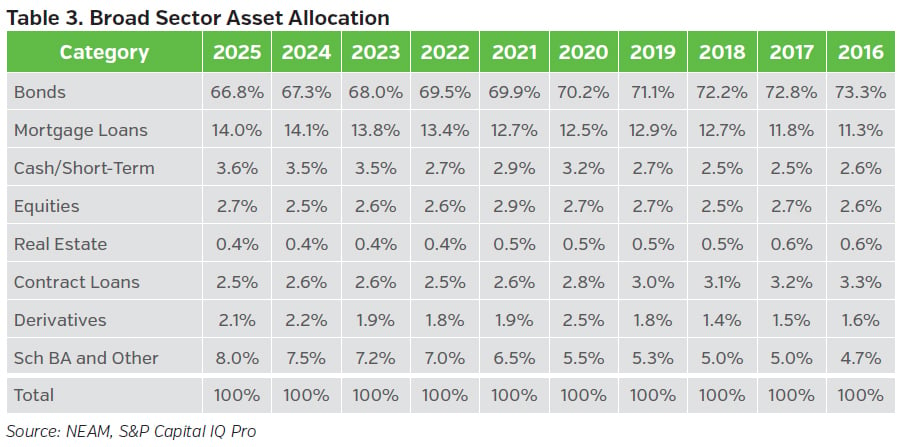
In 2025, the U.S. life insurance industry’s statutory asset allocation across broad sectors remained largely stable, continuing trends observed over the past decade (Table 3). Bonds remained the dominant asset class, although their share of total assets continued to decline gradually. Mortgage loans, the second-largest sector, accounted for 14.0% of total assets. Schedule BA allocations increased in 2025, with growth concentrated primarily among larger insurers. Meanwhile, cash and short-term investments remained at their highest level during the past decade, reflecting elevated short-term interest rates.
Fixed Income Allocations Continued to Shift Toward Private Placements and Asset-Backed Securities
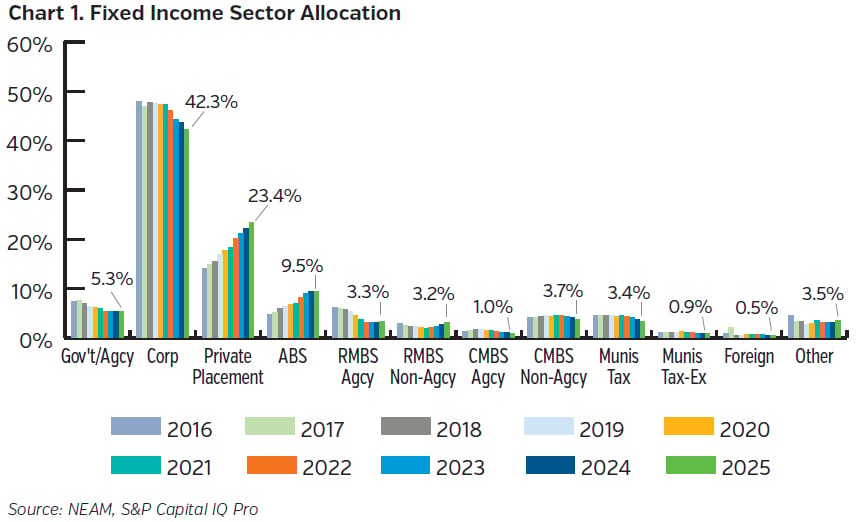
Chart 1 illustrates long-term trends in fixed income allocations over the past decade. Corporate bonds and private placements together represent approximately two-thirds of total fixed income investments. In 2025, corporate bond allocations continued to decline, while private placements continued to gain share. Private placement figures exclude publicly traded Rule 144A securities.
Within structured securities, including asset-backed securities (ABS), residential mortgage-backed securities (RMBS), and commercial mortgage-backed securities (CMBS), ABS allocations have increased steadily over the past decade and now represent the largest subsector. Non-agency RMBS allocations have also expanded over the past five years, while CMBS allocations have gradually declined.
Allocations to taxable municipal bonds increased from less than 1% prior to the 2008 financial crisis (not shown) to a peak of 4.6% in 2017, driven largely by the introduction of Build America Bonds under the American Recovery and Reinvestment Act of 2009. Following several years of relative stability, allocations have declined over the past four years, primarily reflecting reduced issuance in the taxable municipal bond market.
Book Yield Continued to Climb and Reached a Decade High
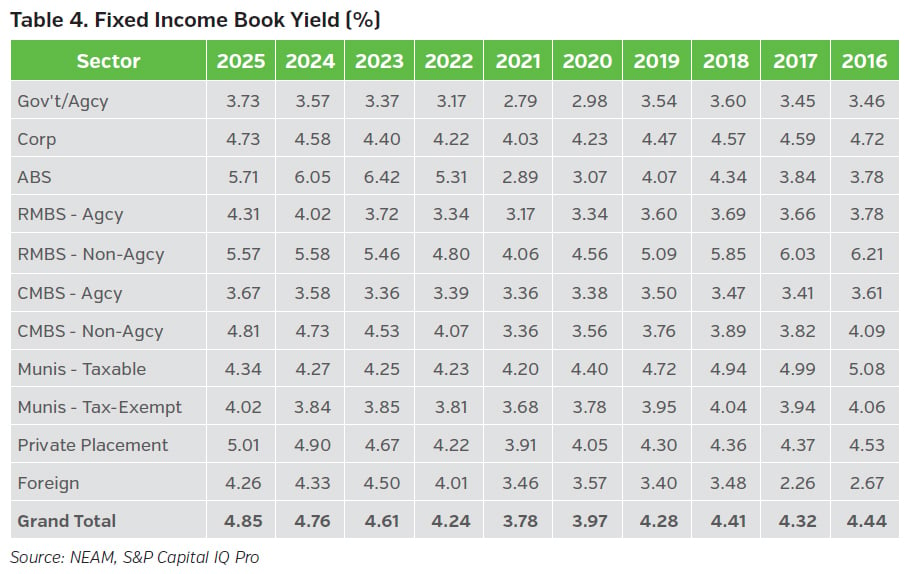
The industry’s book yield increased 9 bps to 4.85% in 2025, reaching its highest level in a decade (Table 4). Supported by elevated interest rates, the increase marked the fourth consecutive year of improvement following a recent low of 3.78% in 2021. Book yields rose across most fixed income sectors, with ABS, non-agency RMBS, and private placements each exceeding 5.0% (Table 4).
Duration Extended Modestly, Driven by Shifts in Sector Allocation
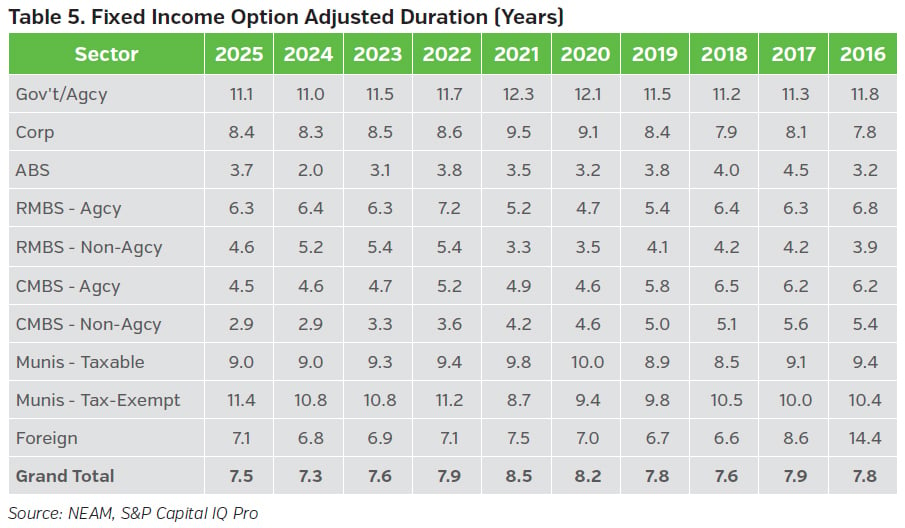
Table 5 presents option adjusted duration (OAD) by fixed income sector, based on CUSIP-level holdings from Schedule D statutory filings. The dataset excludes bonds held at the holding company level, derivatives, and private placements. From 2016 through 2021, the industry gradually extended portfolio duration in pursuit of higher yields, with the trend accelerating in 2020 and 2021 amid accommodative monetary policy and a broader shift toward longer-duration bonds.
Beginning in 2022, aggregate duration declined as rising interest rates and a market-wide shift toward shorter-duration assets reduced portfolio duration. This trend continued through 2024, driven in part by lower allocations to long-duration corporate and municipal bonds and increased exposure to shorter-duration asset-backed securities (ABS). In 2025, aggregate duration extended modestly, driven primarily by an extension of ABS duration from 2.0 to 3.7 years, partially reversing the shortening trend observed since 2022.
Credit Quality Continued to Improve
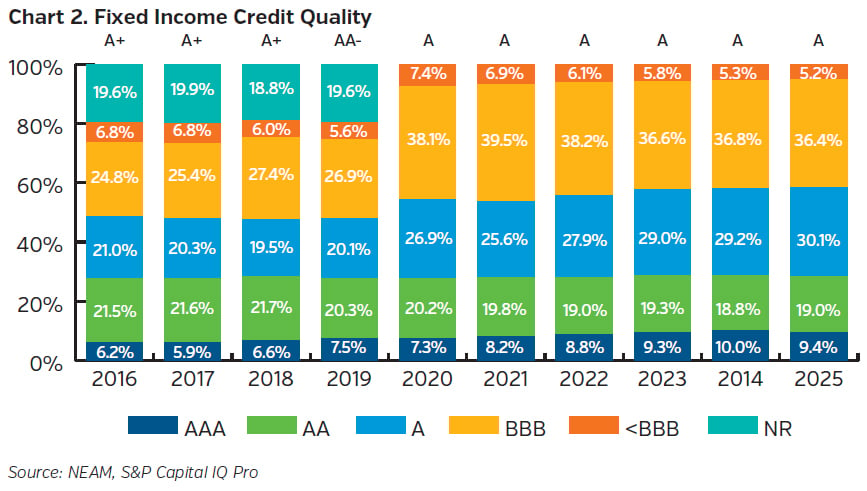
Prior to 2022, the prolonged low-interest-rate environment led the industry to take on additional credit risk, reflected in rising allocations to BBB-rated securities, which peaked in 2021 (Chart 2). Beginning in 2022, as the Federal Reserve embarked on an aggressive tightening cycle, insurers were able to secure higher yields while improving portfolio quality. As a result, allocations to AAA- and A-rated securities increased, while exposure to BBB and below investment-grade (<BBB) securities declined.
In 2020, the National Association of Insurance Commissioners (NAIC) expanded its credit rating framework from six to 20 categories. The non-rated (NR) category shown for 2019 and earlier years primarily represents “true” private placement securities (Chart 1). Historical statutory filings indicate that approximately half of these holdings were rated BBB. This reclassification helps explain the 11 percentage point increase in BBB allocations observed between 2019 and 2020 (Chart 2).
Yields Rose and Durations Extended Across Credit Ratings
Chart 3 illustrates book yields for public fixed income securities by credit rating. Since 2022, yields have risen consistently across investment-grade categories. Notably, AAA/AA-rated securities and below investment-grade (<BBB) securities experienced increases of 129 bps and 136 bps, respectively, over the past four years. The recent decline in book yields within the <BBB category, following several years of increases, primarily reflects shifts in subsector composition, particularly within <BBB corporate bonds.
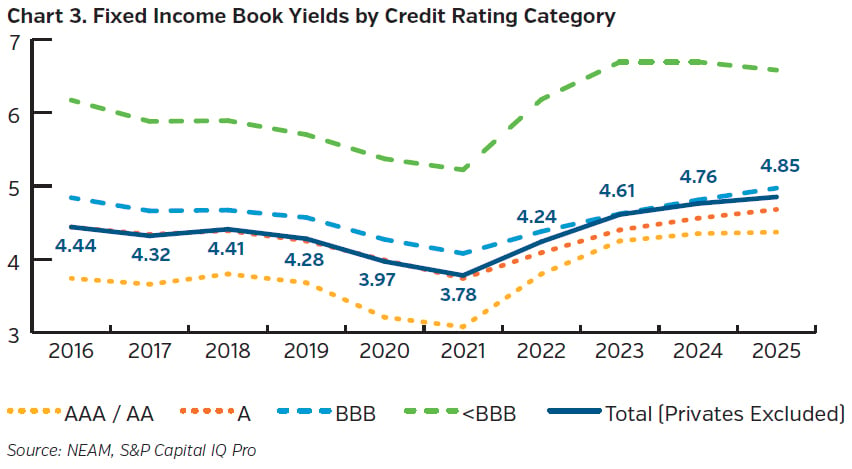
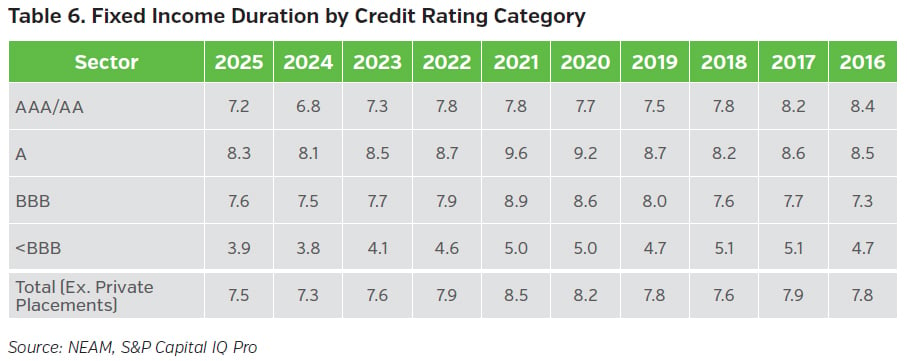
Table 6 presents option adjusted duration (OAD) for public fixed income securities by credit rating. As expected, below investment-grade (<BBB) bonds generally exhibit shorter durations than investment-grade bonds. In 2025, durations extended across all rating categories, reflecting a broader shift in portfolio positioning. Private placement securities, which comprised 22.2% of total fixed income holdings in 2024 (Chart 1), were excluded from the duration calculations.
Key Takeaways
• Net investment income continued to rise in 2025, supported by elevated interest rates, though growth moderated. Bonds and mortgage loans remained the primary drivers of investment income.
• Broad asset allocations remained largely stable, with bonds, mortgage loans, and Schedule BA assets representing the largest sectors. Over time, bond allocations declined, while mortgage loans and Schedule BA assets gained share.
• Fixed income allocations continued to shift, with private placements and asset-backed securities increasing, while corporate bond allocations continued to decline.
• Book yields continued to rise, reaching a decade high in 2025, while credit quality improved and portfolio duration extended modestly.
We provide tailored analyses comparing your company’s enterprise profile to industry peers, helping inform decisions related to risk appetite, capital management, and investment strategy.
Endnote
1 For purposes of this publication, the U.S. life industry consists of companies with invested assets greater than $50 million and surplus greater than $10 million as of year-end 2025. Fraternal companies are included beginning with 2019 data.