
The first quarter of 2018 unfolded with an eventful cadence. Equity price gains accelerated in January as robust earnings revisions and a sharp increase in inflows from retail buyers propelled the market higher. As a result of this momentum, the S&P 500 had posted a gain of over 5% by the end of the month.
In February, the market encountered headwinds centered on inflation fears. Those fears were stoked by a very strong January jobs report and strong average hourly earnings print, which served to push rates higher as the 10-Year U.S. Treasury note lurched toward 3%. Predictably, volatility also spiked in February, with the CBOE SPX Volatility Index (“VIX”) cresting at an exaggerated level of 50, close to a five-fold increase from early January levels! This was intensified by the breakdown in certain volatility themed strategies, particularly those betting on continued low volatility and market tranquility. The unwinding of these trades created intense selling by these strategies to manage exposures which, in turn, had a destabilizing impact on the overall market.
While the equity market bounced off of its February low, protectionist trade policy chatter pressured the market in the latter half of the quarter. Intuitively, protectionism would impede economic growth and hurt corporate profits. These measures could also breed inflationary pressures and hinder risk asset performance. As the decibel level around protectionism grew louder, volatility resumed. The market struggled to find sector leadership as technology, a key pillar to market gains during the last several years, contended with potential regulatory oversight. The “Ides of March” proved a challenge as the market could not regain its momentum and fell an additional 2% for the month. When the dust settled, the market was down a scant 1% for the quarter, but with more back and forth than a Centre Court Wimbledon rally, it certainly felt like a lot more.
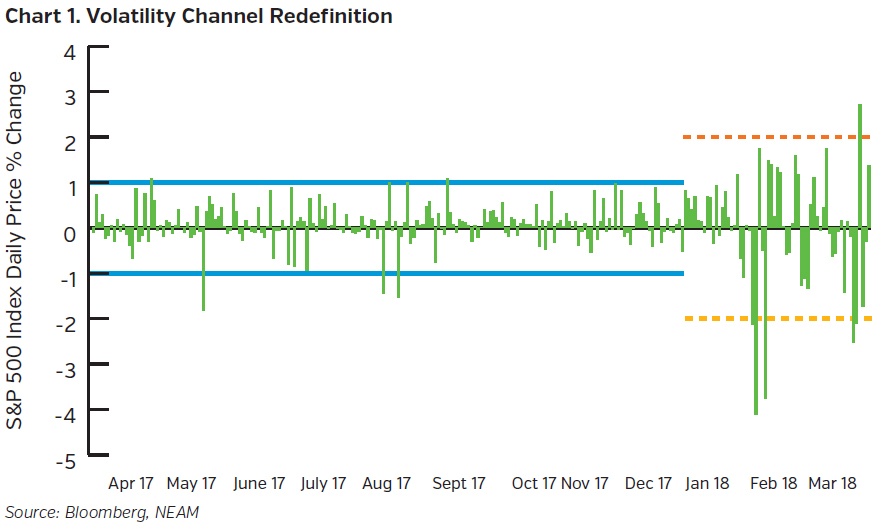
As this tumultuous quarter affirms, the volatility channel of the market is redefining itself (Chart 1). As the diagram illustrates, the S&P 500 gained or lost more than 1% no less than 23 times this quarter – almost 40% of the time – a sharp contrast to the placidity of last year. While volatility had become increasingly asymmetric during 2017, its return was inevitable. This harkens back to simple human nature which is subject to recency bias, a term used in behavioral finance describing when people use recent experience as the baseline for what will happen in the future. In this case, “recent” encompasses almost a decade dating back to 2008 when accommodative central bank policy and zero interest-rates first tamed, then suppressed, market volatility. While its persistently low level makes the current redefinition process feel quite uncomfortable, volatility is not uncommon in the context of an extended market and economic cycle.
Flattening of the Yield Curve
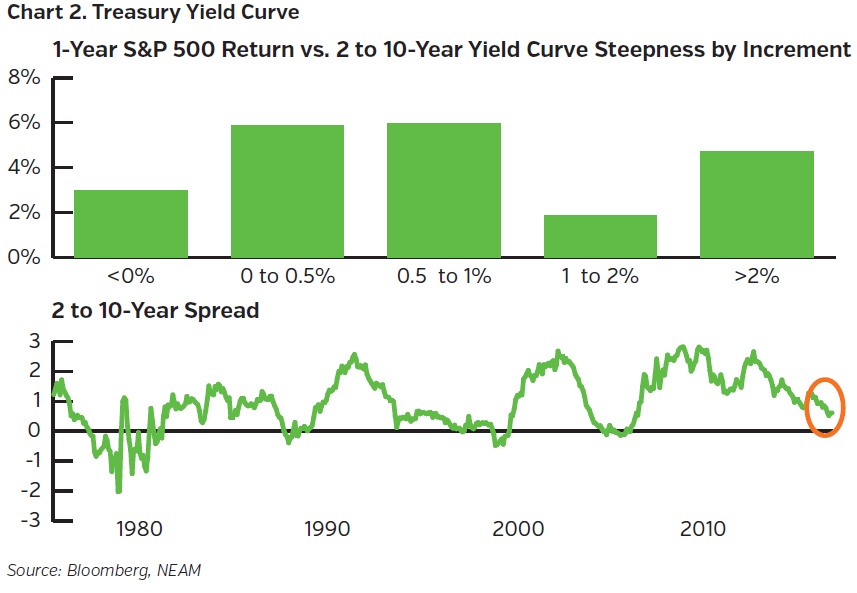
The yield curve continues to flatten, albeit not linearly. This too may be injecting some volatility into the equity markets. The rationale is two-fold: the shape of the yield curve is a reflection of economic growth and inflation expectations as well as an important determinant to prospective equity returns (Chart 2). As the gap between short and long-term Treasury rates narrows, it potentially signals slower economic growth which could weigh on corporate profits. Periods transpiring below zero hurt equity performance.
Since the spread between the 2 and 10-year maturity has fallen to less than half of a percentage point, speculation has surfaced about the timing of a possible yield curve inversion. We believe this chatter is premature, as the U.S. economy and the global economy are on solid footing and likely will be for the balance of 2018 and into 2019. Hence, a yield curve inversion seems still some time away but investors, nonetheless, are preoccupied with the resent resumption of curve flattening, given the historic reliability of this economic indicator.
Tightening of Credit Conditions
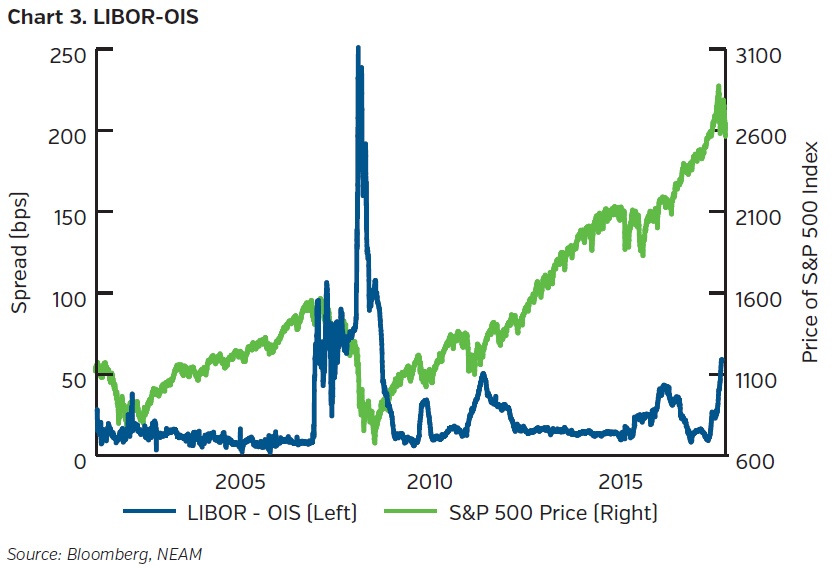
The potential for tighter credit conditions instilled additional market volatility as short-term borrowing costs in the U.S. have risen to levels not seen since the Financial Crisis. This is exemplified by the spread between the London Interbank Offer Rate (“LIBOR”), the average interest rate banks charge one another for short-term, unsecured loans, and its spread to the Overnight Index Swap rate (“OIS”), a proxy for central bank policy and the Fed Funds rate (Chart 3). This spread holds significance as a key gauge of credit risk within the banking sector and any potential systemic strain.
This measure almost doubled in 4Q 2017 and has near doubled again in 1Q 2018, potentially signaling a worrisome trend toward tighter credit conditions. To wit, Cornerstone Macro estimates that the rise since mid-November is equivalent to two hikes by the Federal Reserve.1 If the level holds, it will become a heightened concern, and the equity market has fittingly struggled with this ambiguity. In our view, the increase is technical in nature due to tax reform, repatriation flows and increased Treasury issuance. This spike should prove transitory and therefore not impede economic momentum nor become a more permanent source of market volatility.
Tariffs and Technology
Protectionist trade policy has rocked markets and understandably infused volatility. First, tariffs tend to act as a tax on domestic consumers and could be inflationary. Second, tariffs can impede longer run productivity. Illustratively, The National Bureau of Economic Research (“NBER”) estimates that trade accounted for close to 20% of the apparent increase in productivity for the U.S. economy over the 1995-2006 period.2 Tariffs could also lead to retaliation and potentially escalate into a global trade war. Collectively, these factors could negatively impact future GDP growth and the resulting level of corporate earnings capitalized into stock prices. While the initial scope encompassing steel and aluminum has been estimated as modest, the range expanded to include tariffs on China which raises the risk of counter measures. The threat of a trade war remains an overhang on the market.
Technology derives a large portion of revenue from international markets, and China is a key portion of its supply chain. This sector, therefore, would acutely feel the impact of any tariffs or a broader trade war with China. The market reacted with downward price volatility for this sector which later amplified itself due to potential regulatory changes for powerful companies such as Facebook following its misuse and/or poor stewardship of user data. According to data compiled by Bank of America Merrill Lynch, nearly 30% of the S&P 500’s decline in March was due to the downward momentum in the FAANG cohort, namely Facebook, Amazon, Apple, Netflix and Google. This selling pressure amounted to over 60% of the technology sector’s decline for the month.3 As such, this highly valued cohort is wielding a forceful influence on market volatility.
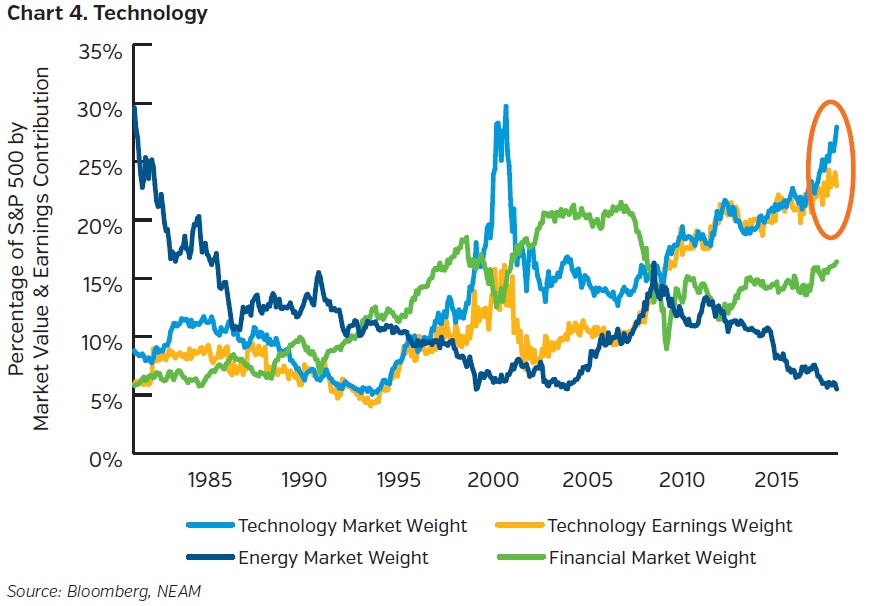
On a sector basis, technology comprises close to a quarter of the S&P 500 index by market weight, a level which historically suggests an approaching ceiling (Chart 4). Energy is the only other sector which has ever paralleled this status, and it proved fleeting. Financials, a contender in the mid-90s, peaked at a substantial but lower altitude which preceded a very rapid downward adjustment during the Financial Crisis. Technology once before achieved its current index weight but could not substantiate this position given the gap between price and underlying earnings.
The earnings contribution from technology during the first tech boom reached roughly half of its market weight. By comparison, technology’s earnings contribution today is roughly comparable to its present index weight. This would argue for potentially greater sustainability along with the leadership role technology comparatively now plays in the broader U.S. economy. With historical precedent challenging, this debate holds central importance as the market searches for leadership as the technology sector contends with the impact of potential tariffs and regulatory oversight.
CONCLUSION
Spikes in volatility can serve as a healthy reminder of the inherent risks in equity investing and diminish the complacency which became commonplace with the high single digit VIX levels that prevailed in the second half of last year. In our view, volatility is a necessary and structural component for the market’s long-term health. Its return is long-awaited but unsettling nonetheless. Intellectually, it is difficult to juxtapose the “Goldilocks” backdrop, characterized by moderate and stable economic growth with low inflation, with this heady volatility. Emotionally, the recalibration is intensified due to human nature and recency bias. Collectively, the mind and heart ponder whether it is a shot across the bow in a market topping process or a necessary and methodical cleansing enabling equities to regain momentum. All the while, fundamentals remain strong with earnings growth pacing double digits, enhanced by tax reform.
The calendar has only advanced one quarter beyond a year we recently described as notable for its absences: the absence of inflation, the absence of normalized interest rates, the absence of volatility and the absence of typical market drawdowns (see 4Q2017 Equity Review “A Record Year”). Yet, it already feels profoundly different as the first ninety days commandingly reversed these trends as the yield curve, credit conditions and trade challenged the abnormally low volatility seen in 2017. The messaging from the credit markets now hints at fragility and suggests a more cautious feedback loop for the equity market. Likewise, protectionist trade policy adds further market uncertainty. Consequently, the volatility band redefined itself in level and frequency, which may potentially diminish investor sentiment and risk tolerance should the turbulence be sustained. At the same time, valuations have become more attractive, especially when viewed over a long-term return horizon, the backbone of our investment philosophy. Since it is virtually impossible to time the market, we continue our focus on risk adjusted returns and remain cognizant of balancing downside risk with potential reward. To the extent volatility shifts prices and offers opportunities, we remain diligent toward identifying those which may arise in an adrenaline-charged market.
ENDNOTES
1 Cornerstone Macro, “The Spike in Libor Rates: What’s Driving It and What It Does”, dated March 26, 2018.
2 Robert Feenstra, Benjamin Mandel, Marshall Reinsdorf and Matthew Slaughter, Effects of Terms of Trade Gains and Tariff Changes on the Measurement of U.S. Productivity Growth (NBER Working Paper #15592), dated December 2009.
3 Bank of America Merrill Lynch, US Performance Monitor: Tech’s Leadership in the Crosshairs,
dated April 2, 2018.


