
Objects in mirror are closer than they appear.
In the second quarter, the S&P 500 returned approximately 3% as stocks were buoyed by respectable corporate earnings and continued hopes of reflationary growth resulting from fiscal policy and tax and regulatory reform. This optimism, reflected by U.S. equity markets trading close to all-time highs, diverged from the messaging by the bond market where falling yields signaled a more tempered view of economic growth. Notably, inflation expectations continued to disappoint resulting in further flattening of the yield curve in the quarter, driving the spread between the 2-year and 10-year Treasury yield near cycle lows by mid-June. Yields rose notably, however, in the final week of the quarter on the newly perceived hawkish stance introduced by several global central banks. Likewise, currency markets discounted a slowdown in stimulus and the ensuing rate differential, and the U.S. dollar weakened over 4.5% experiencing its worst quarterly decline since the third quarter of 2010. Volatility ensued as investors questioned whether the peak in liquidity is now behind us, and coordinated global interest rate normalization is potentially set to unfold. As such, equity gains for the quarter were more front end loaded as the index exhibited a more narrow trading range in June. On a year-to-date basis, the market posted its best first half performance since 2013 delivering over a 9% total return.
While the market continued its upward bias, noteworthy rotations and growing dispersion across styles and sectors exhibited themselves. Illustratively, U.S. value stocks lagged their growth counterparts by over 300 bps in the second quarter widening the year-to-date differential to just under 900 bps. The dearth of growth prompts investors to pay an increasing premium for those companies which can grow sustainably, and valuation differentials expanded even further. Technology, a secular growth industry, logically benefits from this bias and dominated performance from a sector perspective. Leadership narrowed as a small collection of new economy technology companies powered a large portion of the 2017 rally before these returns sputtered in June. Concerns of narrowing market leadership coincided with the interest rate volatility late in the quarter, and flows gravitated toward less expensive sectors. On a year-to-date basis, technology remains the best performing sector while energy finished deeply in the red after reversing its market leading momentum of 2016. Lastly, U.S. returns trailed those available overseas, and small cap stocks lost momentum relative to their larger brethren over a similar timeframe.
Objects in mirror are closer than they appear. This familiar phrase, etched into the side-view mirror of North American automobiles, is designed to decrease driver misperception of the space immediately to the right and left of the vehicle. This cautionary label impresses upon the driver the relative size of objects and serves as a reminder that images seen in the mirror appear smaller and farther away than in reality. While driving, perspective is everything, akin to investing. One could argue that the low level of market volatility should heed a similar warning. The apparent acceptance of the low volatility regime suggests little expectation this narrative will change yet the lack of volatility remains somewhat perplexing and feels increasingly asymmetric. While not an unfamiliar topic, this leads one to further ponder this seeming complacency.
Framing Volatility Historically
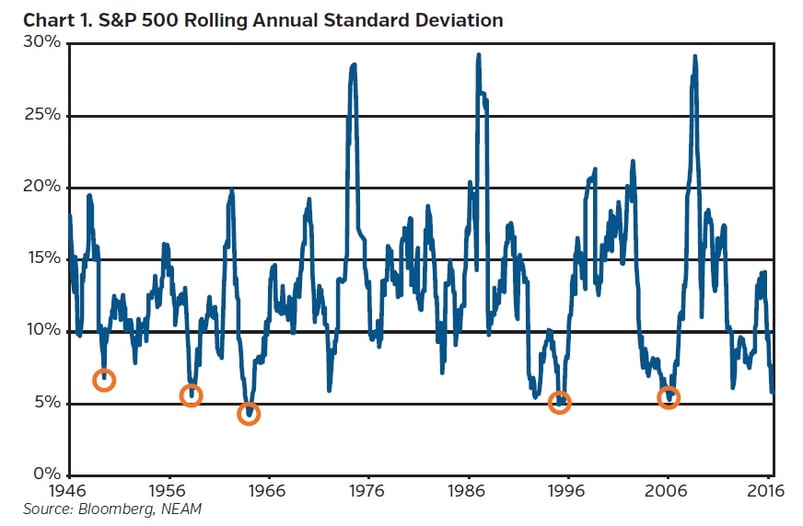
Low volatility has characterized this bull market. Chart 1 provides context on its absolute level and persistence, dimensioned by the rolling standard deviation of the S&P 500 as the chosen barometer for market volatility. The Chicago Board Options Exchange SPX Volatility Index (“VIX”), commonly used to capture volatility based on shorter term options contracts, supports a similar representation. As illustrated, periods of low volatility have certainly occurred in the past. During the five observed low volatility periods, annual returns averaged 12.6% and lasted 68 months on average compared with annualized returns of 14.6% realized over the current 60-month cycle. Comparatively, this cycle is shorter in duration but more lucrative than average. Notably, periods of historic extremes have been followed by the opposite condition, and low volatility breeds a period of subsequent higher volatility.
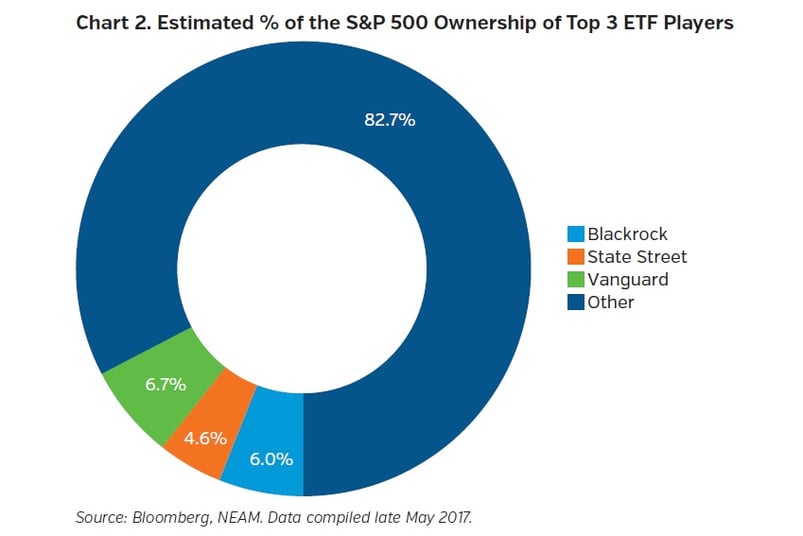
Structural reasons, in part, help explain the current regime. The rise of passive investing has weighed on volatility as the percentage of price agnostic or non-fundamental buyers increases as a percentage of the stock market. The conventional risk versus reward analysis is replaced with buying stocks commensurate with index weightings. As the penetration of passive strategies increases, these funds own a larger and larger share of each individual name within the S&P 500 and in aggregate (Chart 2). This introduces a self-reinforcing element as the flows into passively managed index funds help drive prices upward which in turn dampens realized volatility. Likewise, the emergence of volatility themed products adds another element to the market place as these systematic strategies use realized volatility to determine asset allocations and exposure levels. As realized volatility has fallen, portfolio exposure has further increased perpetuating low implied future volatility. Income production strategies play an additional role as institutional selling of volatility contracts occurs to enhance yield in the lower for longer backdrop. While these structural changes to the market cannot be dismissed, there is risk of misinterpreting their existence as a means to fully rationalize the tranquility.
Persistence
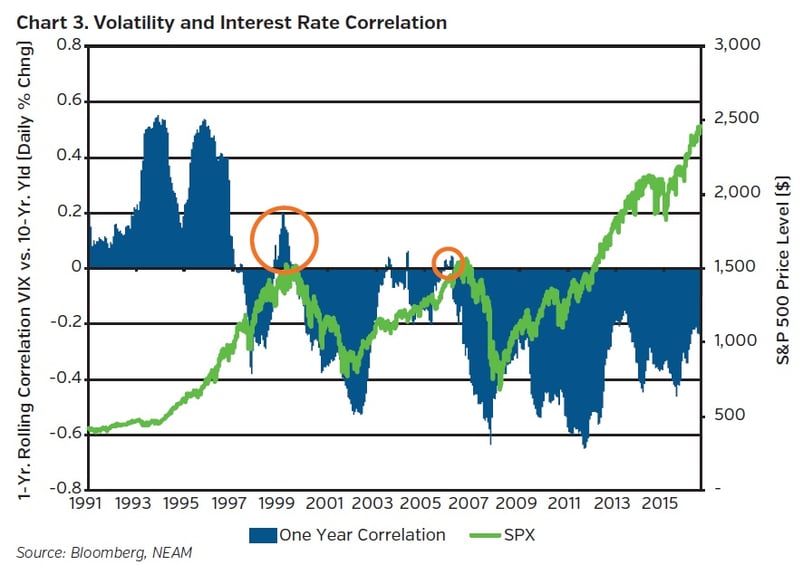
By its very nature, persistence is noteworthy. Equal thought, however, should be applied to ponder what could solicit a change in condition. Conceivably, there is a threshold for rates beyond which equities will no longer perceive the rise as friendly, and negative correlation will return. Currently, equities view rising yields as indicative of reflation momentum and have remained near highs despite the rate rise. If normalization happens too fast, however, angst could be transmitted via higher volatility, and equities could sell off in tandem with bonds. There is historical precedent, both in the late-1990s and mid-2000s, when volatility and rates had a positive relationship; subsequently, the equity market experienced a correction (Chart 3). As such, hawkishness and policy missteps could have a disruptive effect on volatility and lead to equity weakness especially in light of the consensus view for extremely slow and gradual normalization from rates which remain below 50-year averages.
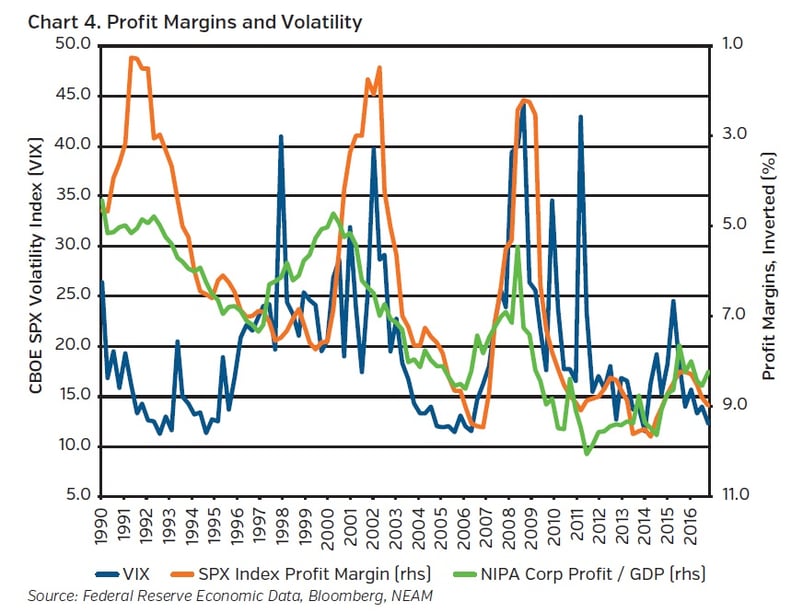
Corporate profit margins, as a measure of the health of the economy, also provide helpful context for the sustainability of low volatility. National Income and Profit Accounts (“NIPA”) data provides a broader view of business profitability and is shown alongside the S&P 500 margin levels in Chart 4. As illustrated, profit margins tend to be inversely correlated with equity market volatility. The low volatility reflects the perceived health of the ecosystem despite some recent divergence between the more broadly measured margin levels from NIPA and those for the S&P 500 subset. According to research conducted by Cornerstone Macro, NIPA profit margins have historically peaked prior to S&P 500 margins1. As such, any notable degradation in profit margins of the S&P 500 could be a catalyst for volatility to rise.
Periods of low volatility are not uncommon, and the duration of the current regime remains below average by comparative standards. There are also key structural changes in the market that could further support its longevity. As a counter balance, the impact of systematic volatility themed strategies, which stylistically would unwind leverage as volatility spikes, is unknown. Likewise, the returns generated to date are above average making its durability a focus, and valuations leave little room for error. Extended periods of complacency historically do not end well, and there is danger in misinterpreting the current tranquility. Thus, we remain cognizant of balancing downside risk with potential reward as the heightened level of global policy uncertainty stands in sharp contrast to near record low equity market volatility, akin to the distortion possible from the side-view mirror. Perspective is everything.
Endnotes
1 Cornerstone Macro, CSM Eco Outlook: U.S. dated May 23, 2017 – “NIPA Profit Margins Are Declining And Are Inversely Correlated with Risk Premia”


