As the calendar turns to a new year, the Fed has begun its long awaited program of monetary tightening. The question remains—like the water drought in California—will 2016 bring an end to the “yield drought”? Hope springs eternal and the c-suite is certainly hoping this is the start of a trend toward higher book yields and the inflection point for declining portfolio book yields. This Quick Takes will look at both the prospect for higher levels of investment income and a return to firmer pricing in (re)insurance markets.
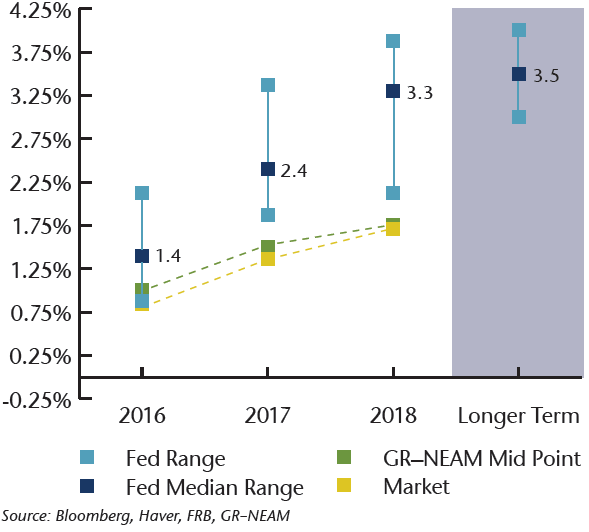
The recent monetary policy moves by the Federal Reserve and the ECB show clearly the divergence happening in the global economy. Since 2008, the Fed has run three Quantitative Easing (QE) programs, expanding the Fed balance sheet by over $3.5 trillion (see Chart 1.) Western central banks in total have printed $8 trillion over this same time frame. While the ECB and Bank of Japan continue to deal with slow-growing, low-inflation economies, central bank policies in the U.S. and UK are diverging. The U.S. economy, while still not growing at levels normally seen in this part of the economic cycle, is still growing at over 2% GDP and most importantly creating jobs at a pace of around 200,000 per month. The Fed was finally forced to take action. Keeping rates at the zero bound leaves little dry powder for the next downturn, and Ms. Yellen and her band of merry policymakers have finally started to make some music. The big question for 2016 is, “At what pace will the Fed keep its foot on the gas and what will happen to the shape of the yield curve?” An easy place to start is by observing what the FOMC members and markets are predicting. Chart 2 shows the Fed “Dot Plot” for the next three years for federal funds’ rates, the mid-point of the GR–NEAM base case interest rate forecast and, lastly, the market projection of federal funds’ rates using the forward curve. As you can see in all cases, the terminal rate is still well below that of the median terminal fed funds rate of 3.5% set by the Fed.
Chart 1. Fed Balance Sheet Growth
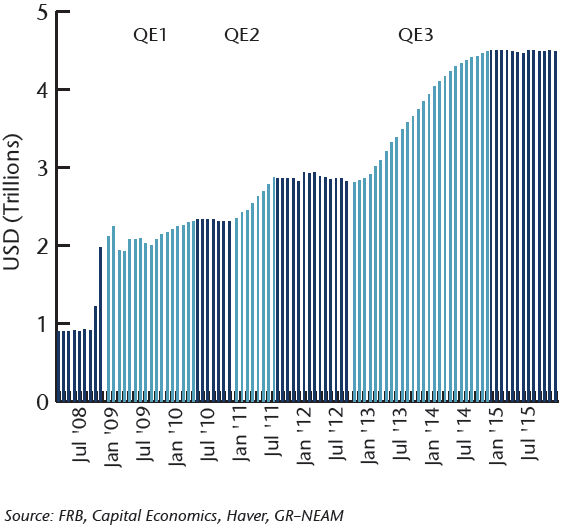
Chart 2. Rate Expectations (with longer term)
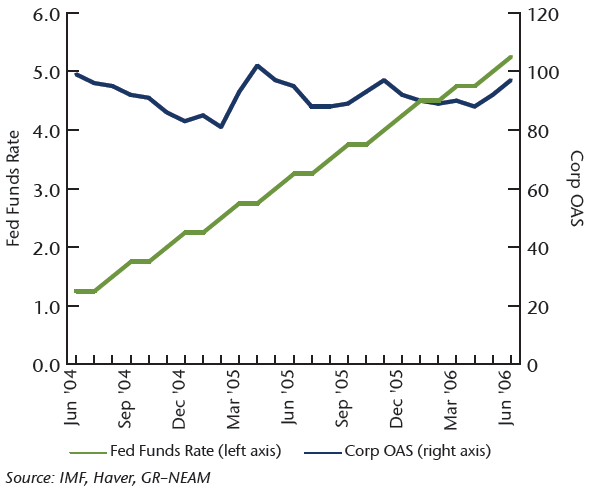
When trying to predict the shape of the yield curve, one clear lesson learned from the last seven years of ZIRP (Zero Interest Rate Policy) is that monetary policy is an ineffective mechanism for influencing the long end of the yield curve. Growth prospects and inflation expectations are the key drivers. Recent IMF projections for world growth in 2016 are a still anemic 3.4% (see Chart 3). China, which has grown to 17% of global GDP, is feeling the hangover of an overbuilt and overleveraged infrastructure in addition to the difficult transition to a more services driven economy. Japan is back in recession as an aging workforce continues to be a headwind for the economy. The prospect for a flattening yield curve driven by Fed tightening on the short end, and slow global growth and low levels of inflation on the back end, are certainly rising. If Treasury rates stay low, will investors be rescued by the prospect for higher spreads over the risk free rate? Chart 4 below reflects corporate bond spreads during the last tightening cycle in 2004–2006. As this chart indicates, don’t hold your breath waiting for higher spreads to be your savior. In addition, a strengthening dollar will continue to be supportive of demand for dollar-based fixed income securities leaving spreads relatively firm. An unexpected sharp economic downturn would be the one caveat to this projection.
Chart 3. World Growth Estimates
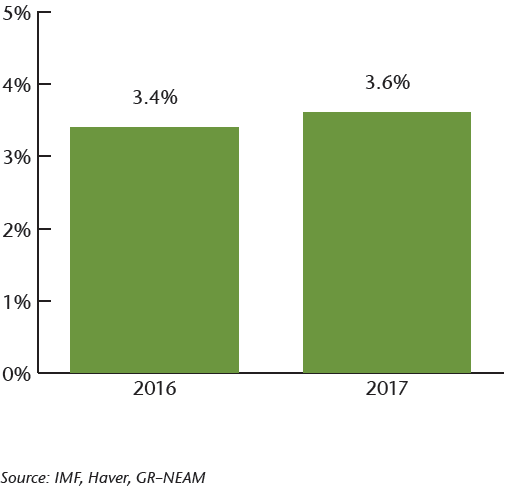
Chart 4. Fed Tightening and Corporate Spreads
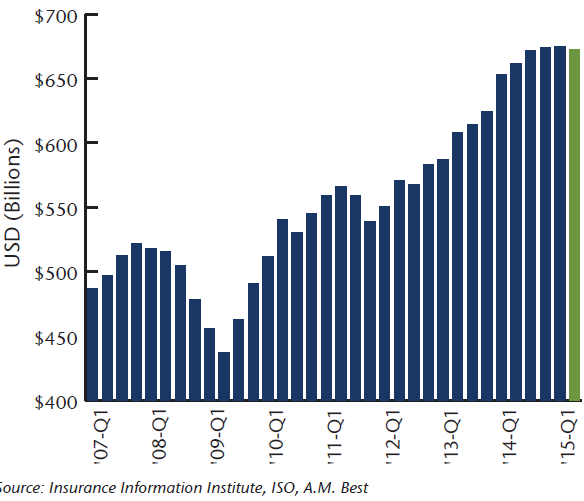
On the liability side of the balance sheet, many of the capital market dynamics driving asset returns and yields are also having an indirect impact on the technicals for insurance pricing. Low fixed income yields and equity returns have driven traditional investors—such as pension funds and hedge funds—to turn to the insurance market for yield. The continued strong appetite for Cat bonds and hedge fund reinsurance vehicles have only driven pricing in the traditional primary and reinsurance markets to even lower levels. Chart 5 shows the growth in P/C industry capital and surplus over the last 8+ years culminating in a near record high of $672.4 billion at 6/30/15. The industry has now close to $1.00 surplus for every $.73 of NPW (Net Premium Written), close to the strongest claims-paying status in its history. In addition the stronger dollar has brought traditional non-dollar foreign investors to the Cat bond market—in many cases on an unhedged basis. We all know how the movie ended for many of them in the subprime mortgage market. Lastly, the insurance industry has been at the epicenter of the global surge in M&A activity as organic growth has been slow across many industries. M&A activity for 2015 in the P/C industry is expected to come in close to the record high of $55.8 billion reached in 1998. Too much capital chasing too little premium is generally not the road to prosperity.
Chart 5. Policyholder Surplus, 2006 Q4–2015 Q2
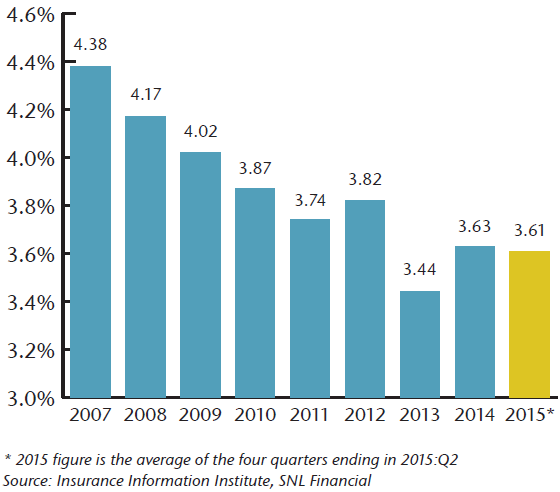
Given the expectations for investment returns described earlier, absent improved underwriting results, return on equity will be challenged once again in 2016. Chart 6 shows the significant decline in P/C book yields since the crisis in 2008. Higher yields cannot come soon enough for the insurance industry. Time will tell. In the meantime, the song remains the same.
Chart 6. Net Yield on Property/Casualty Insurance Invested Assets, 2007–2015*
