
Throughout the majority of 3Q 2016, the U.S. equity markets were characterized by a surreal calmness as they generally traded within a very narrow price and volatility band, akin to a placid lake as the summer sun rises over the horizon. Summertime is characteristically quieter in the financial markets, but this level of tranquility was notable. First, the majority of the gains for the quarter were derived in July before investors ostensibly disengaged for summer vacation. Additionally, the market held an almost nine week stretch during which the S&P 500 index closed within 1% of the previous day’s close. Volatility, as measured by the Chicago Board Options Exchange SPX Volatility Index (the “VIX”), likewise remained subdued, absent one spike in early September fueled by interest rate uncertainty induced by hawkish Federal Reserve commentary. This composed environment stood in sharp contrast to last August when the surprise devaluation of the Chinese Yuan rattled markets and drove the S&P 500 down more than 10% on concerns over potential deflationary pressure from China’s slowing growth. By comparison, the S&P 500 returned almost 4% for the 3Q this year versus the sharp market decline exceeding 6% for the equivalent year ago period.
Upon closer inspection, along the placid surface of our metaphorical lake, sector rotation ripples emerged. Investor mindset, after exhibiting an insatiable appetite for yield in the first half of the year, shifted to bargain hunting among earlier price laggards. Yield centric sectors, specifically utilities, telecom, consumer staples and real estate (now an independent sector versus prior classification within financials) posted negative absolute and relative returns for the quarter. In contrast, technology, the lowest yielding sector within the S&P 500 produced double digit gains in the corresponding period. The preference for bargain hunting broadened market gains to include all sectors, excluding financials, on a year-to-date basis through September. Not coincidentally, sector rotation corresponded with the shifting probabilities for a potential increase in U.S. interest rates predicated on improving economic data. Logically, higher rates decrease the value of the income streams from yield oriented entities pressuring their stock prices. Pro-cyclical sectors, deemed beneficiaries of the improvement in the economy implicit in the need for higher rates, conversely improve in price. These trends prevailed in the quarter. Another factor seemingly at play might have been investor wariness of overpaying for companies as the bull market approaches its eighth year. Yet, this sudden awareness of valuation would stand in surprising contrast to the calm tenor overarching the market.
Signs of Potential Market Complacency
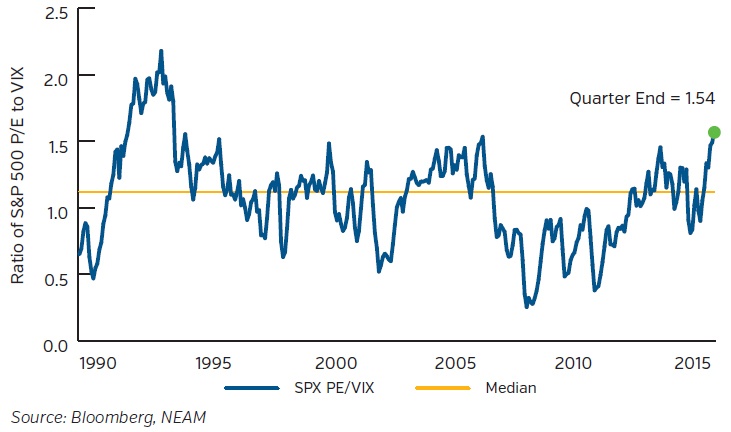
The recent serenity of the market raises the question of complacency and merits closer attention in our view. We begin by examining the relationship between volatility and valuation. Using the VIX as the gauge of volatility and the S&P 500 trailing P/E as the measure of market valuation, the ratio of these variables calibrates the relationship of fear and greed at any given time (Chart 1). By definition, this ratio has both a numerator and a denominator which can themselves be high or low, so we focus on the extremes to derive informational content. When the ratio is low (descending notably below 1), this portends that the valuation of the market is below average and the volatility is high, as evident in the 2008 Financial Crisis period or prior recessionary periods in early 1990s and early 2000s. Against this backdrop, while there is uncertainty, the lower valuation conceivably compensates, in large part, for the risks. When the ratio is high (ascending significantly north of 1), the math implies that the valuation of the market is high and volatility suppressed, akin to the existing conditions. This combination is much more precarious as there is little margin for safety as investors are pricing in some permanence to the low volatility and a level of comfort regarding visibility of earnings.
Chart 1. Complacency
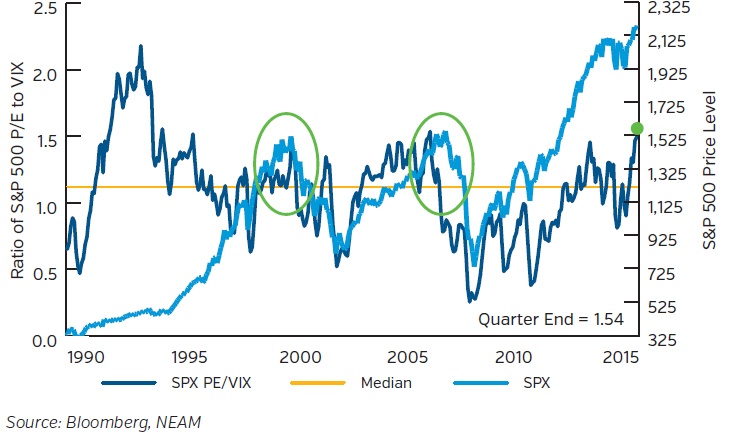
By now, it is well understood that the role of central banks has altered risk asset pricing, suppressed volatility and challenged historically reliable predictive relationships and market signaling metrics. Financial repression policies, such as quantitative easing (“QE”) and zero interest rate policy (“ZIRP”), undoubtedly cloud the waters. Complacency, seemingly evident in a historical context, may only be perceived in today’s terms. We could indeed be in a period where low volatility can be perpetuated as a result of these policies, but eventually gravity reasserts itself. History has proven time and again that complacency is eventually disrupted. Charting the above ratio alongside the S&P 500 price trends (Chart 2), it becomes evident that investors would have been wise to heed the cautionary message when this metric reaches these levels, as it did in 2000 and again in 2008. The current level may well prove to be a latent yellow flag.
Chart 2. Market Signals
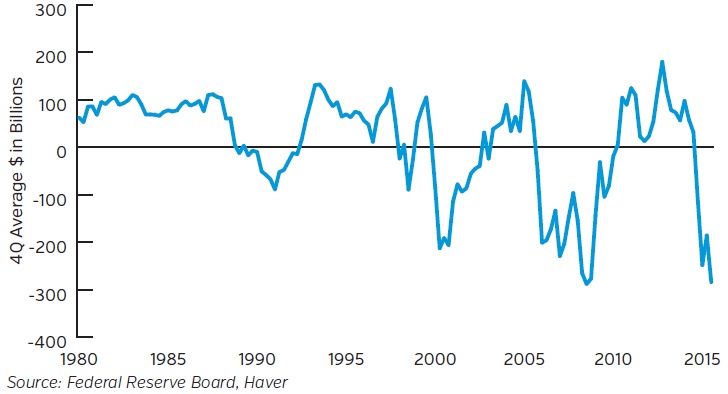
The funny thing about complacency is that it is most evident in retrospect. Consulting the dictionary, complacency is defined as: “A feeling or contentment of self-satisfaction, especially when coupled with an unawareness of danger, trouble or controversy.” Yet, there are fundamental signposts that should be shaping investor awareness. Corporate earnings have been a debated topic soliciting caution in prior publications (see Outlook Second Quarter Equity Review: Quality over Quantity and First Quarter 2016 Equity Review: The Aging Cycle). Broadening the scope of the discussion, the elevated level of corporate debt should be on the radar screen as higher leverage could progressively challenge the resiliency of the market. Corporate debt has been growing faster than corporate revenue since the Great Recession, and S&P 500 constituents have collectively spent more on capital expenditures and stock buybacks than they have generated since 2013 (Chart 3). As such, these companies have added $1 trillion in estimated debt during the last 3 years to fund this gap. Elevated leverage, standing at 2.3x median debt-to-EBITDA excluding financials versus 1.5x in 2010, may preclude a further substantial rise.2 With earnings under pressure and debt levels high, the flexibility to use further debt to fund the cash flow deficit is more limited.
Chart 3: U.S. Net Corporate Cash Flow Deficit
We continue to advocate quality as the best strategy in this environment. Higher quality stocks, as measured by the S&P 500 Quality Index, performed better than the market average and have not lost money on a trailing ten year basis beginning in 2004 (Chart 4). Bank of America Merrill Lynch confirmed a similar assertion in a longer study dating back to 1986, covering a broader variety of economic periods. 3 While there could be some opportunity cost in owning quality in late bull market rallies, rewards should be accrued when the cycle turns.
Chart 4: High Quality Stocks vs. SPX (10-Year Annual Total Return)
The level of market complacency gives us pause, especially when viewed in conjunction with valuations. High valuations and low volatility are troublesome traveling companions. There is little room for error, and central bank policy further muddles the situation. We continue to assert that the market resides in a maturing economic cycle with elevated valuations and suppressed volatility. Consequently, the risks of complacency may be substantial. Against this backdrop, we continue to advocate quality and believe it will hold relevance for forward equity returns. When the cycle turns, quality can sustain itself. In the meantime, complacency amplifies an already challenging backdrop and lends further support to factor based passive fund flows. From our standpoint, we continue to believe in mean reversion and will seek to identify beneficiaries of that eventuality. Our metaphorical lake may get choppy, and as active managers, we will look to capitalize on any forthcoming opportunities.
1 Boyar Research, September 15, 2016 – “Boyar’s Guide to Profiting From Uncertainty”
2 Barclays, U.S Equity Strategy, October 11, 2016 – “Payout Growth to Slow: Upgrade Healthcare and Downgrade Energy”
3 Banc America Merrill Lynch, Equity and Quant Strategy, United States, October 5, 2016 - “Exploring the Dark Side: Is It about time for a recession?”


