
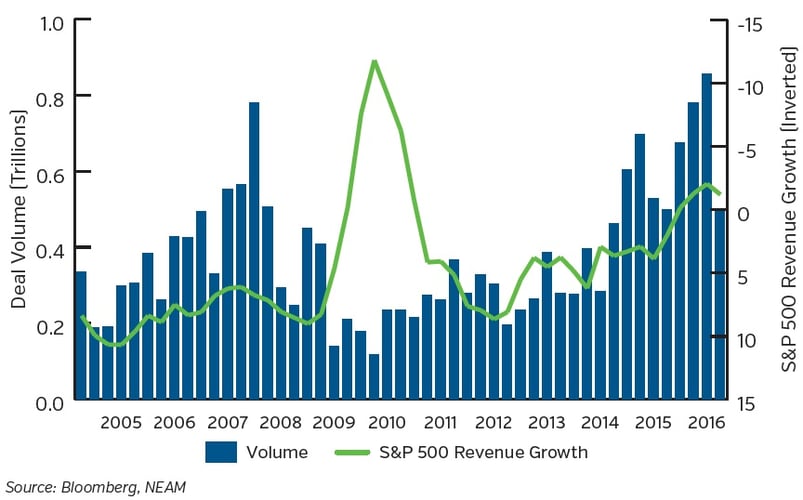
Earnings for U.S. corporations have been sluggish for the past six quarters. This has been largely influenced by the collapse in crude oil prices and the strong U.S. dollar which has negatively impacted foreign exchange translation for companies generating business overseas. Additionally, earnings reflect the low nominal growth backdrop and the aging business and credit cycle. Revenue expansion is difficult to achieve in virtually all areas of the economy, and in the absence of sufficient cost reduction, profit pressure has increasingly permeated more sectors. This anemic growth environment has helped to propel the current merger and acquisition cycle as acquirers pursue inorganic means to drive more profit. Chart 1 illustrates the correlation between slowing revenue growth (inverted) and the velocity of North American merger and acquisition (M&A) activity.
Chart 1: North America M&A Growth vs. S&P 500 Revenue Growth (Inverted)
The rationale for this surge in M&A is relatively straightforward. Companies are always seeking to grow revenues, expand margins and improve returns on capital. Since top line expansion has been elusive in this slow growth environment, companies are seeking to add scale via acquisitions to enhance capabilities and financial performance. Scale can create efficiencies and improve strategic positioning via geographic expansion, broadening target markets and leveraging new products or technological capabilities. Importantly, consolidation heightens competition which, by its very nature, spurs more consolidation, further underpinning the scale rationale. In sum, scale can help meet financial objectives while enhancing competitive advantage in a slow growth world.
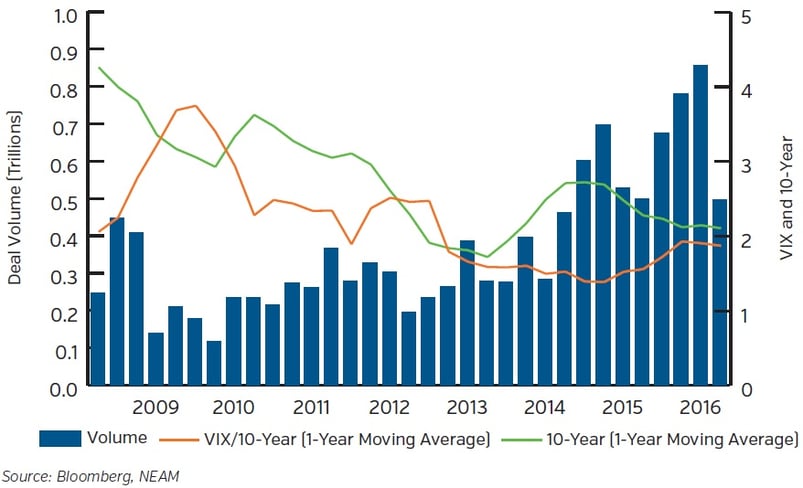
The current M&A cycle has been facilitated by low volatility and low yields, as shown in Chart 2. The attractive cost of funding available in the corporate debt market has cemented debt as the preferred financing vehicle in these transactions. According to data from Morgan Stanley, the top 1,500 U.S. companies (ex-financials) issued over $500 billion in net debt in 2015, the second highest reading since 1985 and nearly 50% more than pre-financial crisis levels. Hardly a coincidence, a significant portion of this record issuance has been driven by merger transactions. Further, in recent years, M&A has been dominated by “mega” deals, necessitating higher levels of outside funding. Transactions totaling over $25 billion accounted for more than half of the large cap M&A deal volume in 2015, according to analysis by Wells Fargo. Likewise, the rally in stocks has given companies a stronger currency to use in these transactions, should they opt for an equity component. The non-existent Initial Public Offering (IPO) market and the lack of liquidity events for private companies may increasingly broaden the M&A cycle toward smaller and midsize companies. For example, Blue Coat, a security hardware, software and service provider, opted to sell to strategic buyer Symantec, maker of Norton antivirus software, at roughly 8x revenue rather than pursue its recently filed IPO.
Chart 2: Downward Trend in Rates and Volatility
Deals and Volatility – Not Always at Odds
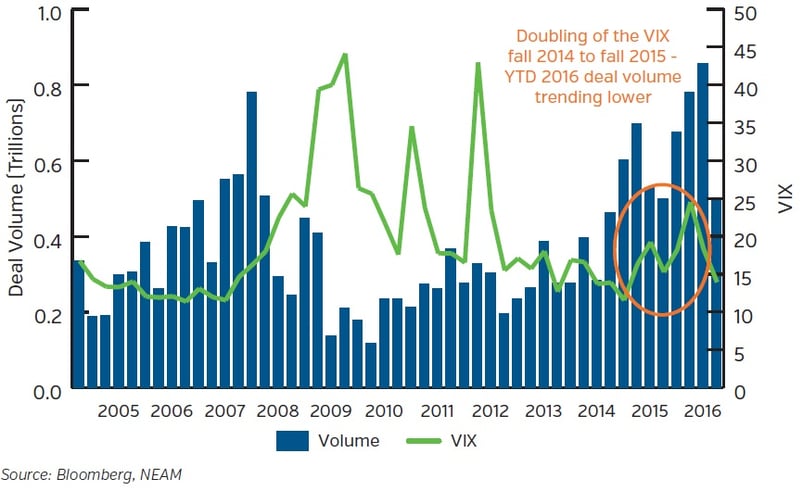
Deal volume is inversely correlated with stock market volatility on a lagged basis (Chart 3). Intuitively, uncertainty can lead to inaction. Volatility, however, can also provide a catalyst for action as attractive assets may not be immune to valuation adjustments during more volatile times. Microsoft’s recent purchase of LinkedIn, the leading professional networking social media platform, provides a case in point. LinkedIn, valued at close to $31 billion at its peak, fell victim to its own slowdown in revenue growth, compressing its valuation. Consequently, Microsoft was able to begin its courtship with more reasonable economics. The $26 billion transaction price, valuing LinkedIn at roughly 8x revenue and representing a 48% premium to where it had been trading, can hardly be considered a steal. Nonetheless, the allure of synergy and scale prompted Microsoft to pay a relatively hefty price as the Company seeks to enhance its competitive position by expanding further into the service business.
Chart 3: Correlation between VIX and North American M&A Volume
Risk Pricing and the M&A Cycle
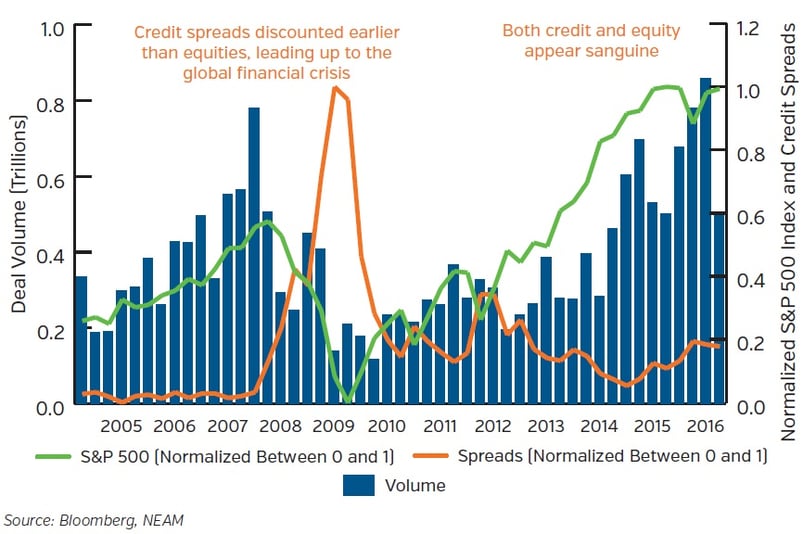
Robust M&A volume is a derivative of low nominal growth within an aging U.S. business and credit cycle. The logical questions become when will it peak? Or has it possibly already done so? Conventional wisdom would have us believe that merger activity tends to peak just before the turn in risk assets. This relationship is highlighted in Chart 4 for both equity prices and corporate bond spreads. A keen eye should be kept on the M&A market to potentially provide clues for prospective risk pricing. Premiums paid are another important barometer. Historically, late cycle M&A has often led to overpayment for assets as the premiums are on top of elevated market prices. For now, as rates remain low, the rationale for business combination has not changed nor has the ability to fund such deals. While Brexit has increased volatility, corporate balance sheets still have capacity so trends to date in 2016 may prove to be the pause that refreshes, should confidence return.
Chart 4: Risk Pricing and the M&A Cycle
We at New England Asset Management are cognizant of this backdrop and its implications for equity returns. Our equity strategies focus on high quality companies with sustainable competitive advantage, strong financial profiles and attractive returns on invested capital. We believe these attributes can drive equity price performance over the long term. These types of companies are more often positioned as the acquirer and can accrue the previously described scale benefits. Microsoft, a core holding, is one such illustration. Additionally, Medtronic, a medical technology company known for its cardiac franchise, has also benefited from acquisition activity. Specifically, Medtronic enhanced its competitive advantage by executing one of the largest deals within med tech history with its acquisition of Covidien. Through this combination, Medtronic augmented its scale and added breadth of product to better position itself for bundled purchasing, a protocol increasingly used by hospital administrators within the evolving healthcare landscape. Likewise, Medtronic’s relative positioning is potentially enhanced through its pricing flexibility funded in part by the deal synergies. While our strategies will continue to focus on quality companies who have independent investment merits, these same companies may well be beneficiaries of the current M&A environment.
- Robust M&A volume is a derivative of low nominal growth within an aging U.S. business and credit cycle.
- The rationale for business combinations has not changed and low rates continue to enable funding. Deal activity, however, is increasingly influenced by rising volatility.
- The M&A market peak may have occurred, but risk pricing via equity prices and credit spreads remains relatively sanguine.
- New England Asset Management equity strategies are more likely to include acquirers, given our fundamental focus on quality companies.
The security examples shown are intended to help clients understand our investment management style, and
should not be regarded as a recommendation of any security for any person. These examples were selected to
show examples of companies we select for our clients based on the criteria we identified. Past performance is
no indication of future performance. Although we focus on long-term investments, portfolio holdings are subject
to change.


