
1Q 2019 Review
After a tumultuous final quarter of 2018, the tenth birthday of the current bull market culminated in the best quarter since 2009. The Federal Reserve pivoted to a more dovish stance in early January sparking the powerful risk rally which spurred the S&P 500 to return over 13% for the quarter. The easing of financial conditions undoubtedly benefited risk assets. Progress on trade negotiations also buoyed market sentiment as trade war risk diminished. Stocks marched higher despite the lower rate of estimated earnings growth for the 1Q, as investors deemed this slower pace of growth transitory. Overall, the first 90 days of the year were the mirror image of the preceding quarter. Volatility, as measured by the Chicago Board Options Exchange Volatility Index (“VIX”) fell by over two-thirds relative to its recent late December peak. The S&P 500 finished its roller coaster ride just 3% shy of its all-time high in a nearly straight line retracement from year-end.
As a youngster, one often heralds the arrival of each new decade, as if the ten-year milestone magically meant something. While arbitrary, it segments time into discernible chunks which can be used to review achievements and goals. Likewise, it provides a moment to reflect on how much change would ultimately unfold in the interval of time before the advent of the next decade. This is true in investing as well. As we reflect on the last decade, we delve into what made it so very remarkable, and we consider its potential effect on the future.
The Dazzling Decade
It has been a decade to remember. The S&P 500 averaged a total annual return of 17.7% since the market low established on March 9, 2009.1 While this may lag several other impressive periods, the duration establishes this equity market expansion as the longest in the last 100 years exceeding the prior record achieved from 1990 to 2000.2 The merits of scale characterized these gains as the top 10 holdings contributed almost a quarter of the appreciation. Two of these companies actually exceeded the trillion-dollar market capitalization threshold as bigger proved to be better in this circumstance. Suffice it to say, the gains over the decade were not necessarily equally distributed.
While there is evidence of dominant companies over the last decade, Bank of America Merrill Lynch has noted that sectors exhibited more differentiation than individual stocks over the 1998-2018 period.3 Said another way, investors generated more alpha from sector allocation decisions than from individual stock picking. Illustratively, a large allocation to technology would have been fruitful. Data suggests, however, this is ripe for change as security selection is poised to become more important than picking sectors.
The elongation of this cycle persists in large part due to accommodative policy. Central banks indemnified risk by underpinning asset prices with their collective balance sheet. Liquidity created value as risk assets rose in sync with this monetary expansion. The Federal Reserve implemented its historic accommodative policy ballooning its balance sheet to over $4 trillion, far exceeding the scale of anything else in U.S. monetary history. Correspondingly, the Federal Funds rate hit a low of 25 bps and ultimately achieved a zero bound. Internationally, comparable rates fell below zero, effectively creating free money for borrowers, sovereigns and corporations alike.
When considering the policy lever and its impact on future asset prices, its scale is virtually impossible to replicate. When framed in a rate of change context, the second derivative argument commands attention since prospective financial engineering will be hard pressed to contribute fuel. Interest rates, the basis for security valuations, can only go so low, after all. The Federal Reserve may be exhibiting peak dovishness, forcing the baton to turn to fundamentals for the next leg in equity market returns. With growth decelerating and margins near historic highs, earnings must stay strong and resilient in order to offset upward labor costs. Hence, it will need to be earnings growth that drives the market to new highs, given low rates and the less stimulative impact of conventional policy drivers.
Domestic Dominance
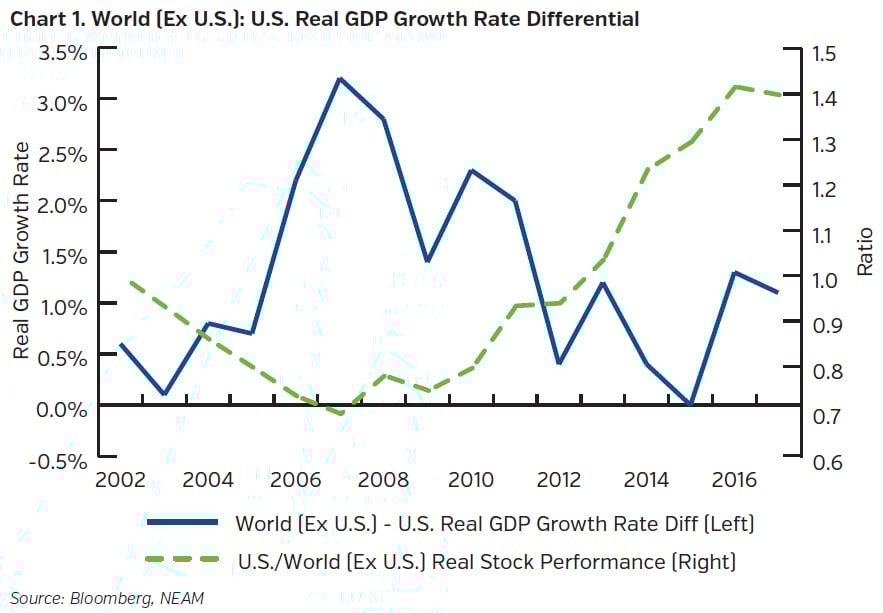
Over the past decade the returns of the U.S. market commandingly surpassed those of non-U.S. markets driven by the trend in relative real GDP growth differentials (Chart 1) as well as political risks. By order of magnitude, U.S. large cap gains tallied more than double the levels earned in most overseas markets. While the U.S. contribution to global GDP growth averaged only 10% during this period,4 its relative stability has been highly rewarded. Similar to other countries, the U.S. is not immune to structural challenges including debt and demographics. Yet, the underlying complexion of the economy is also seen as a comparative advantage with technology as a core competency and driver of persistent economic growth.
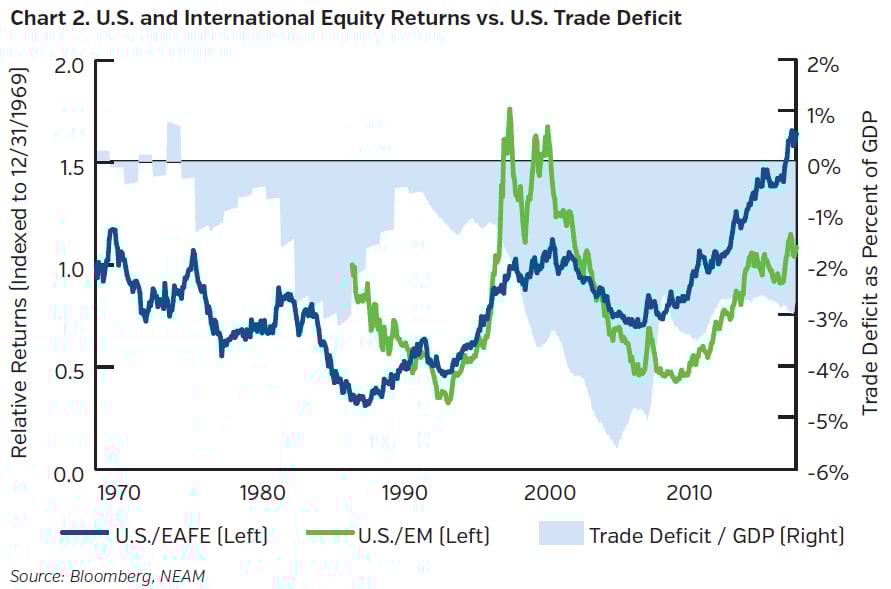
Regarding the sustainability of superior U.S. equity market returns, trade also has a bearing. By running a deficit, America makes a large net contribution to the rest of the world and has done so for the past 50 years. Relative returns are impacted by the direction of the trade deficit. During the past decade, the U.S. trade deficit has shrunk benefiting U.S. relative returns (Chart 2). Should the U.S. enter a period where the trade deficit expands, relative returns will favor overseas markets, both developed and emerging. In sum, relative real GDP growth as well as how it is funded will shape prospective U.S. equity returns relative to the rest of the world.
Growth Scarcity
The current U.S. economic expansion would become the longest on record as of July when it marks 120 months. While the growth trajectory is slower than past recoveries, it is notable in its stamina. Against this backdrop of a slower economic recovery, profit growth becomes more scarce. As a result, investors will pay a premium for differentiated, growth-generating business models. Consequently, growth has outperformed value in seven of the last 10 years with an average outperformance of over 350 basis points.5 The differential, defined as the spread between the cheapest and most expensive quintile by price-to-earnings ratio, appears to have reached an extreme last seen at the turn of the century during the technology bubble of the late 1990s (Chart 3).
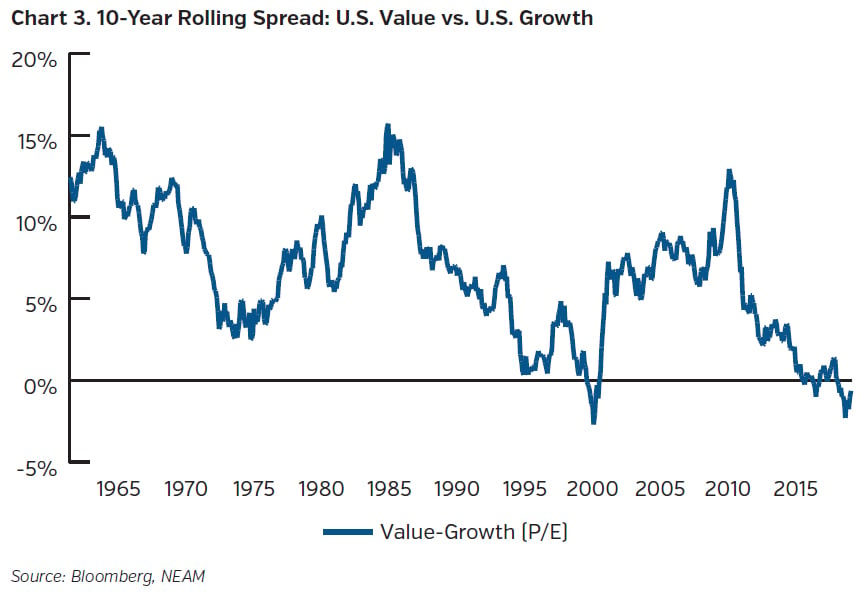
As the chart illustrates, these cycles can be very long. For a value rotation to take hold, history suggests that higher rates, steeper yield curve and cyclical strength must coalesce. While the Fed has indicated, in no uncertain terms, that it is on hold for the time being, if interest rate normalization resumes, value stock performance could improve as interest rates gradually rise alongside economic growth. Traditional value sectors, such as energy, financials and materials, would correspondingly assume market leadership. Mean reversion adds a compelling incremental rationale to this mosaic. For now, however, the lower-for-longer rate backdrop and subdued inflation bias dictates sentiment and keeps market positioning asymmetrically favoring growth stocks.
Conclusion
The past decade has dazzled investors. Policy intervention and financial engineering have governed investment returns. U.S. equities and growth stocks have also reigned supreme. Domestically, sector allocation decisions swayed returns far more than individual stock picking. Naturally, one ponders whether the next decade will reflect these same trends or if investors would be wise to heed mean reversion principles and contemplate the areas left behind. The next decade may indeed look very different from the last.
NEAM has long believed in mean reversion. As such, with the U.S. facing deceleration in GDP and EPS growth from tighter resources and less accommodative policies, international exposure should be beneficial. We continue to use international exchange traded funds (“ETF”) vehicles as a prudent diversification tool where supported by enterprise risk capacity. While the majority of our equity allocation will remain domestically focused, international equities merit investment dollars as part of a long-term strategic equity allocation.
While sector allocation decisions proved more influential in the past decade, NEAM continues to focus on security selection in our domestic active strategies. This is paramount in a late cycle backdrop. The hallmarks of a late cycle backdrop - unemployment near a record low, consumer confidence extremely high, low but rising core inflation, yield curve nearing inversion – abound. Fundamentals have likely peaked and are characteristically weakening. While decelerating growth can still be supportive of equities, these market inflection points often breed volatility. Volatility offers opportunity for fundamental stock picking to drive potential alpha.
Within our active portfolios, our positioning still features some defensive elements that we believe will accrue benefits over a full market cycle. We continue to assert valuation matters. Reversion to the mean, likewise, remains a guiding principle in our investment approach as does a long-term return horizon; both require patience. With valuations back at five-year average levels, we continue our focus on risk adjusted returns, remaining cognizant of balancing downside risk with potential reward within the U.S. market.
Endnotes
1 Period measured from March 9, 2009 through quarter end March 31, 2019 via Bloomberg.
2 Stifel, “Market Sightlines”, dated March 15, 2019.
3 Bank of America Merrill Lynch, “U.S. Equity Strategy in Pictures”, dated April 1, 2019. Correlation study.
4 Per NEAM Calculations.
5 Bank of America Merrill Lynch, “U.S. Equity Strategy in Pictures”, dated April 1, 2019.


