Euro Area interest rates have been hitting new historic lows and yields on many bonds have actually turned negative. Claudio Borio, head of the monetary and economic department at the Bank for International Settlements in Basel, (which acts as an advisory body for central bankers) recently wrote that “bond markets show us day after day [that] the boundaries of the unthinkable are exceptionally elastic” and the idea of a bond having a negative yield was certainly unthinkable until quite recently.
In this Quick Takes we will explore the background to these exceptional times for Euro Area bond investors and explain what a negative yield means on a bond. In a subsequent Quick Takes we will explore the implications of negative yields for Euro Area investors with a focus on insurance companies.
In September 2014 the European Central Bank (ECB) – responsible for monetary policy in the Euro Area – lowered its Main Refinancing Rate to 0.05% and the Deposit Facility Rate to –0.20%. This continued a policy, in place since the start of the financial crisis at the end of 2008, which reduced the interest rates on which they provide and absorb liquidity to and from the Euro Area banking system.
Reducing interest rates is a standard part of any central bank’s toolkit however setting the Deposit Facility Rate under zero was a first among developed central banks who, unless in special cases for currency reasons, have avoided setting negative policy rates (both the U.S. Fed and the U.K. Bank of England held policy rates above zero citing practical or institutional reasons for not cutting rates any further).
Three other central banks (Switzerland, Denmark and Sweden) also cut rates into negative territory in each case either to prevent capital inflows and/or to prevent upward pressure on their exchange rates. The introduction of negative rates by the ECB, however, came against a backdrop of dramatically falling inflation expectations, a governing council that was then very divided on the merits of Quantitative Easing and the resultant pressure on the council to engage in further non-standard monetary policy measures. Table 1 below shows the Central Banks which currently have set their policy rates under zero percent:
|
Table 1: Central Banks with Negative Official Rates |
|
|
ECB - Deposit Rate Facility |
-0.20% |
|
Sweden – Repo Rate |
-0.25% |
|
Switzerland – Target 3-month LIBOR Rate |
-0.75% |
|
Denmark – CD Rate |
-0.75% |
Source: Bloomberg
In January of this year having “crossed the Rubicon” of negative policy rates, the ECB also “crossed the line” of Quantitative Easing by announcing a sovereign bond purchase programme, adding to its existing private sector asset purchase programmes. The stated aim of this approach was to address the risks of a prolonged period of low inflation. Specifically, the ECB plans to expand its balance sheet by buying Euro Area Government and other securities at a rate of €60 billion per month starting in March 2015 and continuing until September 2016.
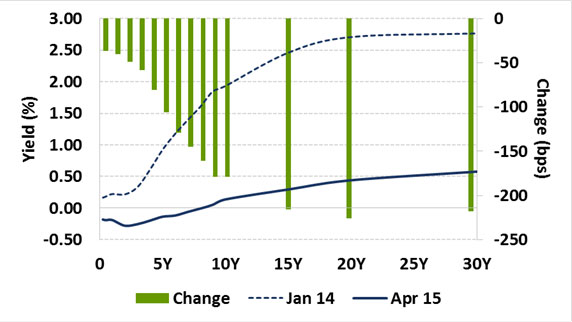
The following charts and table (German yield history, German Yield Curve change and Euro Area periphery yields) show the dramatic fall in German Bund yields since the beginning of 2014 which have been replicated across all Euro Area sovereign yields (with the exception of Greece) and the move into negative yields that occurred during 2015.
Chart 1: German 10 year Government Bond Yield History (’14-Present)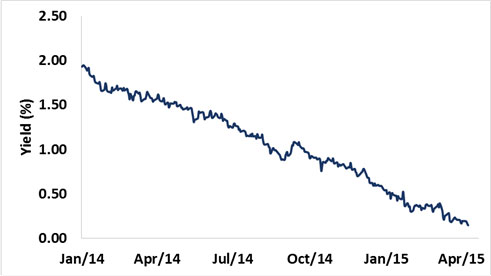
Source: Bloomberg
Chart 2: German Government Bond Yield Curve (’14-Present)
Source: Bloomberg
|
Table 2: Euro Area Periphery Yields in % (as of 08 April 2015) |
|||
|
Tenor |
2Year |
5-Year |
10-Year |
|
Spain |
0.02 |
0.48 |
1.18 |
|
Italy |
0.16 |
0.48 |
1.24 |
|
Portugal |
0.00 |
0.77 |
1.60 |
|
Ireland |
0.07 |
0.21 |
0.71 |
Source: Bloomberg
The reasons for this relentless fall in yields into negative territory are the negative policy rates on the part of the ECB and also the scarcity of assets – especially high quality assets – in the market. The fall in yields reflects the “yield grab” that has taken place as the ECB starts out on a QE programme that will purchase €60 billion per month in bonds from a pool of available assets that is almost static.
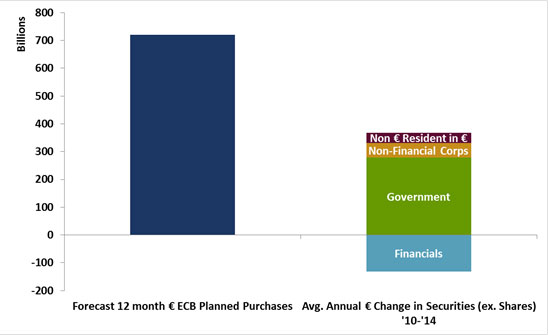
Chart 3 below shows how planned ECB purchases over the next year greatly exceed historical average annual Euro Area securities issuance (2010-2014). In fact, net Euro Area sovereign bond sales are actually set to fall this year.
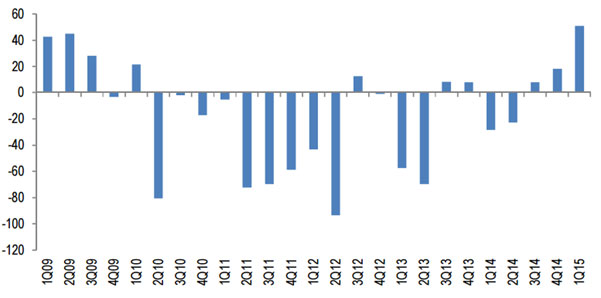
Chart 4 further shows how net issuance by investment grade corporates over the last few years has been negative. ECB QE is effectively shrinking the supply of available assets. Given the smaller relative size of the European bond market compared to the U.S. market, as well as the more limited sector availability, the effect of the ECB’s QE programme has been greatly magnified compared to the Fed’s earlier programmes.
Chart 3: Planned annual ECB purchases vs Historical Issuance, € billion
Source: Haver, European Central Bank, Federal Reserve
Chart 4: Investment Grade Quarterly Net Issuance, € billion
Source: JP Morgan
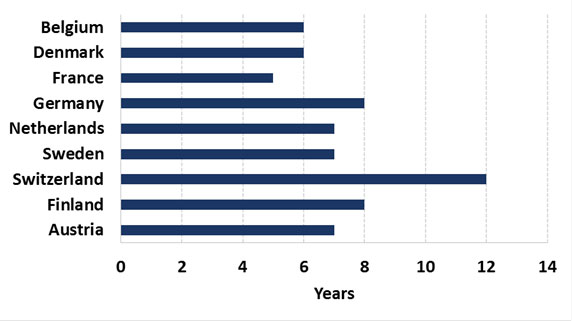
With negative yields the usual rules of “financial gravity” have been suspended. Institutions are now being charged to leave money in a bank current account. In Denmark, some mortgage loans are being negotiated with negative interest rates. The bonds of nine European sovereigns are trading at negative yields with maturities ranging from 4 to 12 years (see Chart 5 below).
The total universe of Euro Area sovereign bonds trading with a negative yield was €1.4 trillion as of April 2015 or 30% of the BofA Merrill Lynch Euro Government Index.
Chart 5: European Sovereigns Trading With Negative Yields
Source: Bloomberg
In this Quick Takes we explored the background to these exceptional times for Euro Area bond investors. In our next issue, we will further explore the implications of these negative yields for Euro Area investors with a focus on insurance companies.
“Negative Yields” – An Illustration
We can look at a real example of a German Government Bond as follows:
|
Issuer |
Germany |
|
Coupon |
3% Fixed |
|
Maturity |
04 July 2020 |
|
Currency |
EUR |
|
Rating |
AAA |
|
Issue Date |
20 April 2010 |
This bond was issued to the market by the German Debt Agency in April 2010 as a fixed rate 10-year bond with a coupon of 3% and an issue price around 100 (par) to yield approximately 3% to maturity. The yield to maturity of a bond is a function of its cash flows (coupons and maturity value), the timing of those cash flows and most importantly its price, which fluctuates on a continuous basis. The following table shows the actual traded yield on this bond for actual prices for various random trading dates over the last years:
|
Trading Date |
Bond Price |
Yield |
|
26 Aug 2010 |
107.612 |
2.133 |
|
04 Nov 2011 |
110.893 |
1.638 |
|
19 Sept 2012 |
113.165 |
1.215 |
|
26 Feb 2014 |
113.17 |
0.856 |
|
08 April 2015 |
116.455 |
-0.13 |
The table shows the importance of price in determining the yield on a bond. In this case, the bond as of 08 April 2015 at a price of 116.455 was offering a yield to maturity of -0.13%. Remember the bond will pay an annual fixed coupon of 3% but it will also mature in April 2020 at a par value of 100 against the current price of 116.455. In other words, if an investor purchases this bond at the given market price of 116.455 and holds it to maturity, he/she will lock in a guaranteed loss on the bond.


