
EXECUTIVE SUMMARY
This issue of Perspectives explores S&P’s proposed overhaul of its risk-based capital (RBC) model and methodology for insurance companies, and some of the implications for insurer investment strategy. The last update of this significance by S&P to its capital model was over 10 years ago, so the update is timely. The proposed changes are designed to enhance global consistency, improve risk differentiation, reduce unnecessary complexity and increase transparency. At first glance, the proposed changes seem largely appropriate, but there are some interesting findings worth mentioning.
- High quality rated bonds not rated by S&P may be treated as lower quality rated bonds for
capital charge purposes. - Aside from those rated AAA/AA by S&P, structured securities generally carry the highest
charges relative to all other bonds and loans. - Lower credit quality bonds garner higher charges than longer maturity bonds all else equal.
- The confidence levels used for capital charge calibration are well north of any other RBC
model we have seen for insurance companies.
Yet the overall model framework is intuitive. Despite the changes, we do not see obvious
directional influences on typical P&C insurer investment choices currently. However, those
insurers with atypical exposure to bonds and loans not rated by S&P or lower rated structured
finance assets may find significant changes in their required capital under the proposed S&P
RBC framework.
Key Structural Changes to Investment Capital Charges
The proposed model changes are vast with updates to several facets of the existing model.1 This includes available capital and risk capital calculations across insurance risks, investment risks and other operational risks. Four different confidence levels of 99.5%, 99.8%, 99.95%, and 99.99% will replace the four different letter rating levels (confidences) of BBB (97.2%), A (99.4%), AA (99.7%), and AAA (99.9%).
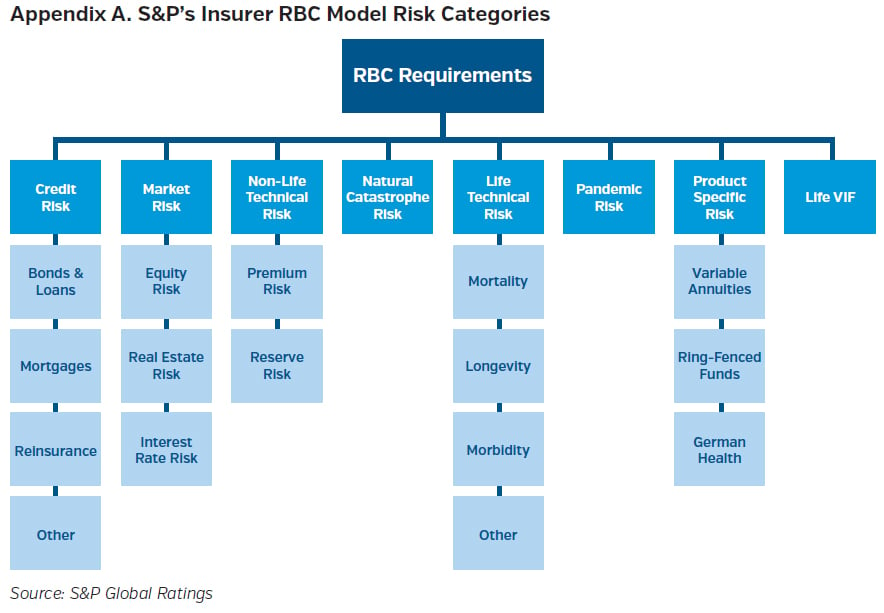
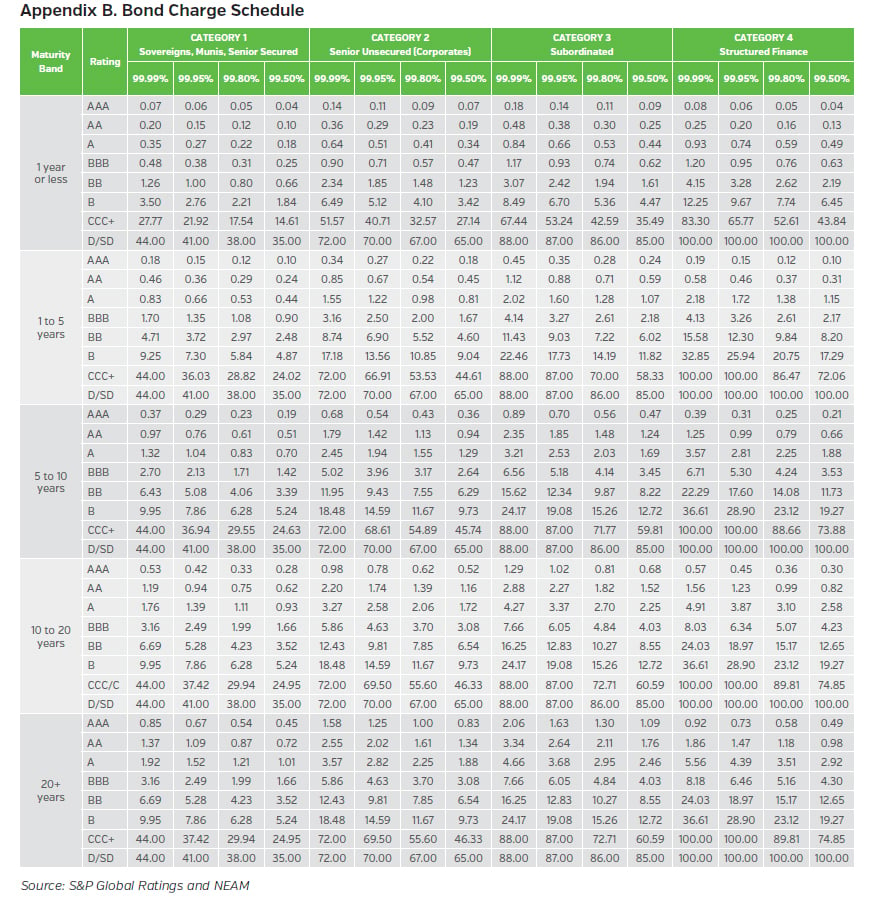
Our discussion focuses on fixed income (non-mortgage loans) credit risk. This is classified into one of four categories: 1) sovereigns, municipals and other senior secured bonds and loans; 2) senior unsecured bonds and loans; 3) subordinated bonds and loans; and 4) structured finance (see Appendix B for the schedule of proposed bond credit charges). Mortgage loans are categorized by loan type, loan-to-value percentage, if a loan is in good standing, etc.
Diversification is captured via correlation matrices at three levels: 1) within the business lines; 2) within risk categories (e.g., four credit risk types); and 3) between risk categories (e.g., credit risk vs. market risk vs. natural catastrophes vs. etc.). There is no geographical diversification credit. The flat 50% haircut to diversification in the legacy model no longer applies, replaced by a sliding scale of diversification stresses. It is not clear how those stresses would impact final RBC calculations.
Notable Differences in Charges
We focus on how the proposed fixed income credit risk charges compare to each other.2 Specifically, we focus on types of conventional bonds and loans since these usually account for a super majority of invested assets for P&C insurer portfolios. Future articles may explore other investment-related charges once all charges are finalized within S&P’s model update.
S&P classifies bonds and non-mortgage loans across one of four categories. Highly secured bonds and loans – e.g., sovereigns – are in category one (Cat1) and have the lowest credit risk charges for a given maturity and confidence level. Senior unsecured and subordinated debt fall within categories two (Cat2) and three (Cat3), respectively, and have progressively higher charges relative to Cat1. However, this progression is not uniform for structured finance, category four (Cat4). Cat4 has lower charges than Cat2 and Cat3 for AAA/AA rated bonds, but have the highest charges for any A and below rated bonds.3 Interestingly, when a bond or loan is not rated by S&P it may be classified as a “CCC” rated bond for capital charge purposes, assuming an equivalent S&P rating translation cannot be determined by S&P. Even if a bond is highly rated by another credit rating agency, such as Fitch or Moody’s, it may be subject to downward notching up to three notches for capital charge purposes if the bond is not rated by S&P. We wonder if this presents a conflict of interest.4
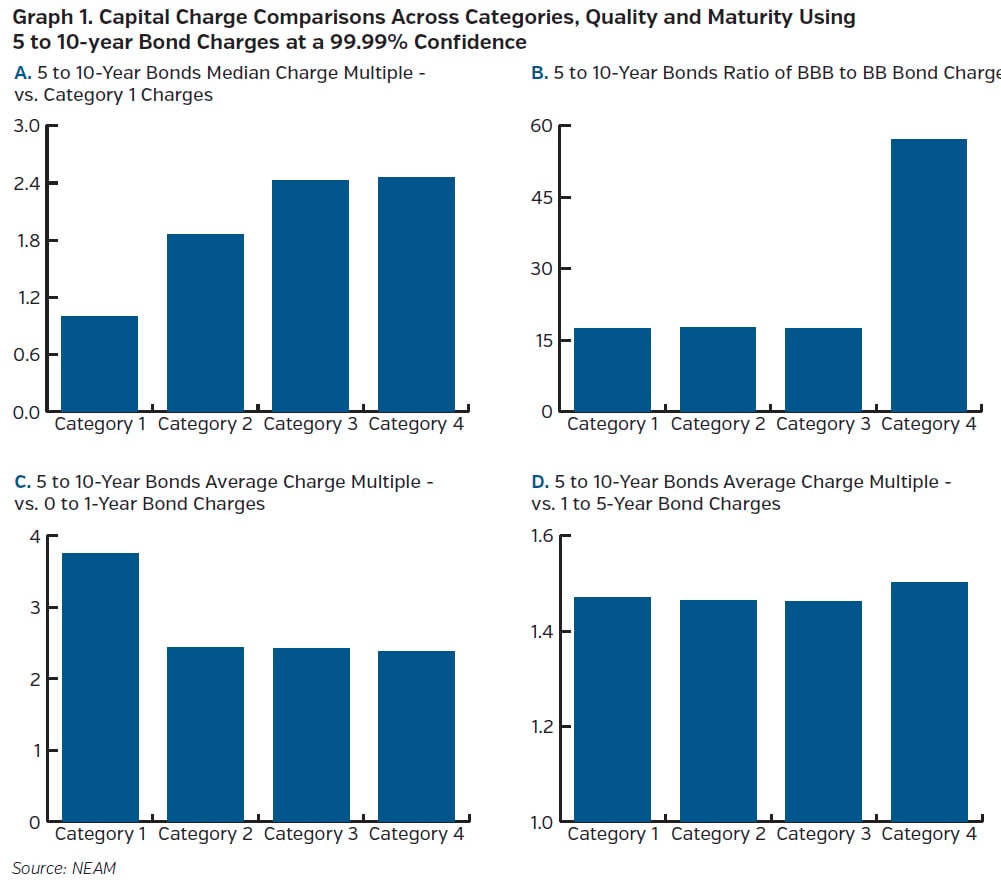
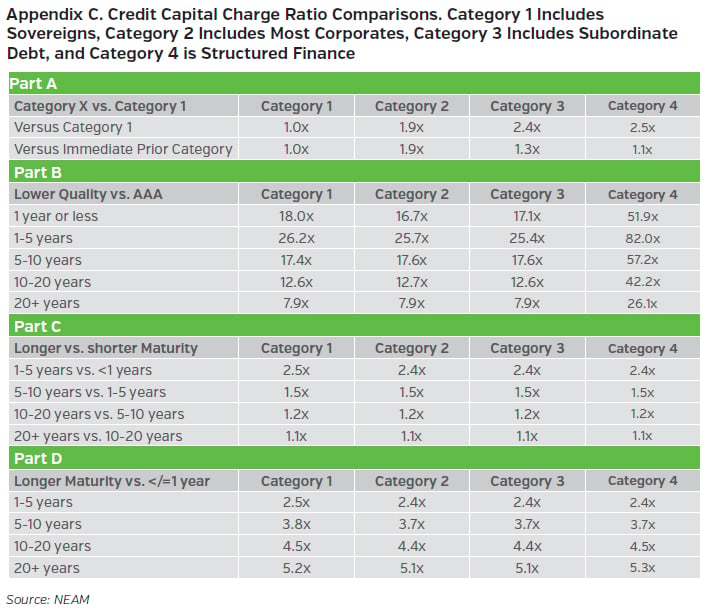
We assess how credit risk charges progress as you move along multiple dimensions: category, credit quality and maturity. We use the most onerous charge listings at the 99.99% confidence for the analysis and highlight the middle 5-10 year maturity band. Graph 1 shows four charts. Each chart shows bars that represent the median or average charge as a multiple of baseline. This illustrates to what degree charges increase as you change categories, reduce credit quality or increase maturity. Graph 1, Chart A, shows that generally as you move from Cat1 to Cat4 the charges increase. Cat3 and Cat4 median charges are about 2.5 times higher than Cat1 charges. Graph 1, Chart B charges shows the increase in charges as you go from BBB to BB at each maturity range and each category. Cat1-3 charges each increase by about 17-18 times as you go down in credit quality. Cat4 (structured finance) charges increase by almost 60 times.
Graph 1, Chart C and Chart D shows how charges change as maturity levels increase. Graph 1, Chart C shows how the 5 to 10-year bond charges compare to the 0 to 1-year bonds on average. Cat1 5 to 10-year charges increase by an average 3.8 times versus Cat1 0 to 1 bonds, and Cat 2-4 each increase about 2.4 times in their categories. Graph 1, Part D is similar to Part C, but instead compares against the immediate prior 1 to 5-year maturity band. Each category increases similarly with a slight edge to Cat4 bond charges. Appendix C has a table showing how all the charges in Graph 1 compare across all maturity bands.
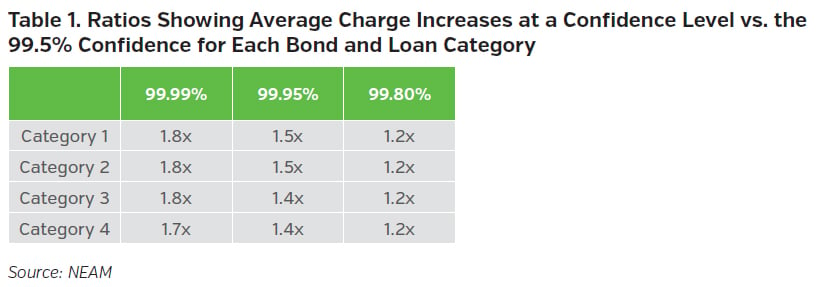
Next, we looked at how credit risk charges change on average as you increase confidence levels. We take the average ratio of charges for the 99.99%, 99.95% and 99.80%, respectively, against the 99.50%. Table 1 shows that the credit risk charges increase in a similar fashion across all four categories as confidence levels increase. For instance, charges for Cat1 bonds at the 99.99% confidence are on average about 1.8 times higher than charges at the 99.5% confidence, and at the 99.80% confidence each category increases by 1.2 times.
Impacts to Insurer Investment Portfolios
Next, we assess the potential impact that the proposed capital charges could have on an insurer’s investment strategy. We assume an insurer is capital constrained. Therefore, capital-at-risk is a key influence on portfolio sector, credit and duration characteristics, as well as optimal risk and return opportunities. NEAM’s Enterprise Based Asset Allocation™ (EBAA™) methodology is used to estimate the impact of the proposed capital charges. EBAA is a holistic approach to identify optimal enterprise risk and return opportunities, given joint considerations of insurance and investment performance and interaction. Figure 1 illustrates the DuPont Return on Equity (ROE) decomposition that EBAA risk and return optimization is predicated upon.

To assess insurance risk and return, we use the U.S. P&C industry’s net premium volume across personal, commercial and accident and health groups, and their associated combined ratios based on available statutory data through year-end 2020. Attritional and catastrophe risk estimates for these three groups are based on 20 years of history statutory combined ratio data. The baseline asset allocation ranges for the “current” scenario are like most P&C insurance companies that partner with NEAM, but with potential for enhancement. This hypothetical portfolio is as of December 31, 2021. Asset return and risk estimates are based on available 20+ years of historic daily return data through year-end 2021.5 Capital, premium-to-surplus (~0.7 times), and invested assets-to-surplus (~2.2 times) are based on statutory data for the U.S. P&C industry as of year-end 2020. We assume capital charges for preferred stock are equivalent to Cat3 bonds. For bond funds, hedge funds, and private equity funds, we use U.S. common equity charges. All other assets within the opportunity set, including existing holdings, receive the appropriate charges outlined in the prior section. ROE is defined in Figure 1. Risk is measured through Tail Value-at-Risk (T-VaR), an estimate of potential loss of capital under highly adverse, low probability downside loss conditions. We assume a 99.5% level of confidence for the T-VaR estimate.
When we apply the EBAA analytical framework we can develop an enterprise efficient frontier, a curve upon which are optimal combinations of invested assets and underwriting products that provide the highest level of expected ROE for a given level of risk. We include eligible assets and apply reasonable constraints.6 We use 99.5 T-VaR as a percent of capital as the risk measure in this example. For this illustration we presume a preference to enhance incremental ROE, while keeping enterprise risk at or below existing levels. These factors combined with the parameters above help shape the solid green efficient frontier shown in Graph 2. The dashed grey line represents the calculated S&P proposed 99.99% confidence credit risk and market (equity) risk capital charges as a percent of capital for any point along the efficient frontier.7 Aside from a dip at lower enterprise T-VaR levels, the capital charge line forms in a similar way to the efficient frontier.
Three choices are highlighted on the efficient frontier on Graph 2. Option A, the light blue diamond, shows a portfolio’s investment capital charges optimized to the current portfolio using the proposed model’s 99.99% confidence charges. Option B, the green triangle, shows a portfolio optimized to match the capital charges of the current portfolio using the legacy model’s AAA level charges. Option C, the dark blue square, shows a portfolio optimized to the current enterprise 99.5 T-VaR level.
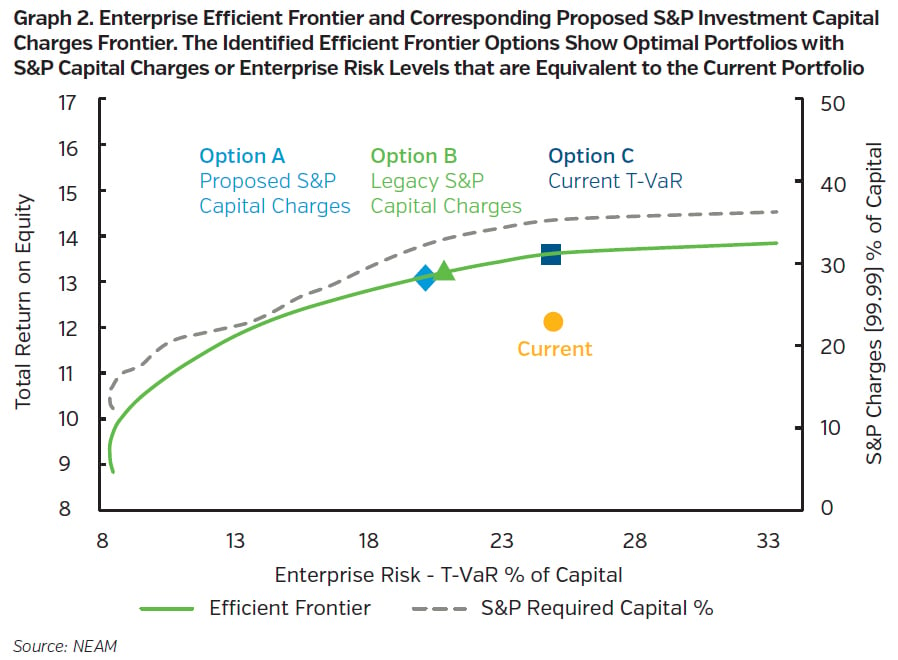
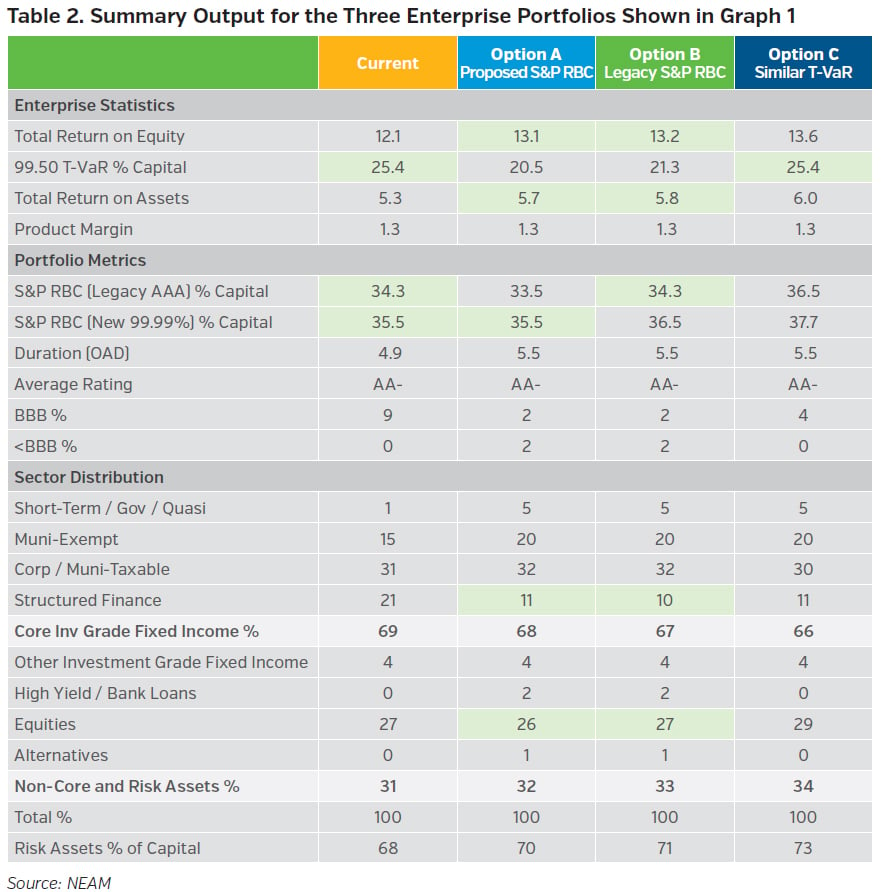
Table 2 provides summary output and allocation outcomes8 for the efficient frontier points shown in Graph 2. Under Options A and B significant sector reallocation of the portfolio due solely to changes in S&P’s capital model are not obvious when compared to the risk and capital charges of the current portfolio. This is partly due to the moderate duration, high quality, AA- average rating and reasonable risk asset percentage of the current portfolio. Option C shows that an optimization focused only on S&P capital charges may overlook subtle opportunities that an enterprise-based optimization and allocation could present. However, to the extent a meaningful percentage of a firm’s existing bonds are subjected to negative notching by S&P, this could motivate substantial security-level turnover within the sectors shown in any of the options in Table 2, even if the sector totals stay the same.
Key Takeaways
S&P’s proposed risk-based capital model update for insurers appears more intuitive and harmonized in its design, notwithstanding some interesting takeaways we found in this initial review:
- Confidence levels for their factors are much higher, and perhaps more punitive, relative to other RBC modeling frameworks.
- Structured finance is viewed favorable to other credit spread assets at the AAA/AA level, but are severely penalized at any rating below AA.
- Sometimes S&P requires an S&P rating for bonds and loans to get the corresponding rating risk charge, even if that rating is from other reputable credit rating agencies, such as Fitch or Moody’s. We are concerned about a potential conflict of interest or bias with this requirement.
- The proposed capital charges increase overall required capital, but do not suggest significant changes in optimal investment strategies are inevitable, notwithstanding security-level purchases with bonds not rated by S&P or structured finance credit rated below AA.
At the time of this writing, the response period to the proposed capital model change ends on April 29, 2022 (after multiple extensions). Similar updates from other agencies have taken over a year to become effective once announced. NEAM will continue to follow these developments. We suggest against near-term directional investment allocation adjustments due to changes in the model alone until the model is finalized and the implementation date is known. Until then NEAM suggests utilizing a holistic approach to (re)evaluate risk and return opportunities for the enterprise. This includes assessing implications to economic, solvency and RBC requirements.
Appendix
ENDNOTES
1 Readers are encouraged to read “Criteria | Insurance | Request for Comment: Insurer Risk-Based Capital Adequacy--Methodology and Assumptions,” Standard & Poor’s, December 6, 2021 for a full discussion on the proposed changes.
2 The confidence levels across the charge schedules are completely different and higher for each charge level in the new model versus the prior model. We expect charges to increase as confidence levels rise in the calibration process (all else equal). Therefore, we felt a more useful endeavor would assess how charges evolve across different characteristics within the proposed model instead of relative to the prior model.
3 This is not a surprise in our view given the highly collateralized nature typical of structured securities at the AAA/AA level.
4 Our concerns were echoed by the NAIC who voiced their concerns to Congress regarding these other facets of the S&P’s proposed capital model update.
5 We use daily return data as available across 100s of I.C.E. BofA Global Indices to proxy historic returns, volatilities and correlations for a broad range of asset types. Certain indices have limited data (e.g., private equity), and we make reasonable adjustments in those instances to formulate a comparable time series for risk and return estimation.
6 Some example constraints include maintaining existing average credit quality of AA-, duration kept between 4.5-5.5 years, no more than 50% turnover, and caps and floors on certain sectors to limit outsized sector exposure and concentrations. These assured portfolio outcomes were in ranges NEAM often sees with U.S. P&C insurer investment portfolios.
7 We ignore any S&P diversification in the S&P charge calculations given the lack of clarity to how the net result of diversification will be applied by S&P.
8 Historic market rates, spreads and returns were used to estimate investment risk-adjusted return opportunities in this analysis. Prevailing risk-adjusted returns are much different than these historic estimates, so by no means are the outcomes illustrated meant to indicate any recommendation or advocation by NEAM.
NEAM’s portfolio management tools utilize deterministic scenario analysis in the illustrative examples herein to provide an estimated range of returns, T-VAR, capital charges and other metrics based on certain assumptions. NEAM makes no representation or warranty as to the reasonableness of these assumptions. The projections shown do not reflect potential capital charge changes, the effect of material economic and market factors or any company specific considerations and should not be regarded as a recommendation of any specific security or investment strategy.


