
2020 in Review
2020 proved to be “one of those years.” A global pandemic wreaked havoc around the world and left many lives and livelihoods in its wake. Historic fiscal and monetary policy measures were taken to keep a very dire situation from completely upending the global economy. In the aggregate, the policies were effective and the economic damage was reasonably well contained, despite the massive disruption and heartache caused by COVID-19.
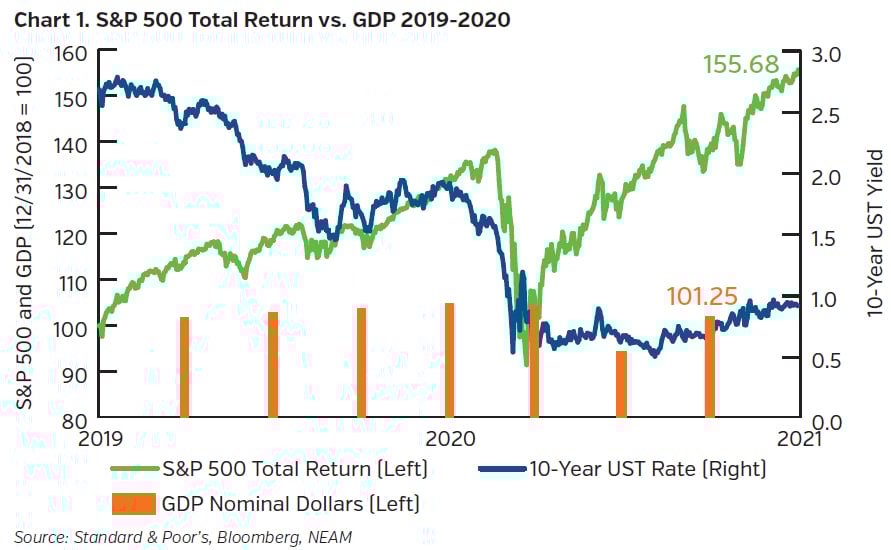
As what has now become the customary response whenever there is some sort of crisis, in 2020 the Federal Reserve, ECB and central banks across the globe flooded the financial system with liquidity so that in an awful year for both people and corporate profits, the S&P 500 returned nearly 18%. Even more stunning–and maybe a little frightening–is that the cumulative return on the S&P 500 for 2019 and 2020 combined is 55+% without a significant prior drawdown!
One might find this outcome surprising given the previous anxiety around protectionism, trade wars, tariffs, Brexit, and a global pandemic that has taken two million lives and roiled economies around the globe. But what may at first glance be counterintuitive makes perfect sense when the thought process is reduced to simple math. By having zero or negative short rates, providing unlimited liquidity to financial markets, and by delving into the purchase of corporate credit and even stocks in the case of Japan, the “mission creep” that has permeated central banks was on full display in 2020. While this torrent of liquidity was not the sole explanatory factor behind capital market performance, it was certainly the most impactful.
Extraordinary times call for extraordinary measures, but when the “extraordinary” becomes both ordinary and expected, then very strange things can happen. The mission of ensuring price stability and full employment has evolved (or more accurately devolved) into de facto support for financial assets. A certain amount of this was necessary in 2020, as a collapse in asset values can do long lasting economic damage. That said, no investor should regret the expiration on December 31, 2020 of many of the “section 13-3” lending programs that the Fed established during the pandemic to support credit markets. Upon learning of the expiration of these programs, the reaction of the Fed was interesting, but not surprising. Fed governors were clearly flummoxed by Treasury’s decision. Perhaps it was because they thought the programs could still be helpful in some way, even though the peak of the crisis has most certainly passed, at least as far as economic impact. On the other hand, it’s possible that the Fed didn’t like the idea of losing even one of the “superpowers” in its now enormous quiver. In either case, U.S. and/or Global GDP have certainly not risen materially since the beginning of 2019, but central bank balance sheets have, as these price insensitive buyers unleash more liquidity than is required, push rates lower and drive credit spreads tighter. Put it all together and voila! A 55% return on the S&P 500 in 2 years, when cumulative U.S. GDP growth has been more or less flat (see Chart 1).
The purpose of this brief note is not to discuss the mission creep of central banks, but we can’t ignore it. It is an important factor (in fact, THE most important) in considering actual financial asset returns for 2020 vs. what many, including us, predicted for last year. Our base case was that U.S. P&C fixed income total returns would be somewhere in the neighborhood of 2% given starting yields and the assumption of modest upward drift in rates. This modest upward drift was logical at the time, since central banks were once again easing, the U.S./China trade war had simmered down, and a smooth Brexit seemed a chip shot away.
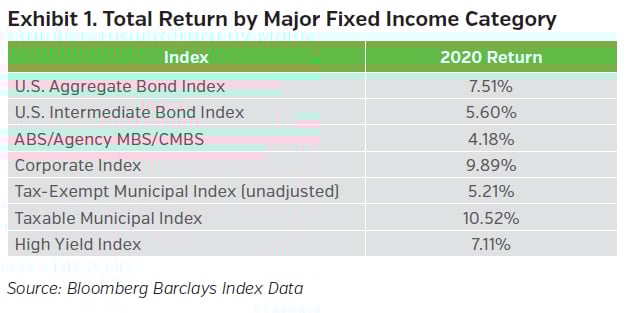
The pandemic completely changed the story line and as a result, our projection widely missed the mark. Rates in the U.S. and U.K. were dropped to zero again and the ECB and Japan maintained negative rates. Along with the previously mentioned lending programs, central bank balance sheets exploded higher as monetary authorities committed to open ended quantitative easing in order to ensure proper functioning of credit markets. When all was said and done, total returns for 2020 by broad U.S. fixed income sector (using Bloomberg Barclays Index data) were as follows in Exhibit 1.
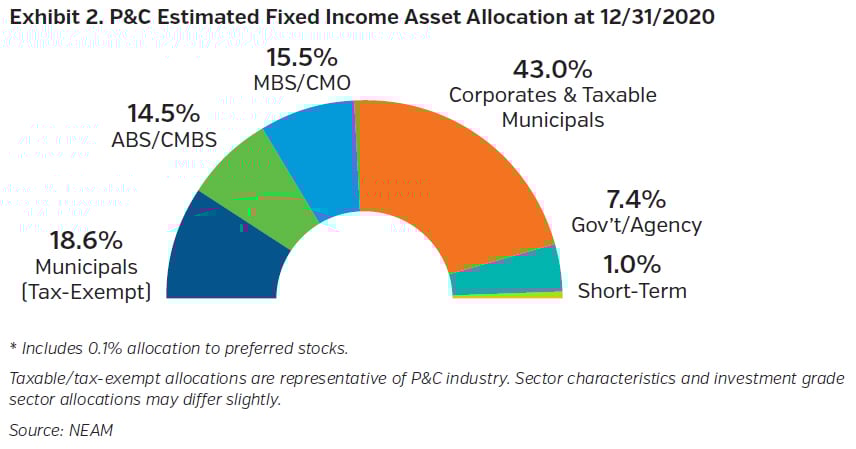
Given our estimate of asset allocation within the P&C industry, we estimate that fixed income total returns in 2020 were in the 6.50% - 7.00% range – an excellent outcome compared to our pre-pandemic guesstimate of 2.07% +/- 1.60%.
2021 Outlook
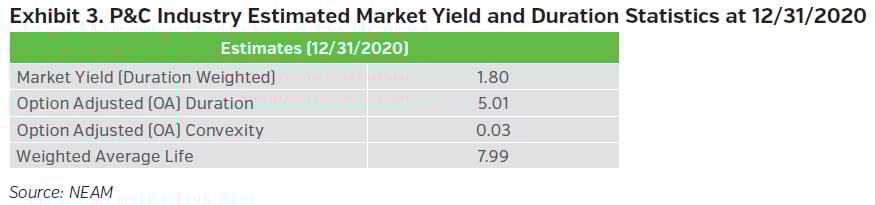
The good news is that the aforementioned total return posted in 2020 far eclipsed what many thought was likely. The bad news is that the yield on the Bloomberg Barclays Aggregate as we begin 2021 is more than 100 bps lower than it was at this time last year. At December 31st 2020, it sported a market yield of 1.13% (vs. 2.31% at year-end 2019).
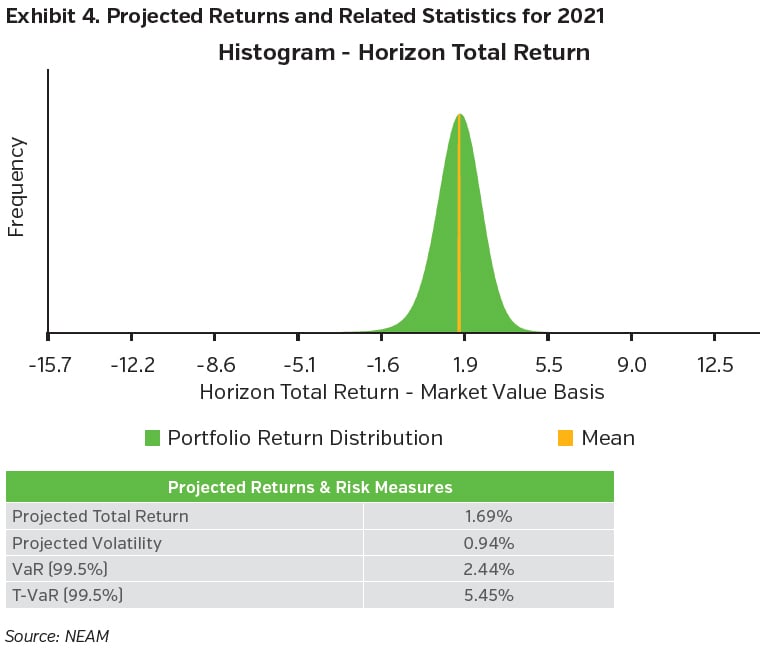
Below is our estimate of the P&C industry’s risk profile at year-end 2020, along with a summary of our projected returns for 2021.
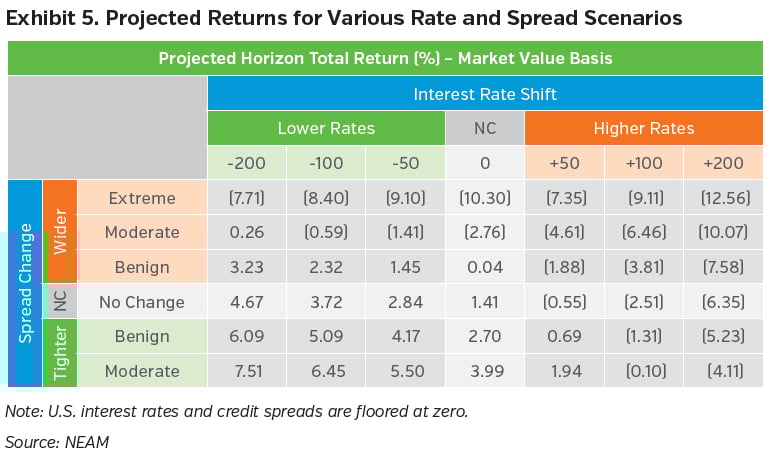
While 2020 was full of surprises, we’d expect 2021 to look more “normal.” With rates as low as they are and spreads now as tight as they are, it’s difficult to envision a scenario where bonds can continue to put up mid to high single digit returns, as is indicated in Exhibit 5 above.
Our estimate for 2021 points to a fixed income return of approximately 1.7%. The relatively low volatility around that estimate presupposes that the Fed and other central banks will keep their thumbs on the proverbial scale. If the Fed eventually gets its wish for 2%+ inflation on a sustained basis, one of these years we will be projecting a negative rate of return for bonds. That is, of course, if central bankers see fit to allow markets to find their own levels, once the latest crisis has passed.
Key Takeaways
- 2020 Fixed Income returns for the P&C Industry were likely in the 6.50% - 7.00% range
- Central bank liquidity has provided rocket fuel for financial asset returns in both 2019 and 2020
- Fixed Income returns in 2021 should be much lower, given the level of both spreads and interest rates
- The Fed is likely to keep pumping liquidity into the market throughout 2021, so despite our outlook for very modest returns, it seems likely the sheer amount of liquidity will dampen volatility
- Given rates and spreads, we have trimmed our risk position after aggressively adding to spread duration in 2020. We will revisit our risk positioning to the extent we see a meaningful change in rates (possible) or a meaningful change in spreads (not likely)
Please note that past performance is not indicative of future results. Expectations for 2021 are based on our capital market assumptions and are subject to change.
Estimates of P&C industry fixed income sector allocations and market yield and duration statistics in Exhibits 2 and 3 factored in year-end 2019 S&P Global Market Intelligence data and other more recent market proxies. For Exhibits 4 and 5, return projections are based on a portfolio designed to resemble our aggregate P&C fixed income universe estimates. We assume numerous interest rate and spread environments. These returns are then probability weighted based on our firm’s capital market views (i.e. outlook for global growth, U.S. growth, central bank policy, fiscal considerations, etc.), which influences the expected level of returns and the distribution of those returns. Using statistical techniques, we create a distribution of returns which we then use to quantify portfolio risk and return. NEAM’s portfolio management tools utilize deterministic scenario analysis to provide an estimated range of total returns based on certain assumptions. These assumptions include the assignment of probabilities to each possible interest rate and spread outcome. We assume a 12 month investment horizon and incorporate historical return distributions for each asset class contained in the analysis. These projected returns do not take into consideration the effect of taxes, changing risk profiles, operating cash flows or future investment decisions. Projected returns do not represent actual accounts or actual trades and may not reflect the effect of material economic and market factors. Clients will experience different results from any projected returns shown. There is a potential for loss, as well as gain that is not reflected in the projected information portrayed. The projected performance results shown do not represent the results of actual trading using client assets but were achieved by means of the prospective application of certain assumptions. No representations or warranties are made as to the reasonableness of the assumptions. Results shown are not a guarantee of performance returns. Please carefully review the additional information presented by NEAM.


