
2019 in Review
Wow. 2019 turned out much different than many investors thought, including us. As we entered 2019, we were faced with protectionist rhetoric, trade angst and a Fed that had begun backpedaling away from their tightening bias. In Europe and the UK, the politics of Brexit continued to stoke concern about the eventual impact on both constituencies. Despite all of this uncertainty, interest rates on sovereign debt were higher at the beginning of the year than they are now, even though progress has been made on the factors noted above and things are now at least somewhat more settled.
While many investors knew full well that the Fed would eventually change course, the speed with which they changed their tune was stunning. The FOMC was clearly rattled by the swoon in stock prices that occurred in Q4 of 2018, culminating in a washout on Christmas Eve. Soon after that, the central bank did a complete u-turn, referencing heightened trade and global risks. That reversal put a floor under equity prices and prompted the markets to reduce the odds of a Fed induced recession. Additionally, despite the high-pitched squeals in response to proposed additional tariffs on China, around mid-summer 2019, the Trump administration began to signal their desire to get something done on trade. The rest, as they say, is history.
During the course of 2019, 10-year Treasury yields declined by ~75 bps as yields shifted lower all across the curve. The hawk-turned-dovish Fed, the resumption of quantitative easing in Europe along with a further reduction in the ECB deposit rate (further into negative territory) contributed to the global reversal in yields. Equities had a banner year with lower rates driving multiple expansion and propelling the S&P 500 higher by over 30%.
In an environment where yields dropped as significantly as they did, one would have expected weaker economic conditions to drive credit spreads wider. Instead, the thirst for yield once again became unquenchable and spread products of all kinds tightened despite global growth that was demonstrably slower. To be sure, our forecast did not predict that rates would move significantly higher, but we certainly didn’t predict that 10-year Treasury rates would be cut in half (at one point). Also, this outcome combined with tighter spreads is a scenario that is at the very least somewhat contradictory. Hence, we did not put a high probability on this outcome. Instead, our projections contemplated rates that were (at most) a bit higher but more importantly, we suspected the unfolding global slowdown would cause spreads to widen somewhat. Instead, bond investors got the best of both worlds as the scramble for yield globally had investors reaching for whatever yield they could find. As such, after several good years, our return estimates for 2019 were significantly off the mark. To review, our projected fixed income return for 2019 was 1.99% with a standard deviation of 1.86%.
As we wrap up the year, here are the actual return figures for 2019 broad market indicies:
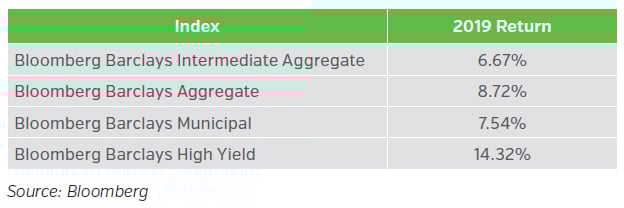
Given the approximate asset allocation within the P&C industry at the beginning of 2019, we estimate that investment grade fixed income returns were approximately 8.5% for the year.
While our spread assumptions were reasonable enough, we did not ascribe a high probability to long rates dropping as much as they did. While this may not make sense given the fact that the U.S. economy continues to perform reasonably well, the fact is that rates around the world remain extremely low or even negative. Hence, unless we get a sustained reflationary impulse, Central banks should keep the throttle open.
Needless to say, these total return figures are welcome as they boost enterprise value. After a brief period of relief, however, we are once again relegated to yields that are relatively uninspiring. There are two sides to each coin, however, and yields that look uninspiring to us here in the U.S. are simply frothy for investors in Europe or Japan. Hence, the demand for bonds, even at greatly diminished yields, continues unabated.
Outlook for 2020
Our interest rate outlook for 2020 is that while there may be a bit of upside from current levels, it seems likely that rates will remain fairly well anchored. Additionally, the central bank largesse that has supported financial assets for 10 years is poised to continue until such time as inflation makes a comeback. The Fed has said exactly this and while the sentiment is understandable, it certainly feels like a case of be careful what you wish for. For now, the odds of a recession in 2020 are certainly lower than they were at this time last year but the expansion (already the longest on record) is also one year older.
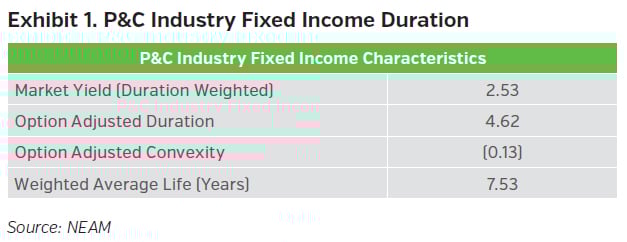
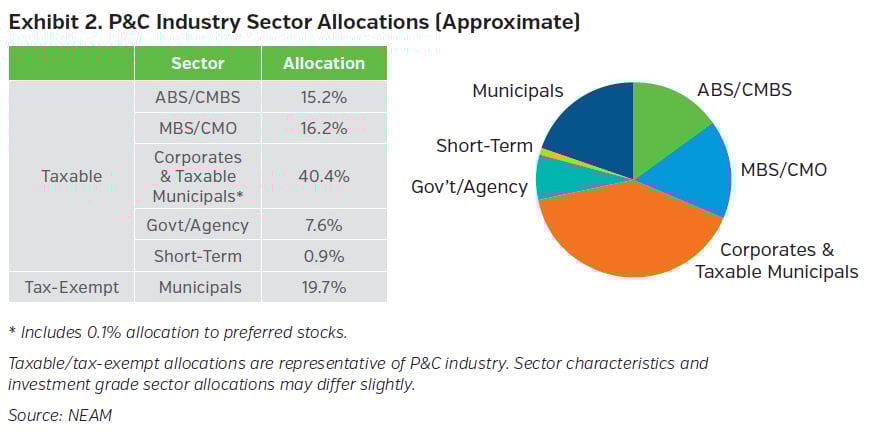
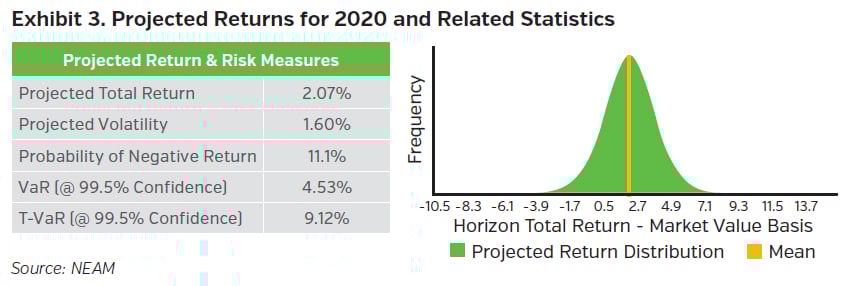
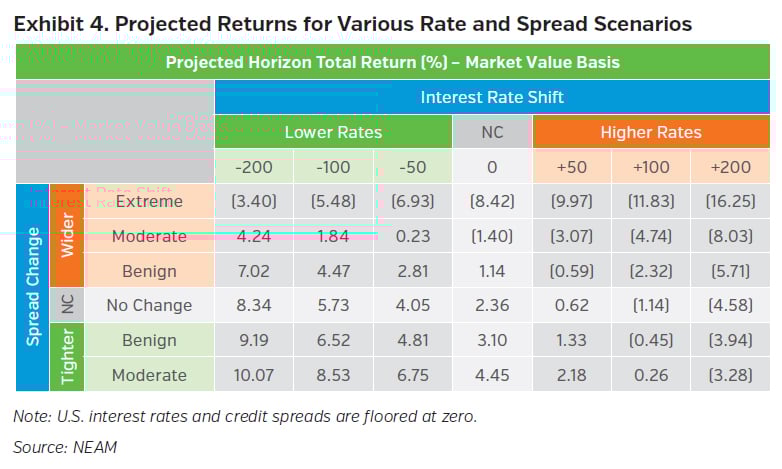
With this as the backdrop, here is our approximation of the property and casualty industry profile (Exhibit 1 and Exhibit 2), along with our return estimates for the industry for 2020 (Exhibits 3 and 4).
KEY TAKEAWAYS
- We believe fixed income returns for the P&C industry will be subdued this year with our estimate roughly 2%.
- That said, the Fed seems to have stated its intentions fairly clearly – no rate rises until and unless we get a sustained rise in inflation. We shouldn’t rule this out by any means but the probability of this happening over the next twelve months seems relatively low.
- We’d be surprised if volatility didn’t pick up given the election cycle in the U.S. though, so while there may not be a substantial change in the level of rates, there may very well be a little more “two-way traffic” than we had in 2019.
- In any case, markets have a way of humbling investors and 2019 was a good example. The markets zigged then zagged and we wrapped up the year having experienced an impressive rally. This year we will be back at work trying to extract as much yield as we can after having enjoyed an altogether too brief period of higher yields.
Please note that past performance is not indicative of future results. Expectations for 2020 are based on our capital market assumptions and are subject to change.
Estimates of P&C industry fixed income duration characteristics and sector allocations in Exhibits 1 and 2 factored in year-end 2018 S&P Global Market Intelligence data and other more recent market proxies. For Exhibits 3 and 4, return projections are based on a portfolio designed to resemble our aggregate P&C fixed income universe estimates. We assume numerous interest rate and spread environments. These returns are then probability weighted based on our firm’s capital market views (i.e. outlook for global growth, U.S. growth, central bank policy, fiscal considerations, etc.), which influences the expected level of returns and the distribution of those returns. Using statistical techniques, we create a distribution of returns which we then use to quantify portfolio risk and return. NEAM’s portfolio management tools utilize deterministic scenario analysis to provide an estimated range of total returns based on certain assumptions. These assumptions include the assignment of probabilities to each possible interest rate and spread outcome. We assume a 12 month investment horizon and incorporate historical return distributions for each asset class contained in the analysis. These projected returns do not take into consideration the effect of taxes, changing risk profiles, operating cash flows or future investment decisions. Projected returns do not represent actual accounts or actual trades and may not reflect the effect of material economic and market factors. Clients will experience different results from any projected returns shown. There is a potential for loss, as well as gain that is not reflected in the projected information portrayed. The projected performance results shown do not represent the results of actual trading using client assets but were achieved by means of the prospective application of certain assumptions. No representations or warranties are made as to the reasonableness of the assumptions. Results shown are not a guarantee of performance returns. Please carefully review the additional information presented by NEAM.


