
Background
The sanguine, steady march higher enjoyed by the equity markets in 2017 and for the better part of the first three quarters of 2018, came to an abrupt end in October. Market sentiment is remarkably fickle and can turn on a dime. With three quarters “in the books,” the S&P 500 was having a more than respectable year, posting returns that were in the low double digits. Then it happened – volatility returned suddenly and with a vengeance.
In the late spring and early summer of 2018, various data was giving an indication that the economic winds might be shifting a bit. Interest rates had risen sharply. Housing activity and prices, which had staged an impressive ascent for over five years, began to slow. Corporate credit spreads, after reaching their tightest levels since the financial crisis, began to widen. The Philadelphia Semiconductor Index, or SOX, stalled out after climbing at a 45 degree angle for an extended period. Oil was buffeted with WTI falling in to the $40’s providing more fuel for investors’ worries.
Then, enter the Federal Reserve which raised the Fed Funds rate by a well telegraphed and very much expected 25 basis points at their December meeting. Their (now infamous) “Dot Plot,” however, revealed that Fed governors, in the aggregate, still projected two additional rate increases for 2019. Chairman Powell was quite clear that these estimates were based on forecasts and that the Fed would be flexible, following no predetermined path. Needless to say though, equity markets, which were hoping for an unambiguous “pause” in further rate hikes, instead received the proverbial lump of coal just in time for Christmas.
A Review of 2018
With regard to interest rates, credit spreads and projected U.S. fixed income returns for the P&C industry, NEAM entered 2018 believing the following:
- The U.S. economy would expand at a pace which was above trend, as fiscal stimulus, lower corporate tax rates and (still relatively) accommodative monetary policy continued to provide support.
- The Federal Reserve would continue to normalize interest rates.
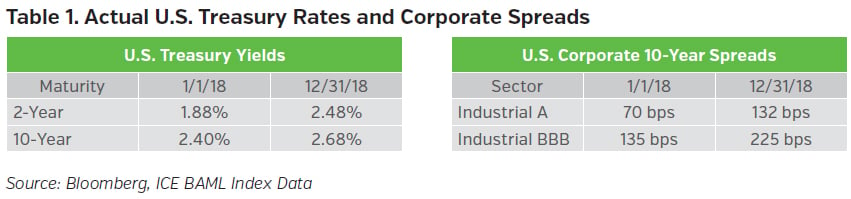
- The U.S. yield curve would flatten and interest rates would rise materially on the front-end of the curve and more moderately on the long-end (see Table 1).
- Corporate earnings would continue to improve, providing credit spreads with an environment where they’d remain steady or tighten further (see Table 1).
- The strengthening U.S. dollar would create some headwinds for U.S. multinationals but tax reform would offset that headwind and then some.
On balance, our underlying interest rate assumptions were correct, though we thought rates would be a bit higher, particularly on the longer-end of the curve. The volatility in risk assets noted above fueled a significant rally in Treasuries during Q4, paring much of the damage sustained earlier in the year. With regard to spreads, we thought they’d remain well behaved given the solid economic backdrop and very low default rates. Hence, spreads widened more than we anticipated. In any case, when taken together, “all in” yields ended the year more or less as we expected, so let’s review our U.S. fixed income return projections for 2018 with this backdrop in mind.
Our projected return for the P&C industry’s U.S. investment grade exposure for 2018 was 1.27% with a standard error of 1.95%. We estimate that actual industry return (IG) for the year was barely positive at approximately 0.25%. If one includes a small allocation to high yield bonds which is representative of the industry, the estimated fixed income return drops to effectively zero. Not at all satisfying!
Our projections for 2018 were once again reasonable, though this time a touch rosy (if +1.27% can be referred to as “rosy”). Our estimated total return assumed moderately higher interest rates, a flatter yield curve and credit spreads that would remain roughly unchanged. Hence, the variance from our projection is largely attributable to wider credit spreads than what we had forecast.
Our Views for 2019
We enter 2019, one year deeper into the economic expansion, at a time when the stimulus from tax reform will begin to wane, the Fed has (largely) normalized short term-interest rates, quantitative tightening continues apace and there is a great deal of skepticism about 2019 with the risk of a recession continuing to rise. Our belief remains that the longer U.S. rates are somewhat lower than they should be, but again, not by much. In fact the ~ 3.25% yield that we saw on 10-year UST just a few months ago was right in the middle of our forecast range at that time. We believe there is still modest upside in interest rates from current levels and we believe the likelihood of wider credit spreads has increased, though this assumption is tempered by the fact that spreads have already widened fairly substantially.
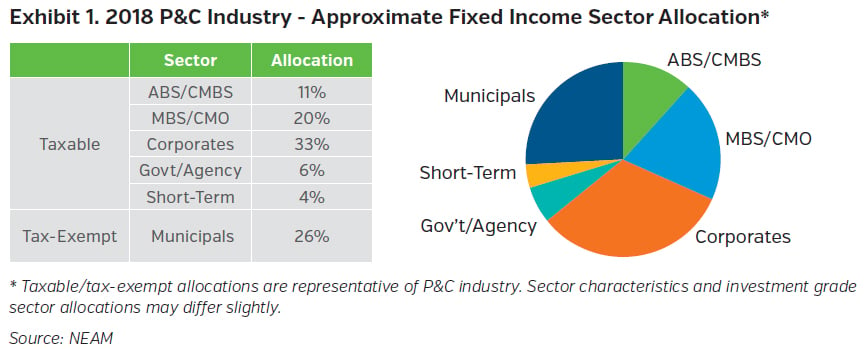
To review our process, we base our return projection on a portfolio of securities which closely resembles the aggregate P&C fixed income universe. We calculate total returns on the aggregate portfolio, assuming numerous interest rate and spread environments. These returns are then probability weighted based on our firm’s capital market views. In this way, our assessment of capital market expectations influences the expected level of returns and the distribution of those returns. The sector allocations of our proxy portfolio are highlighted in Exhibit 1. Of note, our assumed allocation to tax-exempt municipals has dropped materially as lower corporate tax rates have reduced after-tax yield advantage of municipals vis–à-vis taxable bonds. Using this proxy portfolio and our expected return methodology, we’ve calculated total returns across a range of rate and spread scenarios. Those returns are summarized in Exhibit 2 below.
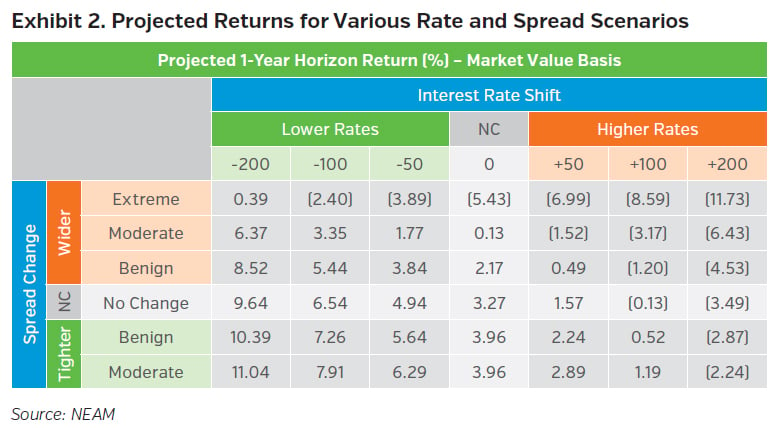
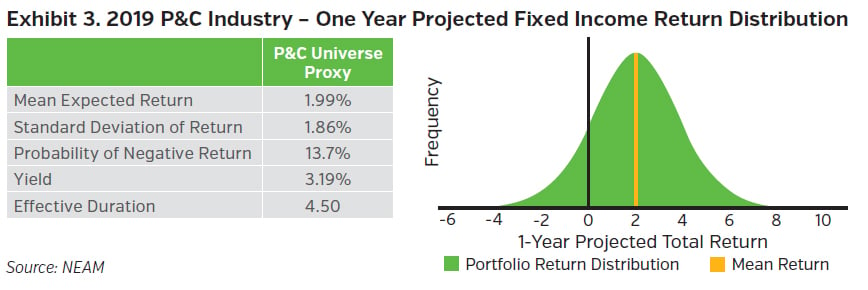
Each of the outcomes calculated in Exhibit 2 are then ascribed a probability based on our outlook for global growth, U.S. growth, central bank policy, fiscal considerations, etc. Using statistical techniques, we create a distribution of returns which we then use to quantify portfolio risk and return. From our work, we derive a mean projected return for U.S. investment grade fixed income in 2019 of roughly 2.00% with a standard error of 1.86%. See Exhibit 3 below.
Conclusions
Estimated P&C fixed income returns for 2018 were largely in line with our expectations. Our base case was for moderately higher rates and a flatter curve. Our credit spread assumptions were a touch optimistic but close enough that our projections landed close to the pin.
With interest rates still historically low, we expect 2019 will once again result in low single digit returns for U.S. fixed income with a somewhat lower probability of a negative total return, owing to the fact that rates have risen and spreads have widened since last year’s forecast. While we don’t see any banner years for fixed income on the horizon, 2019 returns are likely to be a little bit better than in 2018.
Key Takeaways
- We estimate that 2018 fixed income returns for the U.S. P&C industry were roughly in line with our projections, albeit a bit lower as a result of credit spreads widening a bit more than we anticipated, despite solid economic growth.
- The curve continued to flatten in 2018 as the Fed continued to normalize interest rates. For the past several months, we have been preparing for the (inevitable) end of this tightening cycle. Recent events and comments from the Federal Reserve underscore their flexibility as we move forward in 2019.
- We believe U.S. fixed income returns for 2019 will once again land in the (very) low single digit range. Credit spreads have widened and represent roughly fair value. Our expectations are that rates have a little bit of upside from current levels but certainly not much. Additionally, spreads have widened some, so the probabilities of tightening vs. widening are certainly more balanced.
- While we currently maintain a duration that is slightly short of benchmark, the spread widening noted above has made us a bit more constructive on credit spreads in general. While we will save our very aggressive buying for periods of greater stress, we have been extending our (spread) duration using corporates and other spread sectors as we try to take advantage of valuations that are considerably more reasonable than they were at this time last year.
Please note that past performance is not indicative of future results.
Expectations for 2019 are based on our capital market assumptions and are subject to change.
NEAM’s portfolio management tools utilize deterministic scenario analysis to provide an estimated range of total returns based on certain assumptions. These assumptions include the assignment of probabilities to each possible interest rate and spread outcome. We assume a 12 month investment horizon and incorporate historical return distributions for each asset class contained in the analysis. These projected returns do not take into consideration the effect of taxes, changing risk profiles, operating cash flows or future investment decisions. Projected returns do not represent actual accounts or actual trades and may not reflect the effect of material economic and market factors. Clients will experience different results from any projected returns shown. There is a potential for loss, as well as gain that is not reflected in the projected information portrayed. The projected performance results shown do not represent the results of actual trading using client assets but were achieved by means of the prospective application of certain assumptions. No representations or warranties are made as to the reasonableness of the assumptions. Results shown are not a guarantee of performance returns. Please carefully review the additional information presented by NEAM.


