
Background
The first year of the Trump presidency turned out to be a surprise in several ways, but perhaps the most notable was the complacency and lack of volatility that characterized both interest rates and risk asset prices in general. For one fleeting moment after the 2016 election, markets convulsed, but after that moment they haven’t looked back. During the year, NEAM focused on the potential impact on interest rates of four distinct priorities for the new administration:
- Tax Reform
- Trade Agreements
- Affordable Care Act Repeal
- Regulation
While an in depth review of progress on these items is beyond our scope, it is certainly fair to say that the last six months have been more productive than the first six as far as legislative momentum. A pro-growth tax reform package–the first in over 30+ years–has progressed through Congress, albeit on a party line vote. While there hasn’t been an enormous roll back of existing regulation such as the voluminous Dodd Frank Act, the creation and adoption of new regulations has all but stopped. Concerns over trade and protectionist policies, which had been front and center on inauguration day, have quickly faded from view (perhaps shortsightedly) and while the U.S. immediately withdrew from the proposed Trans Pacific Partnership, the saber-rattling over NAFTA has not been terribly disruptive. In sum, significant progress on tax reform and a diminution in the regulatory burden have spurred consumer and business confidence.
A Review of 2017
With regard to interest rates, credit spreads and projected U.S. fixed income returns, we entered 2017 believing the following:- The U.S. economy would continue to expand at a moderate pace, as accommodative monetary policy and low interest rates provided continued support.
- The Federal Reserve would continue to normalize interest rates.
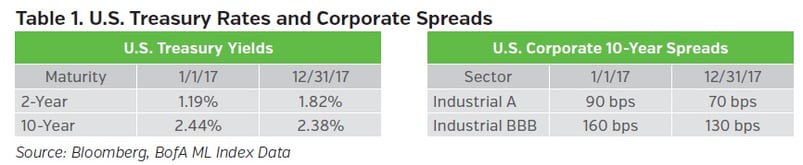
- The U.S. yield curve would flatten and interest rates would rise materially on the front- end of the curve and modestly on the long- end (see Table 1).
- Corporate earnings would continue to improve, providing credit spreads with an environment where they’d remain steady or tighten further (see Table 1).
- The nascent (at the time) talk of tax reform might provide some additional lift to economic growth, albeit oddly timed given the late stage of the economic expansion.
- Tax reform would not have a material (detrimental) impact to tax advantaged securities.
- Some weakening of the U.S. dollar would provide significant cover for emerging markets and would stabilize financial conditions in those countries, thereby reducing the odds that they’d be a source of volatility.
On balance, our underlying assumptions were correct. Like most investors though, we have been very surprised at the (nearly complete) lack of volatility in 2017. Financial conditions are generally favorable and Corporate America is thriving. Any sources of angst which surfaced during the year were generally met with a day or two of concern, followed by a resurgence of the “buy the dip” mentality.
In any case, our overarching assumptions were largely correct, so let’s review our U.S. fixed income return projections for 2017 with this backdrop in mind. Our projected return for the P&C industry’s U.S. investment grade exposure for 2017 was 1.18% with a standard error of 2.74%. We estimate that actual industry return (IG) for the year was approximately 3.20%. If one includes the industry average allocation to high yield bonds of roughly 6% of fixed income holdings, the estimated fixed income return increases to approximately 3.50%.
Hence, our projections for 2017 were reasonable, if a bit too conservative. Our estimated +1.2% total return assumed moderately higher interest rates (+50 bps.) and modestly tighter credit spreads. Our spread assumptions were generally correct. On the other hand, even our moderate upward bias with regard to interest rates proved to be too pessimistic. While our interest rate forecasts were accurate out to 10 years and we positioned portfolios for a flattening yield curve, we did not foresee the long end remaining sanguine, much less rallying. Hence, in attributing the variance of approximately 2% from our projection, about one third of the difference (~67 bps.) is attributable to our rate assumptions on taxables and roughly two thirds (135 bps.) is attributable to our rate assumptions on munis, which in the aggregate actually finished the year at slightly lower yields than where they started, propelled by the “bull flattening” on longer maturities noted above.
Our Views for 2018
For 2018, there aren’t any obvious near term catalysts that would disrupt the ongoing expansion, particularly if we get at least a modest boost from tax law changes. Thus, we continue to believe credit spreads will remain well behaved, but further tightening is less likely in 2018. Additionally, we continue to believe that longer U.S. rates are somewhat lower than they should be, but not by much (in the near term). Our underlying assumptions then, are fairly similar to what they were as we entered 2017, though our curve flattening bias is not as strong as it was at the beginning of the year.
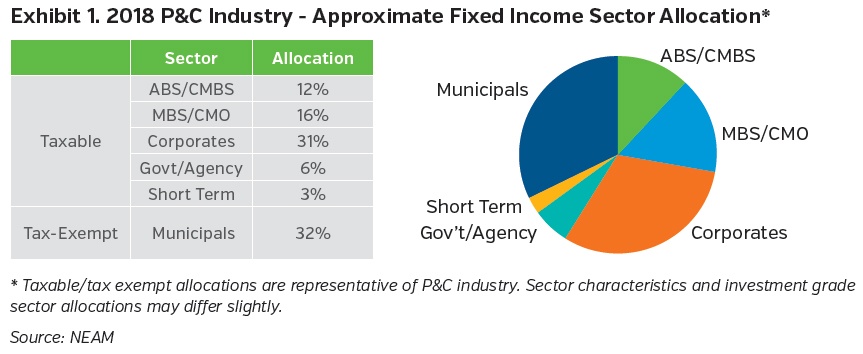
We base our return projection on a portfolio of securities which closely resembles the aggregate P&C fixed income universe. We calculate total returns on the aggregate portfolio assuming numerous interest rate and spread environments. These returns are then probability weighted based on our firm’s capital market views. In this way, our assessment of capital market expectations influences the expected level of returns and the distribution of those returns. The sector allocations of our proxy portfolio are highlighted in Exhibit 1. Using this proxy portfolio and our expected return methodology, we’ve calculated total returns across a range of rate and spread scenarios. Those returns are summarized in Exhibit 2 below.
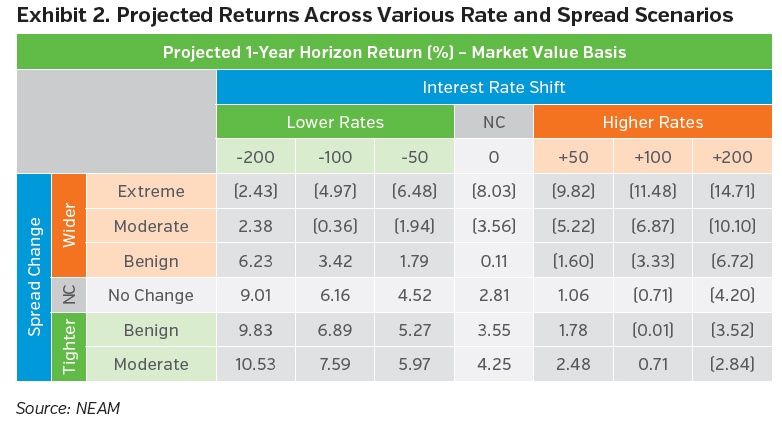
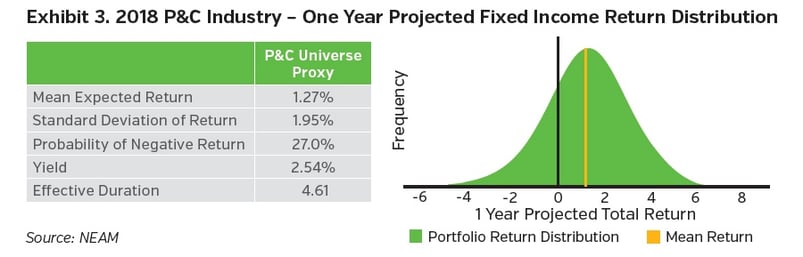
Each of the outcomes calculated in Exhibit 2 are then ascribed a probability based on our outlook for global growth, U.S. growth, central bank policy, fiscal considerations, etc. Using statistical techniques, we create a distribution of returns which we then use to quantify portfolio risk and return. From our work, we derive a mean projected return for U.S. investment grade fixed income in 2018 of 1.27% with a standard error of 1.95%. See Exhibit 3 below.
Conclusions
Fixed income returns for 2017 were better than we expected1, but still very much in the ballpark of our projection. The better than expected performance was largely due to a U.S. Treasury curve which exhibited a “split personality.” We experienced a bear flattening out to 10-years (roughly) and a bull flattening from 10 to 30-years. Our base case was for significant flattening, but with rates rising modestly on the long-end. Hence, the better than expected outcome for long rates propelled portfolio returns higher in the aggregate than was expected.
We expect 2018 will once again result in low single digit returns for fixed income with the probability of a negative total return somewhere around 30%.
Key Takeaways
- 2017 fixed income returns for the U.S. P&C industry should fall roughly in line with our projections, albeit a bit higher, due to long rates being exceptionally well behaved despite solid economic growth and growing corporate revenues and earnings.
- The tax reform package should provide some marginal stimulus for economic growth in 2018, so we maintain our view that interest rates will continue to move modestly higher.
- While the curve flattened very materially in 2017, we do not believe this is an impediment for the Federal Reserve. They will continue to normalize interest rates while also allowing modest run off in the size of their balance sheet.
- We believe U.S. fixed income returns for 2018 will once again be anchored in the (very) low single digit range. The combination of low (but rising) interest rates along with very tight credit spreads will continue to limit the possibilities for fixed income returns.
Endnote
1 Please note that past performance is not indicative of future results.
Expectations for 2018 are based on our capital market assumptions and are subject to change.
NEAM’s portfolio management tools utilize deterministic scenario analysis to provide an estimated range of total returns based on certain assumptions. These assumptions include the assignment of probabilities to each possible interest rate and spread outcome. We assume a 12 month investment horizon and incorporate historical return distributions for each asset class contained in the analysis. These projected returns do not take into consideration the effect of taxes, changing risk profiles, operating cash flows or future investment decisions. Projected returns do not represent actual accounts or actual trades and may not reflect the effect of material economic and market factors. Clients will experience different results from any projected returns shown. There is a potential for loss, as well as gain that is not reflected in the projected information portrayed. The projected performance results shown do not represent the results of actual trading using client assets but were achieved by means of the prospective application of certain assumptions. No representations or warranties are made as to the reasonableness of the assumptions. Results shown are not a guarantee of performance returns. Please carefully review the additional information presented by NEAM.


