Background
GR–NEAM utilizes a proprietary methodology to establish fixed income return estimates and corresponding probability distributions for our clients. These return projections and distributions are useful in assessing investment outcomes, as they allow us to quantify risk using analytics such as VaR, T-VaR, probability of negative return, etc. Using this methodology, we’ve prepared an estimate of 2016 fixed income returns for the P&C industry along with an estimate of dispersion around the mean. Using this approach last year, we estimated that the industry would register a total return of roughly 1.5% in 2015. As we prepare to close out the year, that estimate has proven reasonably accurate.[1]
Investment Environment for 2016
On December 16, the Federal Reserve raised short term interest rates for the first time in nearly a decade. While we expected the Fed to begin this “normalization” effort earlier in 2015, global economic conditions prompted them to defer until they were confident that they weren’t “sailing directly into the wind.” Central banks in the Eurozone and Japan on the other hand, continue to use quantitative easing in an attempt to spur economic growth and to raise inflation expectations to their targets. This divergence among central banks is unusual, to say the least. Forecasting investment returns is always difficult and this added wrinkle complicates the effort further.
We end 2015 very much as we began. Interest rates remain very low and even negative for many shorter dated European sovereign bonds. Global forces and monetary policy continue to suppress sovereign bond yields in the developed world. As a result of the sharp decline in commodities prices precipitated (in large part) by the slowdown in China, corporate credit spreads have widened somewhat. This increase in risk premiums has not been uniform, however. Energy and resource related companies have widened the most and this has had a disproportionate effect on credits rated BBB or lower.
Exhibit 1. Treasury Yields and Corporate Spreads (Year-Over-Year Change)

With regard to rates themselves, we believe the macro factors limiting the upward pressure on yields remain in place. The consensus (and perennial) view of higher rates has been thwarted time and again since the last financial crisis, as the overhang of global debt serves as a governor on economic momentum.
In short, GR–NEAM believes we’re likely to experience very modest upward pressure on U.S. yields in 2016 with a slow, “engineered” flattening of the yield curve driven by actions taken by the Fed.
2016 Projected Returns
Our return projection is based on a portfolio of securities which closely resembles the aggregate P&C fixed income universe. We calculate total returns on the aggregate portfolio assuming numerous interest rate and spread scenarios. These returns are then probability weighted based on our firm’s capital market views. In this way, our assessment of capital market expectations influences the expected level of returns and the distribution of those returns.
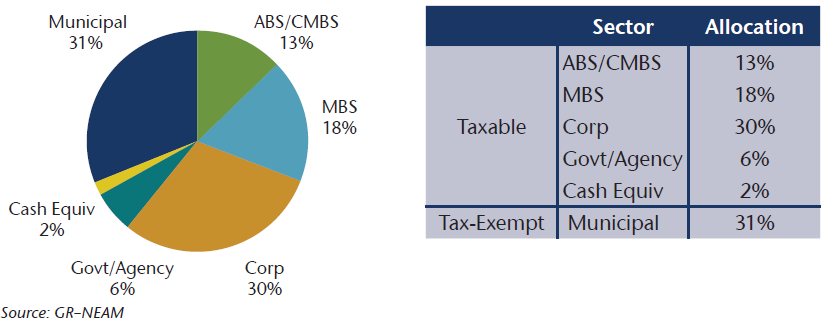
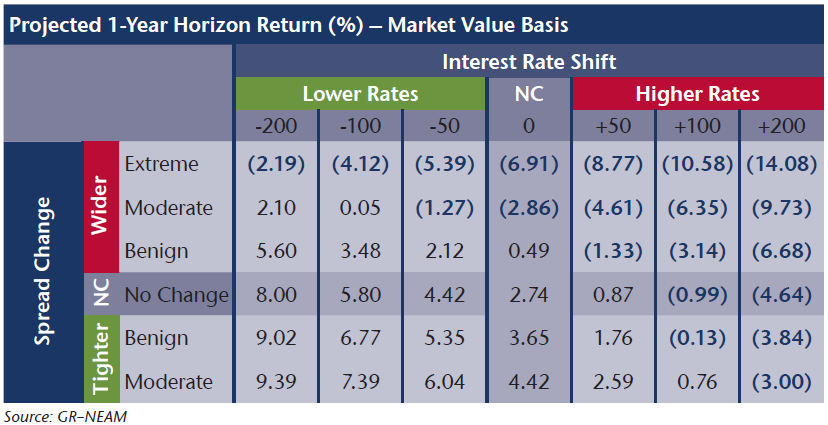
The characteristics of our “aggregate” P&C fixed income portfolio are represented below in Exhibit 2. Using this proxy portfolio and our expected return methodology, we calculated total returns across a range of rate and spread scenarios. Those returns are summarized in Exhibit 3 below.
Exhibit 2: 2016 P&C Industry – Approximate Sector Allocation

Exhibit 3: Projected Returns for Various Rate and Spread Scenarios

If interest rates, curve shape and credit spreads remain completely unchanged, we estimate a total return for the industry of approximately 2.74%. Instead, if interest rates rise by 50 bps and spreads remain stable, our estimate drops to 0.87%. Each cell represents the total return for the corresponding combination of rates and spreads. It should be noted that our model differentiates between fixed income asset classes with regard to spread widening. That is, an “extreme” spread widening is different for investment grade corporate bonds than it is for high yield or structured securities. Thus, we incorporate historical volatilities of each asset class when calibrating the impact of spread changes.
Our investment team ascribes a probability to each of the outcomes above based on our assessment of the global economic environment, U.S. economic growth and relative valuation across fixed income sectors. Given the current level of rates, we’ve ascribed relatively low probabilities to outcomes which feature materially lower interest rates. Higher probabilities are ascribed to outcomes with modestly higher rates and stable spreads, reflecting our base case forecast.
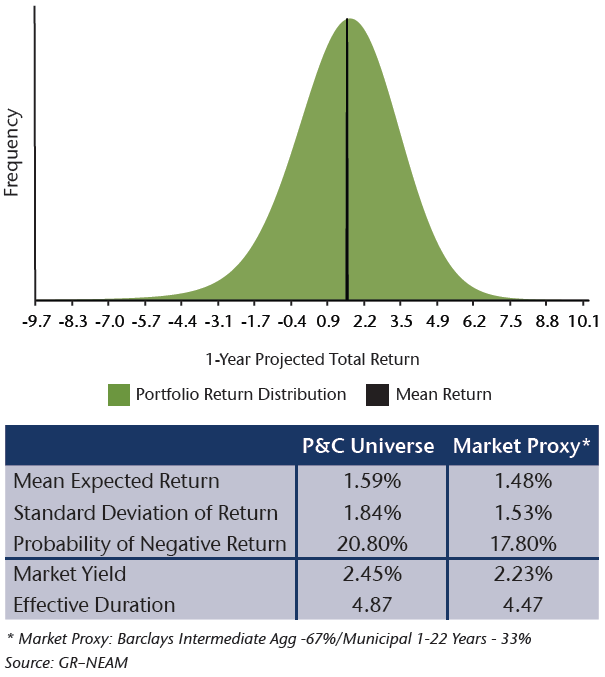
Utilizing statistical techniques, we then create a distribution of returns which is used to assess and quantify portfolio risk and return. Combining the returns above with our ascribed probabilities, we derive a mean projected return of approximately 1.59% with a standard deviation of 1.84% (see Exhibit 4 below).
Exhibit 4: One Year Projected Total Return Distribution and Risk Measures
* Market Proxy: Barclays Intermediate Agg – 67%/Municipal 1-22 Years – 33%

Conclusions and Implications
Our forecast for 2015 has proven relatively accurate. As of November 30, 2015 the Barclays Aggregate has returned 0.88% thus far. The Barclays Municipal Bond Index has returned 2.58% over that same period. Using the two thirds taxable, one third tax exempt weights that we assumed for our 2015 estimates, along with the index returns noted above, our estimate of 1.50% appears to have been remarkably close.1
Our base case interest rate forecast continues to assume that 2016 will not bring much relief from the current low levels of interest rates. Short term Treasury rates have moved higher and should continue to do so as the Fed slowly normalizes monetary policy. We expect the long end of the curve to continue to be constrained by modest levels of global inflation and weak global economic growth. Accommodative central bank policy should provide a benign environment for risk assets generally, and we anticipate that returns for the industry in 2016 will be very similar to those experienced this year.
Key Takeaways
- We estimate that the mean expected return for P&C fixed income portfolios to be 1.59% for 2016, not materially different from 2015.
- Given the persistent low level of rates and despite initial rate hikes from the Federal Reserve, we estimate that the probability of a negative total return from P&C fixed income portfolios is roughly 1 in 5.
- Assuming our fixed income projections continue to prove correct, and given valuations available in U.S. equities, we believe higher yielding alternatives such as preferred stocks and structured securities may prove to be attractive alternatives to corporate credit or other investment grade options in the fixed income space for U.S. P&C companies.
Expectations for 2016 are based on our capital market assumptions and are subject to change.
GR–NEAM’s portfolio management tools utilize deterministic scenario analysis to provide an estimated range of total returns based on certain assumptions. These assumptions include the assignment of probabilities to each possible interest rate and spread outcome. We assume a 12 month investment horizon and incorporate historical return distributions for each asset class contained in the analysis. These projected returns do not take into consideration the effect of taxes, changing risk profiles, operating cash flows or future investment decisions. Projected returns do not represent actual accounts or actual trades and may not reflect the effect of material economic and market factors.
Clients will experience different results from any projected returns shown. There is a potential for loss, as well as gain, that is not reflected in the projected information portrayed. The projected performance results shown do not represent the results of actual trading using client assets but were achieved by means of the prospective application of certain assumptions. Results shown are not a guarantee of performance returns. Please carefully review the additional information presented by GR–NEAM.
[1] Please note that past performance is not indicative of future results.


