
Written in January 2018
Returns for 2017 have been nothing short of spectacular, and records abound. The Dow Jones index recorded 70 plus record highs for the year, surpassing 1995 as the most ever. Similarly, the S&P 500 achieved 62 record highs last year and exhibited the longest streak documented without a 3% pullback.1 The market also exhibited uncanny linearity of returns with each month posting positive total returns for the first time in history.2 Volatility remained well below normal with the Chicago Board Options Exchange Volatility Index (“VIX”) tracking roughly half of its 25-year average. In brief, higher than average gains were achieved with lower than average volatility and greater linearity than is typical for equity risk assets. Correspondingly, using risk adjusted returns as measured by the Sharpe Ratio, returns relative to risk were the third best in history.3 Suffice it to say, it was a record year.
Moreover, the pace of gains accelerated for the fourth quarter as the S&P 500 gained over 6%, notching its fastest quarterly pace of the year. Fueled by the tax reform plan, market strength was broad based with all but one sector registering gains for the quarter. Consumer discretionary, an area which stands to nicely benefit from tax reform, led the advance due to its above average effective tax rate and domestic focus. Technology also continued its strength. Notably, financials experienced above market gains buoyed by expectations for higher bond yields in addition to tax and anticipated regulatory benefits. Sector dispersion, measured by the spread between the best and worst performing groups within the S&P 500 index, sat at its highest level since 2009 on an annual return basis. Consequently, sector selection made an indelible impression upon market returns for both the quarter and the year. Stylistically, growth strategies continued to outperform value investments although the differential narrowed for the quarter as more cyclical companies rallied.
By its very definition, a record is extraordinary among, or surpasses, others of its kind. As the crescendo builds, the sheer achievement of this multitude of records is potentially significant in itself. With a feeling of underlying acceleration as the pace of market gains quickens, the natural question is where do we go from here? Will euphoria lead to more records akin to a late 1990s market “melt up” when stocks rose dramatically, despite high valuations, as investors bid prices higher and higher fearing they might miss the party? Or will investors begin to discount the increasing evidence of late cycle dynamics and a potential cyclical peak, slowing or even changing the trajectory? While it is impossible to foretell exactly how this generously long period of excess liquidity will evolve into its next phase, there is value in understanding the late cycle mosaic.
Late Cycle Dynamics
Referencing the calendar, the current business cycle is longer than average, dating over 100 months. Central bank policies have arguably elongated the cycle relative to history, so calendar age is not the only way to judge its evolution. The cost of capital for non-investment grade companies provides useful informational context (Chart 1). With spreads now at post crisis tights, this lens implies borrowing costs could be as good as they may get for more speculative and often smaller companies. The backdrop is broadly supportive for this asset class with low default rates and favorable economic momentum suggesting these levels could be sustained for a while longer similar to the mid-00s period. However, payment-in-kind (“PIK”) junk issuance notably hit a record approaching almost $17 billion in 2017.4 PIK bonds, considered deferred coupon bonds as the instrument pays interest in additional bonds rather than cash, are high risk and are often issued by distressed companies. While PIK bonds only represent a small portion of the high yield market, the surge in PIK bond issuance, essentially tripling versus the prior year, bears watching as a barometer of late cycle credit risk and borrowing behavior.
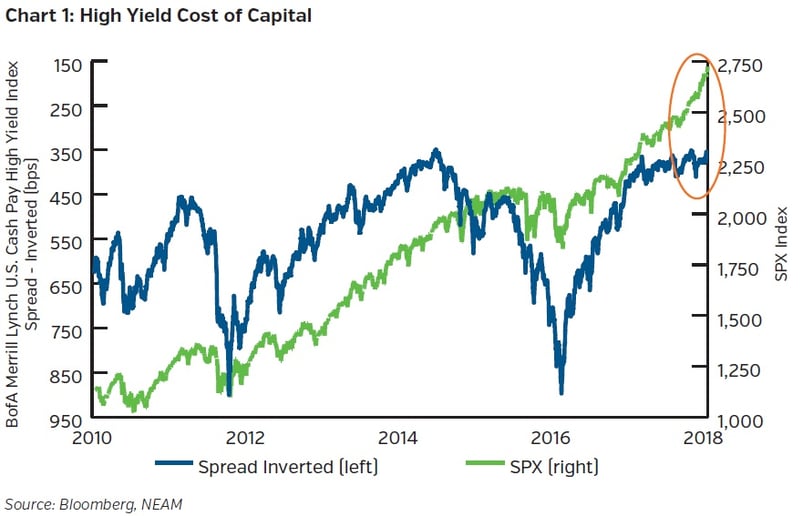
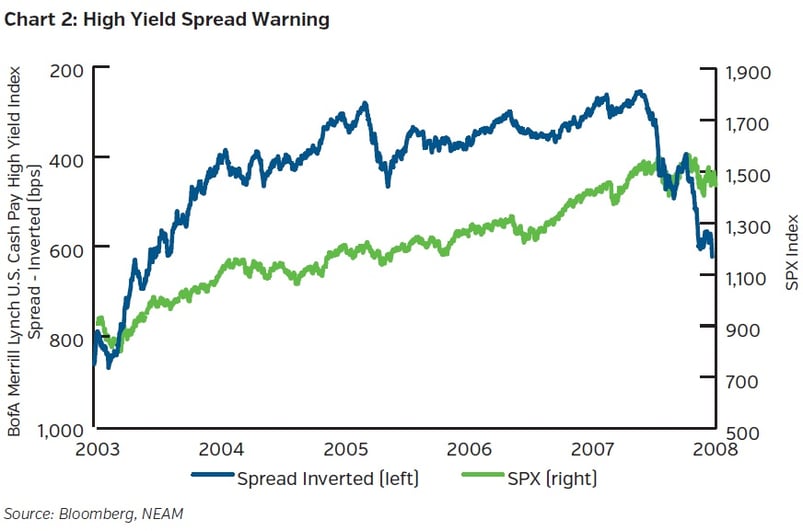
The relationship between equity prices and high yield spreads can also enlighten investors as the cycle progresses since credit markets often lead equities. Most simply, bonds are higher in the capital structure and any deterioration in the company’s perceived credit quality will have a negative impact on the stock. As such, high yield spreads and equity prices are inversely correlated (Chart 1), and any sustained divergence can be problematic. This divergence sounded a prescient alarm as the business cycle matured in 2007. High yield spreads widened in the late summer and fall before the equity market ultimately peaked in October leading up to the Global Financial Crisis (Chart 2). Today, while high yield spreads continue to grind tighter, the recent pace of equity gains appear almost asymptotic by comparison (Chart 1). This relationship will be increasingly important as financial conditions tighten with anticipated rate hikes by the Federal Reserve, potentially exposing late cycle fragility.
Naturally, one looks for emerging excesses against a late cycle backdrop for further clues. The frenzy in crypto-currencies comes to mind. While there is real value in the underlying blockchain technology, it can be difficult to ascribe a concrete value to this emerging digital currency. Despite this uncertainty, the price of Bitcoin rose over 1,400% last year, dwarfing the peak ascent in the U.S. during the Dot-com bubble, the peak gains in the Japanese bull market prior to its lost decade and the peak advance in the most recent bullion bull market during the 2001 to 2011 period.5 Likewise the daily dollar trading volume across crypto-currencies is now estimated to approximate $50 billion matching the average dollar volume executed on the New York Stock Exchange for equities.6
Tremendous value creation also occurred for well positioned technology companies. The most heralded cohort collectively added almost one trillion in market value over the course of 2017, pacing at half the scale of the balance sheet stimulus provided by the Bank of Japan (“BOJ”) and the European Central Bank (“ECB”) over the same time period. While the definition of excess is in the eye of the beholder, no one would dispute the enormity of these gains.
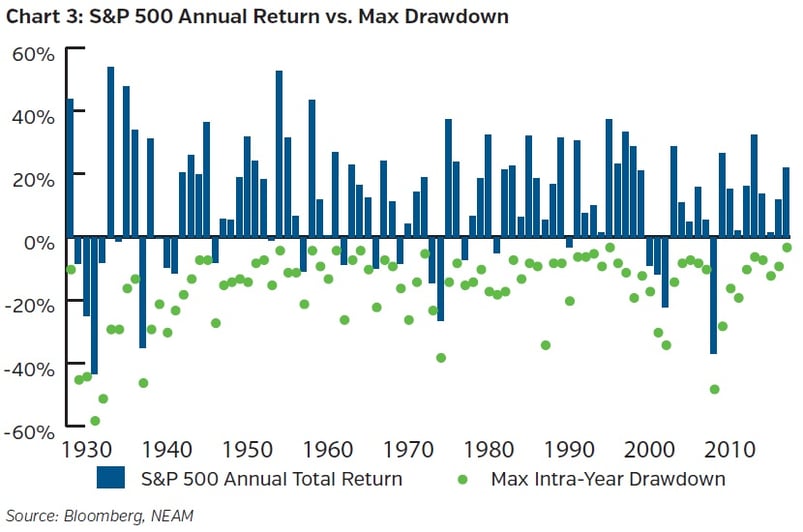
Excessive tranquility is also extremely unusual. Against this seemingly late cycle backdrop, low volatility has been prevalent and the CBOE Exchange Volatility Index (“VIX”) achieved yet another historical milestone in 2017 recording its lowest average level for a full year ever.7 This is further evidenced in the absence of drawdowns, defined as the peak-to-trough decline during a specified period, with the largest pullback of the year registered at under 3% (Chart 3). The historic pattern has not typically included many instances where this shallowness repeats. While data compiled by LPL Financial indicates that returns can certainly be positive in the year following those with the smallest intra-year pullbacks, the data does suggest that the same ruler-like advance is unlikely, and volatility is expected to rise. In other words, the continuation of the bull market is very possible, albeit with a bumpier cadence.
Wall Street vs. Main Street
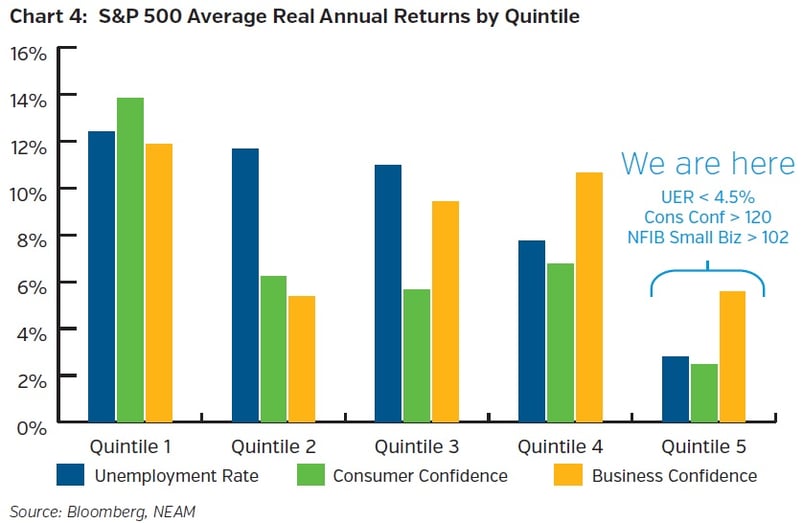
The market is forward looking by its very nature, discounting future fundamentals and growth prospects into current prices. The market, therefore, typically peaks before the business cycle does. With robust gains in 2017 and optimism high for 2018, the market remains buoyant, and late cycle dynamics are secondary to the self-reinforcing price momentum and euphoric sentiment driving equity prices higher. The magnitude of future upside warrants consideration as a great deal of good news is already discounted and should portend more subdued prospective returns (Chart 4). History indicates that once optimism is more universally registered on “Main Street”, via low unemployment and high confidence measurements (Quintile 5), the bulk of the equity returns would be behind us as the cycle peak approaches. Ironically, as life improves for Main Street, things may not be as promising for Wall Street.
Business confidence paints a higher return potential. This could be further amplified by profitable business growth and reinvestment possibly unleashed by current tax reform. This could help fuel a market melt up scenario as equity risk assets could advance handsomely due to animal spirits, despite the late cycle nature of the current environment (see 1Q Outlook 2017 “Animal Spirits”). The ultimate governor on upside, however, should be the yield curve given the inverse relationship between interest rates and price-to-earnings multiples. Given the benefit that low interest rates accrue to the discounted value of future cash flows, the faster and higher rates move, the more of an issue it could become for equity returns. As such, the trajectory of central bank policy, higher than anticipated inflation and the slope of the curve are likewise key determinants.
CONCLUSION
For now, the “Goldilocks” backdrop, characterized by moderate and stable economic growth with low inflation, has resulted in an economy “neither too hot, nor too cold.” Successful passage of the tax reform bill, featuring a drop in the corporate tax rate to 21%, has provided equal fuel for market advances. This backdrop has largely overshadowed the mounting late cycle mosaic and continues to strongly underpin risk asset pricing. This was resoundingly evident in 2017 which will be undoubtedly revered for its robust gains. In our view, though, the year should be most remembered for its notable absences: the absence of inflation, the absence of normalized interest rates, the absence of volatility and the absence of typical market drawdowns. Collectively, these circumstances provided an idyllic backdrop for U.S. equities driving an abundance of records. To date, 2018 has exhibited this same resilience.
From our standpoint, it increasingly feels like we are entering the “melt up” phase in this bull market, a period distinguished by the late cycle elements discussed, underlying market acceleration and other euphoric behaviors. The velocity of record breaking could indeed quicken as we stretch this ostensible upper band. We cannot know with any certainty how long this will persist, but ultimately the market will reach the point where the band has no more elasticity, and the final record has been achieved. Since it is virtually impossible to time the market, we continue our focus on risk adjusted returns and remain cognizant of balancing downside risk with potential reward. Likewise, our investment philosophy retains a long-term orientation. Patience accrues benefits as time arbitrage has historically worked in investor favor. This is even more salient in a momentum oriented market, similar to where we currently reside, with a select number of names universally owned by market participants. In a market where valuations are elevated relative to history, selectivity remains important. After the last record is heralded and the cycle turns, as history proves it always does, we aim to be ready to capitalize on emerging opportunities.
Endnotes
1 Bloomberg, “Latest Zombie Stock Theory Asks Where Was the Momentum in Bonds” dated January 5, 2018.
2 LPL Financial, “Another record for 2017” dated December 28, 2017.
3 Bloomberg, “This Was the Kind of Week Morgan Stanley Sees Going Away in 2018” dated December 18, 2017.
4 Bloomberg, “Pay-In-Kind Junk Bonds Are Back After Record Issuance in 2017” dated January 11, 2018.
5 Wall Street Journal.
6 Business Insider, “The Cryptocurrency Market is Now Doing the Same Daily Volume as the New York Stock Exchange,” dated December 20, 2017.
7 LPL Financial, “Charts to Watch in 2018: Low Volatility,” dated January 11, 2018.


