Enterprise Value-at-Risk (VaR) remains relevant as a key metric in solvency assessment and insurer capital adequacy measurement by regulators in Solvency II regimes. More broadly, including the United States, as companies continue to develop their internal economic capital models, VaR is a reference statistic to adjudicate modeled outcomes. In addition, as a competitive assessment tool, VaR metrics can be insightful for benchmarking performance. In all instances, the need for a singular metric comparable across industry segments and geography will increase, as will the need for transparency and uniform methods of estimation.
Individual companies can impact VaR by managing capital composition and leverage, altering product mix and margins, investment allocations and returns, and by mitigating their volatility through a myriad of strategies, all of which change prospective enterprise total return and risk, but often at a cost and not always with guaranteed success. VaR can be used as a calibration tool by insurers seeking to balance return/risk trade-offs from these strategies. It can also be used for performance benchmarking by insurers, investors and other stakeholders.
The dilemma faced by every insurer is to decide their risk appetite and articulate it. Using VaR, or any other set of metrics regardless of the confidence interval or time frame, leaves fundamental questions to be answered: “How much capital is enough?” “What is an adequate margin of solvency?” “What is an appropriate/desirable risk appetite?” Unfortunately, there are no published benchmarks. There are no standards. But there are bases of standards: rating agencies, peer reviews and capital market assessments.
We previously contrasted enterprise-wide 99.5 VaR estimates of the approximately 400 largest U.S. Property and Casualty groups to their financial strength ratings by A.M. Best as of mid-year 2010. We performed the same exercise for the largest 139 companies having S&P ratings. In each case, we noted an inverse relationship between rating cohort and VaR: as quality increased, VaR decreased along with dispersion.
The relationship was strongest for A.M. Best ratings’ cohorts. In this General ReView we extend the time period of the analysis focusing upon A.M. Best ratings.1 In a future General ReView we will align the VaR estimation methodology to conform more closely to the approach we use when advising clients in the development of their risk budgets and methods of benchmarking.
Estimated T-VaR by Rating Agency Cohort
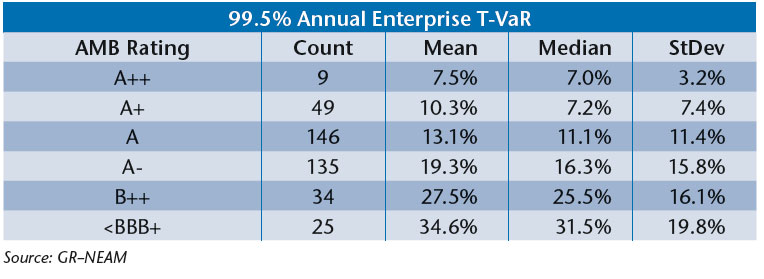
In a previous edition, we estimated the 99.5 inter-period annual Enterprise VaR and T-VaR for every U.S. domestic Property and Casualty company with invested assets exceeding $50 million at year-end 2010. For this General Review we extended the analysis through 2012. Next, we aggregated companies by their mid-year 2010 and 2012 ratings from A.M. Best, calculating the mean and median T-VaR by rating cohort (ultimately we want an estimate of “tail-risk”) and the standard deviation of the estimates within the rating cohort. Table 1 displays the results we presented in the prior General Review.
Table I. 2010 A.M. Best Ratings versus 99.5 Enterprise T-VaR (as a percent of Capital)

As shown in Table 1, there were nine Property and Casualty companies having a mid-year 2010 rating of A++. Their mean and median estimated 99.5 T-VaR were 7.48% and 6.95% respectively, and the standard deviation among the estimates was 3.19%. As the rating of the cohort falls, the mean, median and standard deviation of the estimated T-VaR increases.
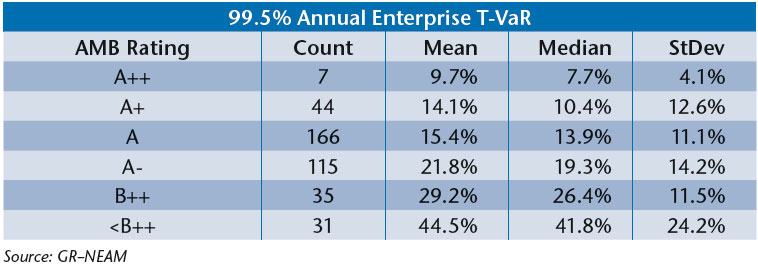
In the previous review, we accounted for 398 companies. By coincidence, this was the same number of companies included in this year’s review. Since 2010, surplus of these companies increased from approximately $490 billion to $562 billion, representing well over 97% of the industry’s capital in each year. Table 2 below shows the updated results through 2012.
Table II. 2012 A.M. Best Ratings versus 99.5 Enterprise T-VaR (as a percent of Capital)

In contrast to the previous T-VaRs, the 2012 mean and median estimate of T-VaR increased across all ratings’ cohorts. The dispersion increased among the two highest and the lowest rating cohorts. Similar to the prior period’s results, the dispersion of estimates for A++ rated companies remains quite narrow and well below that of A+ companies.
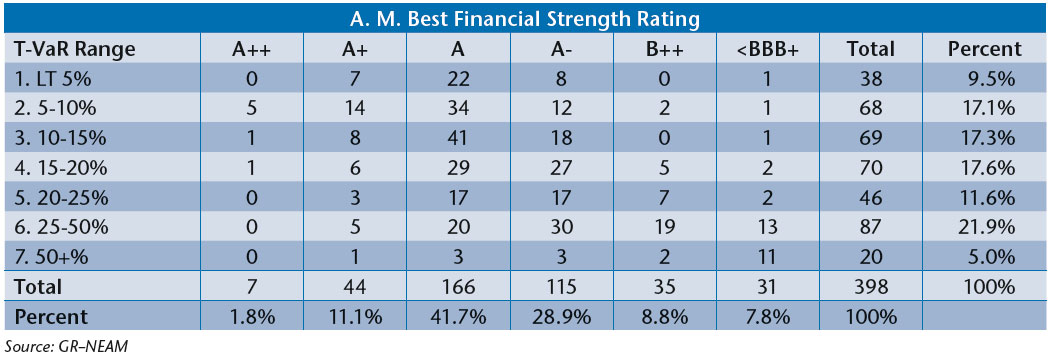
We do caution that low T-VaRs are neither necessary nor sufficient to assure favorable rating actions, at least not on the basis of the simple calculation methodology used for the above tables. Table 3 below shows the number of company/groups by rating cohort and T-VaR ranges. For example, in the A++ rating cohort there are five company groups having an Enterprise T-VaR as a percent of capital in the range of 5% to 10%. There are also 14, 34 and 12 companies in the 5% to 10% range in the A+, A and A- rating cohorts respectively.
Table III. 2012 Number of Company/Groups by A.M. Best Rating and 99.5 Enterprise T-VaR

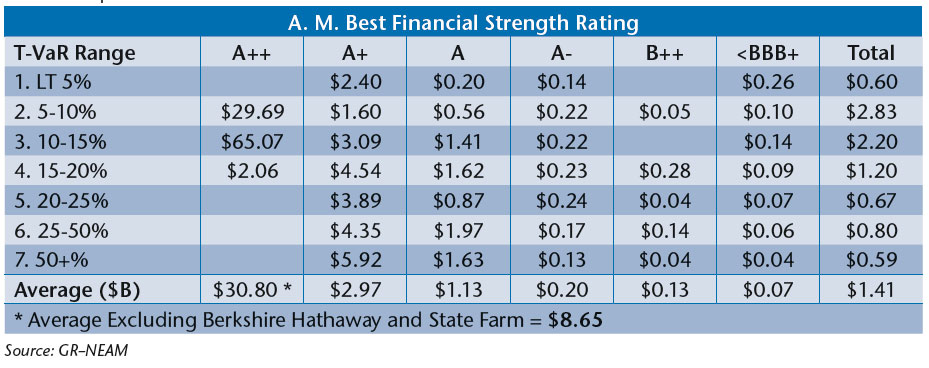
Table 4 below displays the average surplus of company/groups by A.M. Best rating cohorts and Enterprise T-VaR ranges. The last row highlights the average surplus by rating cohort. It would appear that absolute size of company/group surplus might have a meaningful impact upon ratings even after excluding Berkshire Hathaway and State Farm, whose combined surplus totals $175 billion, or about 28% of the industry’s total surplus.
Table IV. Average Surplus ($B) of Company/Groups by A.M. Best Rating and 99.5 Enterprise T-VaR

Summary
As an investment advisor, our interest in metrics is aligned with our clients’ solvency assessment and risk budgets. We believe investment risk tolerance is derivative of these assessments and should be reflected in investment policy statements and benchmarks. The questions to answer are: “What is an appropriate/desirable risk tolerance?” and “How might regulators and rating agencies adjudicate the amount in their assessments of insurers’ capital adequacy?”
We seek transparency in estimation methods to facilitate comparisons across companies and over time. Enterprise VaR/T-VaR metrics can be used to encourage such transparency and comparisons. At first blush, there appears to be some linkage between agency ratings and T-VaR estimates: as ratings lessen, T-VaR estimates and their dispersion increase. However, it is also true that the sheer size of a company can have an impact upon ratings, as we might expect and hope to be the case.
The estimates we have used are retrospective, calculated from historic reported results. However, we need prospective estimates, relying upon forward-looking estimates as to insurers’ capital market returns, underwriting margins, volatilities of each, correlations and leverage. This will be the subject of a future General ReView as well as a comparison to companies’ aggregate risk-based capital charges.
Endnote
1 Our information source, SNL Financial, reported a decline of over 35% from our prior review in the number of S&P rated companies to less than 100. Accordingly, we dropped them from the review.


