
Executive Summary
Enterprise based asset allocation (EBAA™) considers the joint implications of an insurer’s exposure to capital market and insurance market expectations to formulate investment strategies. This discussion builds on Part One of this two-part series where we previously discussed how EBAA™ analysis supported strategic choices regarding investment portfolio sector, duration, and credit quality of U.S. Property & Casualty (P&C) insurers. We discussed how these choices differed as monetary policy shifted from an accommodative focus in 2021 to a restrictive focus in 2023. In Part Two, we extend this discussion and explore how EBAA™ outcomes and preferences were considered given implications for realizing gains or losses and net income.
Background
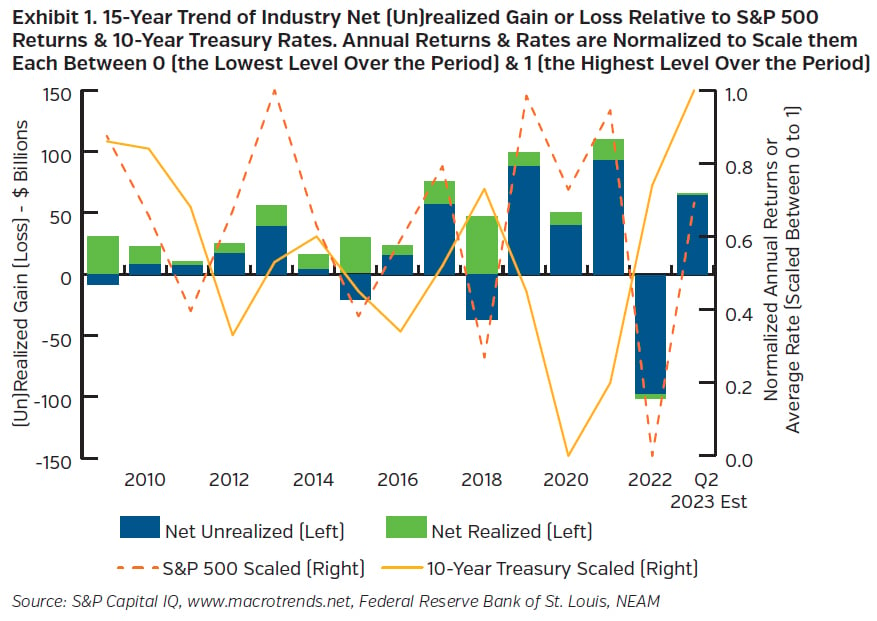
Between 2022 and 2023, the Federal Reserve took dramatic action to control inflation by raising short-term interest rates several times. The Fed Funds’ rate target at the time of this writing was 5.25 to 5.5%, which is about 500 basis points higher than it was in March 2022. Some of the impact to capital markets and U.S. P&C insurer balance sheets from this interest rate shift are outlined in Exhibit 1. Between 2019 and 2021, the 10-year U.S. Treasury bond rate was at historic lows while the S&P 500 posted some of its strongest returns over the period. Market values of bonds and equities increased and (un)realized gains were very strong over this period as a result. Conversely in 2009, 2018 and 2022, we see large increases in year-over-year 10-year U.S. Treasury bond rates, with corresponding net unrealized losses for the industry. Portfolio market values in 2018 and 2022 were further negatively impacted by two of the worst annual returns by the S&P500 over the period.
Capital markets always have an inherent degree of uncertainty. Therefore, a regular review of strategic portfolio allocation is a prudent practice to evaluate opportunities relative to that uncertainty. NEAM recommends a holistic approach to strategic asset allocation, considering assets and liabilities jointly in their influence on enterprise returns and risk. In Part Two of this two-part study, we apply an EBAA™ framework to evaluate how different interest rate environments from shifting federal monetary policy can impact findings and investment preferences for these insurers. We define return on equity or surplus (ROE) using a DuPont framework illustrated in Exhibit 2. The objective of EBAA™ is to identify scenarios that maximize ROE for given levels of enterprise risk.

Comparing EBAA™ Outcomes: Impact of Realized Gains & Losses
Case studies from actual EBAA™ assessments are used to evaluate the impact of accommodative and restrictive monetary policy, via interest rate targets by the Federal Reserve, on EBAA™ outcome preferences. We consider 10 U.S. P&C insurers and assess their EBAA™ results in 2021 (the accommodative period) and in 2023 (the restrictive period). The 10 companies vary in size and product focus and provide a reasonable, albeit small, representative sample of the broader universe of P&C insurance companies. Exhibit 3 below provides some background information for these firms.
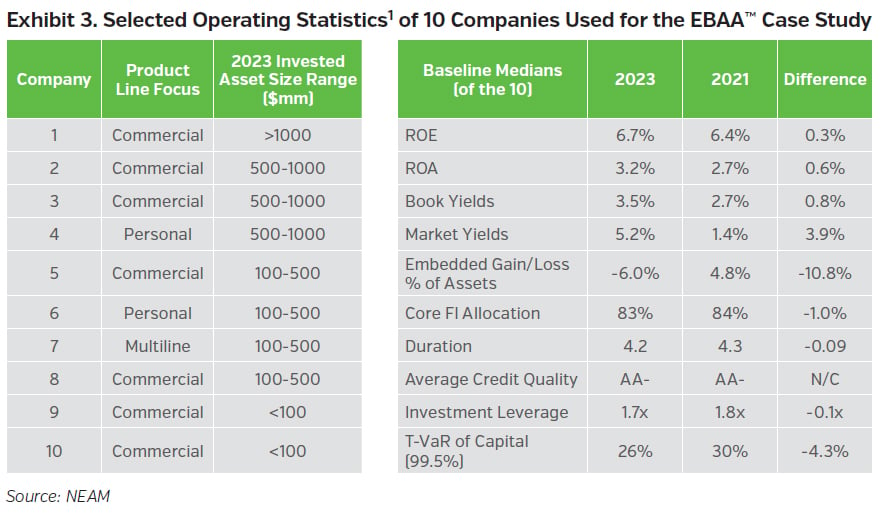
There are a few differences worth mentioning across the portfolios in 2021 versus 2023. First, investment return expectations are higher in the restrictive period in 2023. Compared to 2021, the median return on assets across the 10 companies were up 60 basis points; book yields and market yields were up by 80 basis points and over 390 basis points respectively. Moreover, the median embedded book yields of held assets in 2021 for the 10 companies were higher than available market yields for those securities by about 125 basis points. In contrast, the median 2023 portfolio book yields were approximately 180 basis points lower than market yields. The embedded market value of assets changed as well. In 2021, portfolios for the 10 companies had median net embedded gain as a percent of invested assets of about 4.8%. With rising rates, by 2023 this shifted significantly and net embedded losses as a percent of invested assets fell to an estimated negative 6.0%.
The primary objective for the EBAA™ analysis of each company was to enhance risk-adjusted returns for the enterprise2-identifying statistically optimal portfolio allocation scenarios. For some companies, the optimal choices and scenarios created dilemmas. Most had to weigh two factors. One was the opportunity to invest in high yielding, high quality fixed income assets and the long-term benefits of locking in attractive yields. The other was the near-term cost to net income resulting from realizing losses to facilitate the portfolio turnover necessary to invest in those opportunities.
We previously discussed in Part One how asset allocation decisions with sector targets, duration and credit quality varied in the accommodative monetary policy period of 2021 versus the restrictive policy monetary period of 2023. In Part Two, we assess how other factors, such as realizing gains (losses), were factors for EBAA™ outcomes. This is summarized in Exhibit 4.
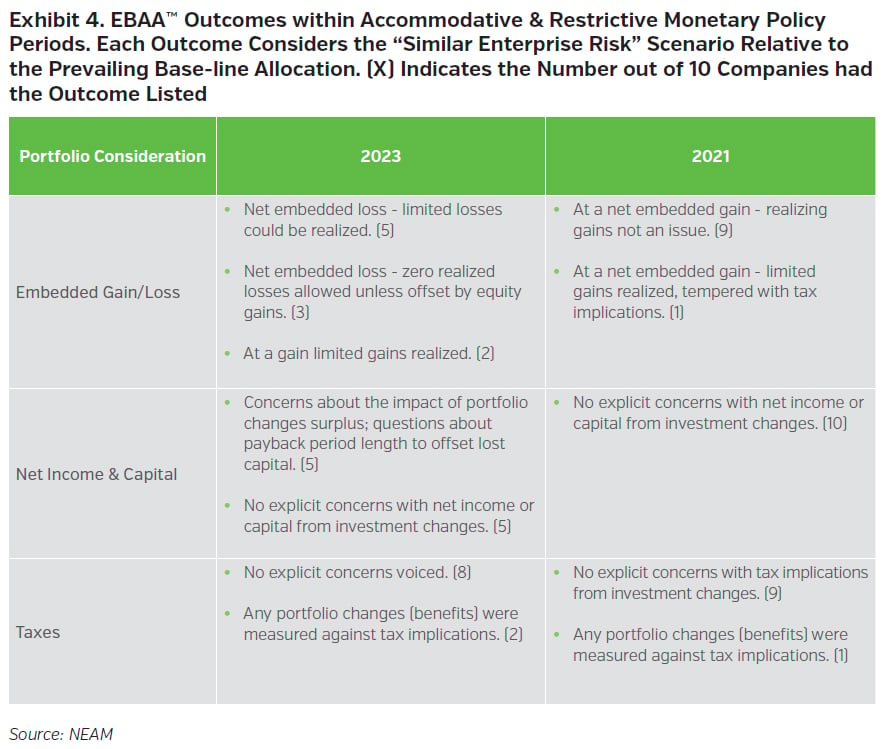
Exhibit 4 shows that in 2021, when rates were low from an accommodative monetary policy, fixed income portfolios were generally at a net gain position. Moreover, during this period, companies were less concerned about the near-term impact on net income from realizing gains as portfolios rotated allocations to optimal sector, duration and credit quality positions. Companies were primarily focused on preserving long-term book yield and were willing to make portfolio changes in the near term to achieve that goal. In 2023, with rising rates from a restrictive monetary policy, most companies were at a net embedded loss with their invested assets. Only two of the 10 companies across the case study had a net gain position, in part from market appreciation from outsized equity allocations. However, all companies were cautious in realizing significant losses. Among seven companies that were at a net embedded loss position, there was a strong hesitancy to realize losses in the near term, aside from jointly realizing offsetting gains in equities. Here the short-term cost to current period net income overshadowed long-term benefits of future net income from swift rotation into higher market yielding assets.
For instance, from the EBAA™ analysis conducted in 2023, the implied median increase in investment income returns for the 10 companies was 90 basis points at similar enterprise risk levels. Moreover, despite a net income cost from realizing losses in the current period, the median payback period3 to offset those losses was approximately 1.7 years. One company in the study was projected in year two to more than fully recoup lost net income from realized losses in year one. However, aside from instances where equity gains were enough to offset realized losses, some of these outcomes were not viable for most companies in the case study despite the compelling longer-term ROA and ROE improvement.
We noted in a recent Perspectives article how capital levels for U.S. P&C decreased in 2022 versus 2021.4 In 2021, there was little explicit concern across the 10 companies in the case study about the impact to net income or capital by positioning a portfolio to statistically optimal scenarios identified. This changed for five companies with EBAAs™ in 2023. The statistically optimal scenarios were gauged heavily against the viability of executing toward those scenarios; for example: What was the capital drain from realizing losses? Can we afford to realize investment losses given challenges with underwriting results?
Lastly, taxes appeared to be a minor consideration with 2021 and 2023 EBAAs™, with only one or two companies showing a reservation to altering portfolio positions due to tax implications in either year.
Beyond the Impact of Realizing Gains, Losses, Taxes, Net Income & Capital
We encourage you to review Part One of this series for discussion on sector, duration, and credit quality outcomes for the companies in this case study.
Key Takeaways
NEAM recommends using a holistic approach to strategic asset allocation, factoring assets, liabilities and capital jointly for investment decision-making. This can foster a deeper understanding of optimal portfolio structures. However, even if a portfolio or scenario suggests optimal returns versus risk over a longer-term from an economic perspective, it may not be viable over the near-term when considering the impact of realizing gains (losses), taxes and other accounting implications. Part One of this series assessed how choices varied for sector, duration and credit quality in 2021 versus 2023 for 10 companies via an EBAA™ study. In Part Two, we take this analysis further to test how secondary considerations, such as embedded gain (loss) and net income, influenced EBAA™ outcome preferences. Some of our findings include:
- In 2021, most companies held a net unrealized gain position across their invested assets. They were less concerned about the impact to net income or capital if those gains were realized to facilitate portfolio repositioning.
- In 2023, most companies held a net unrealized loss position due to a restrictive monetary policy pushing market yields higher than embedded book yields. The potential near-term adverse impact on net income and capital were key considerations. This either limited or curtailed how viable certain choices were despite how statistically optimal they appeared over a longer-term.
- Despite payback periods of only one-to-two years (the time for future additional investment income to offset near-term costs to net income), companies were generally unwilling to post realized net investment losses to current period net income.
Utilizing a broad suite of analytics provides a rich perspective of opportunities and challenges to enhance risk-adjusted performance over time, both from an economic and accounting perspective. EBAA™ is one vehicle for this. A holistic approach that jointly considers investments and insurance can be an effective way to assess investment strategy over a longer period as capital markets and insurance markets evolve. We encourage you to read part one of this two-part series for further discussion.
The EBAA™ analysis presented herein illustrates hypothetical estimates of return, risk, asset allocation and other metrics for what NEAM believes to be a representative sample of insurance companies. NEAM applies assumptions to generate these metrics, such as projections for capital market returns, insurance product performance, investment and underwriting risks and how those risks interact. The analysis aims to generalize the specific constraints, risk tolerances and objectives of each insurance company portrayed and uses a primary objective for all companies of maximizing returns and keeping enterprise risk static. NEAM makes no representation or warranty as to the reasonableness of the tool, reinvestment universe, constraints or assumptions applied. The metrics presented herein do not consider the effect of changing risk profiles, operating cash flows or future investment decisions, do not represent actual trades and may not reflect the effect of material economic and market factors, including the potential inability to execute the proposed portfolio repositioning. The reinvestment set includes investment types offered by NEAM, and other investment types not considered may have superior characteristics. Clients will experience different results from the information shown, including the potential for loss, and results may vary with each use of the tool and over time.
Endnotes
1 See Perspectives “2022 P&C Industry Investment Highlights: Reversing the Declining Trend?” July 2023, for further discussion of industry results for some of these operating statistics.
2 See Perspectives “Rates, Risk and Asset Allocation – Part One,” November 2023, for further details.
3 Payback periods are partially dependent on the amount of realized losses allowed. Most companies in the study would not entertain more than 25% of net realized losses regardless of any projected long-term benefits of doing so.
4 See Perspectives “2022 P&C Industry Investment Highlights: Reversing the Declining Trend?” July 2023, for further discussion.


