
The UN’s recent landmark climate report explains that “Climate change is already affecting every inhabited region across the globe with human influence contributing to many observed changes in weather and climate extremes.”1 McKinsey Global Institute goes on to note “As average temperatures rise, climate science finds that acute hazards such as heat waves and floods grow in frequency and severity, and chronic hazards, such as drought and rising sea levels, intensify.”2
The U.S. municipal bond market is obviously party to this profound, existential risk. As the topic garners increasing focus, we believe it’s important to take stock of the market to better understand where it fits into the global predicament. Can climate-related risk be avoided in the municipal market or is it systemic? Are stakeholders adjusting?
Physical Risk
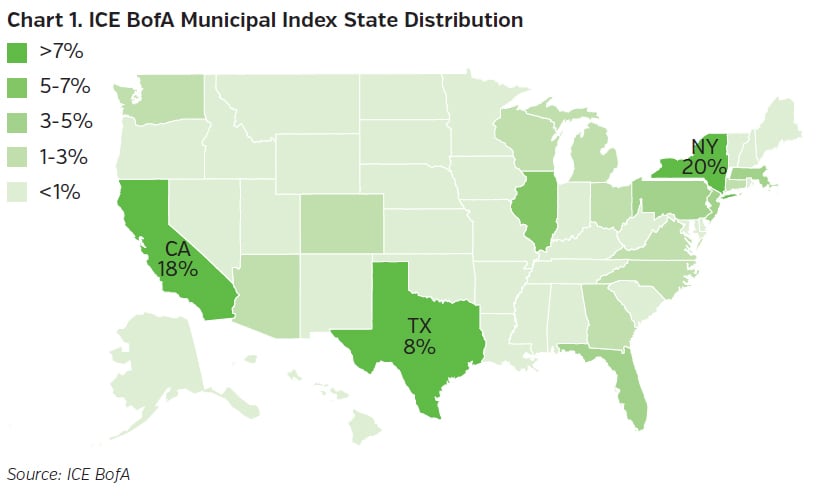
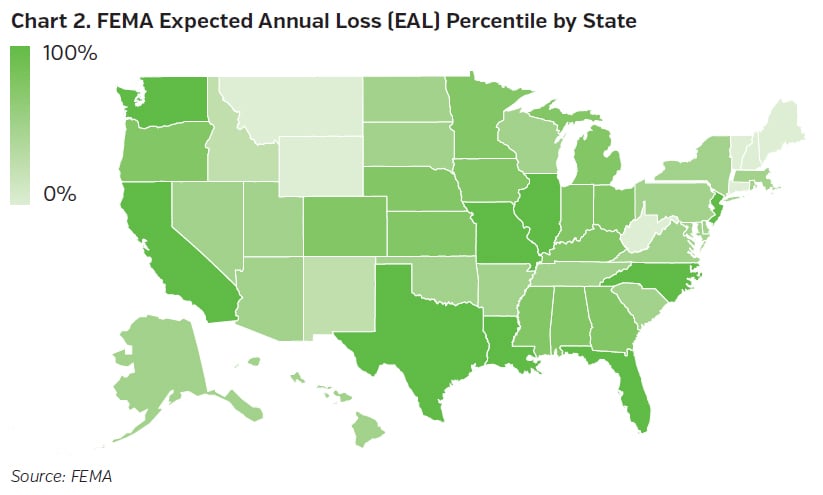
Debt in the municipal bond market is more heavily concentrated in states with elevated natural hazard risk, as illustrated below. For this exercise, we are looking at state-level FEMA National Risk Index ratings as a directional proxy for climate-related risk. The National Risk Index identifies communities most at risk to natural hazards, as measured by expected annual loss.3 To be sure, we consider climate-related risk at a more granular level, though such state-level assessments are still informative. Notably, the states of California, Florida, New York, and Texas - which are in the two highest quintiles of FEMA risk - make up about half the municipal bond market but only account for one-third of U.S. population. The twenty states in the two lowest natural risk quintiles account for just 12% of the municipal market.
Additionally, people (and capital) have gravitated to the elevated risk areas for decades. The higher risk metropolitan areas of Houston and Miami, for example, are booming, while population growth in relatively fair-weathered New England has lagged.
Transition Risk
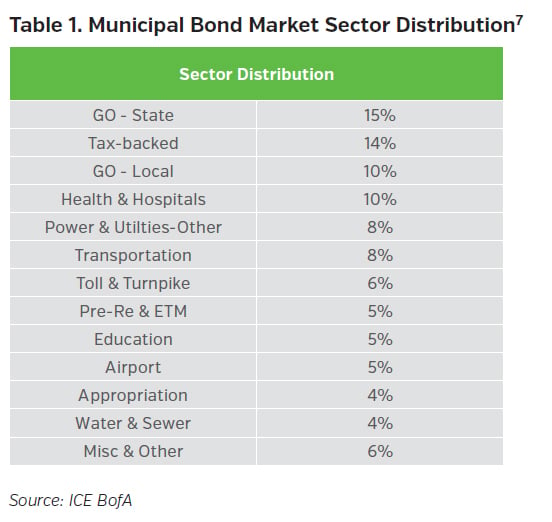
In addition to physical risk management, fossil fuel liabilities pose a concurrent risk for states and local governments. These are the costs that arise from the adjustment to a carbon-neutral economy. The concept typically focuses on power generation and fuel extraction, though transition risk extends beyond energy-related enterprises. From coal mining locales and oil states to toll roads and airports, carbon transition will impact every sector in the municipal bond market to some degree (general obligations, et al.). In terms of public power, municipal utilities provide electricity to 15% of the U.S. population4 and account for ~8% of the municipal market. Public power is somewhat more coal-centric than the investor-owned utility space5 and coal-fired generation is more common in the non-coastal states.6
Stakeholders
Are stakeholders adjusting? On the margin, yes. Some municipal bond issuers are beginning to disclose climate-related risks, though the language is often generic. Third-party assessment resources are becoming more available (Federal data, paid vendors, etc.). Credit rating agencies are including more climate-related language in their work. Accounting and reporting rules are mostly silent on the topic, though regulator interest is percolating. State insurance regulators in California and Connecticut, for example, have issued climate risk-related surveys and New York’s Department of Financial Services issued a circular on the topic as well. The Bank of England, too, includes U.S. municipals in its climate risk stress test for European insurers.
In terms of the market, climate-related risk premium is not always evident in municipal bond prices. Rightly or wrongly, this could persist for several reasons, not the least of which being the value of the municipal tax-exemption (which, for example, is more valuable in higher risk California because of its high tax rates). That said, states and local governments have a strong track record of managing through natural perils, albeit often with Federal help. Mitigation and adaptation efforts are occurring as well. Is enough being done? Probably not, though the increased focus should bring reform.
Risk Management
While we have long considered climate risk in our municipal bond credit process, we are working to formalize the concept with the increasing availability of related data and resources (FEMA, etc.). We also recognize, however, that climate-related risk in the municipal bond market is not binary and can’t truly be indemnified, though it can be managed. To that end, we are climate risk aware and will make investment decisions and portfolio adjustments accordingly. In the meantime, NEAM will continue to build diversified municipal bond portfolios which, we believe, can weather a degree of climate-related risk.
Key Takeaways
- As a global issue, climate change risk is systemic in the U.S. municipal market
- Natural hazard risk is generally situational and more acute
- Municipal bond debt is more heavily concentrated in states with elevated climate-related risk
- Stakeholders are adjusting (albeit slowly), including state insurance regulators
- Tax premium is much more prevalent than climate premium in the municipal market
- NEAM continues to manage climate risk, as with other investment risks, in a portfolio context
Endnotes
1 IPCC
2 Climate Risk and Response: Physical Hazards and Socioeconomic Impacts. McKinsey Global Institute, 20 Jan. 2020, https://www.mckinsey.com/business-functions/sustainability/our-insights/climate-risk-and-response-physical-hazards-and-socioeconomic-impacts.
3 “The National Risk Index.” Federal Emergency Management Agency, https://hazards.fema.gov/nri/.
4 American Public Power Association
5 2021 Statistical Report. American Public Power Association, https://www.publicpower.org/system/files/documents/2021-Public-power-Statistical-Report.pdf.
6 U.S. Energy Information Administration – Electricity Data Browser
7 ICE BofA US Municipal Securities Index (U0A0)


