
EXECUTIVE SUMMARY
In this issue, we examine the enterprise profile and investment characteristics of U.S. workers’ compensation (WC) insurers, drawing comparisons with the broader U.S. property and casualty (P&C) industry. Our analysis reveals that over the past decade, WC insurers have recorded lower investment income (expressed as a percentage of invested assets) compared to the broader industry. This divergence primarily results from differing appetites for risk assets between the two groups. When analyzing the fixed income portfolios, commonalities emerge between WC insurers and the industry, with both groups displaying comparable durations and credit qualities. Capitalizing on the recent high-interest-rate environment, WC insurers have matched the industry’s performance in fixed income returns, achieving a nearly identical level of book yield by the end of 2022.
SCOPE OF ANALYSIS
We use the WC composite of 57 firms that primarily or exclusively underwrite WC insurance (excluding excess WC) among the companies which meet certain size criteria.1 The WC composite is compared to a U.S. P&C industry composite of 435 companies that underwrite all P&C lines of business, excluding the ones in the WC composite. Berkshire Hathaway (BRK) is generally excluded from the P&C composite to avoid the company’s dominance over the industry statistics. However, when BRK is included in the analysis for comparison, it is stated and labeled accordingly. All exhibits use statutory filing data as of December 31, 2022, from S&P Capital IQ Pro, supplemented by data from sources such as NEAM Analytics, Bloomberg, and ICE BofA.
WC COMPOSITE’S ENTERPRISE PROFILE
Similar Investment Leverage and Lower Premium Leverage with Higher Reserves-to-Premium Ratio
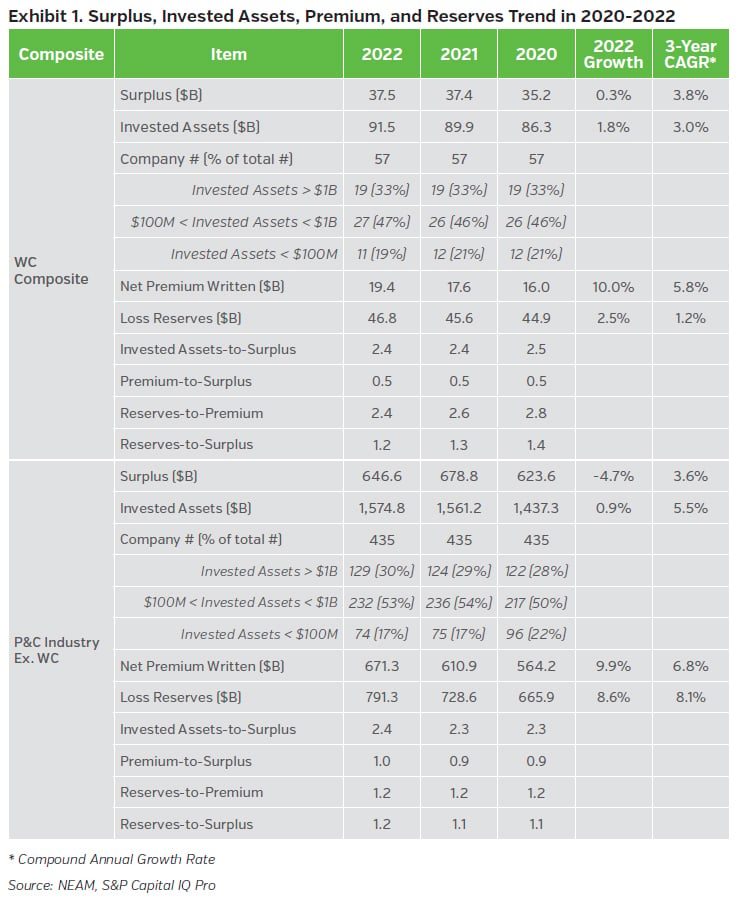
Exhibit 1 compares the statutory surplus, total invested assets, net premium written, and loss reserves between the WC composite and the P&C industry over the past three years. As of year-end 2022, the WC composite has a level of investment leverage (invested assets-to-surplus ratio) comparable to that of the P&C industry. While the WC composite’s premium leverage (premium-to-surplus ratio) is well below that of the P&C industry, it boasts a higher reserves-to-premium ratio (a proxy for reserve duration). This results in the reserves-to-surplus ratios of the two composites being on par. The WC composite saw a slight increase in statutory surplus in 2022, contrasting with a 4.7% decrease experienced by the rest of the P&C industry. Outside surplus, the WC composite has lagged the P&C industry in the growth of invested assets, premiums, and reserves over the past three years.
A LOOK AT THE WC COMPOSITE’S ASSET CHARACTERISTICS
Net Investment Income Trails the P&C Industry
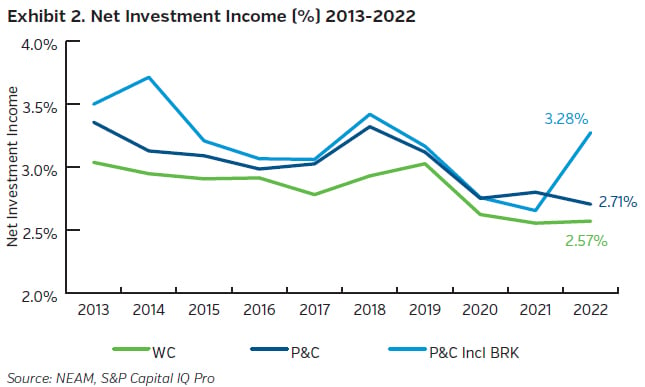
Exhibit 2 displays the net investment income (as a percentage of total invested assets) of the WC composite and the P&C industry. While the WC composite consistently has trailed the P&C industry over the past decade, this gap has narrowed to just 14 bps in 2022. Notably, the inclusion of BRK (sky blue line) in the P&C industry contributes to higher and more volatile net investment income due to the company’s unique investment strategy and vast portfolio size.
More Allocations to Fixed Income & Less to Equities & Alternatives
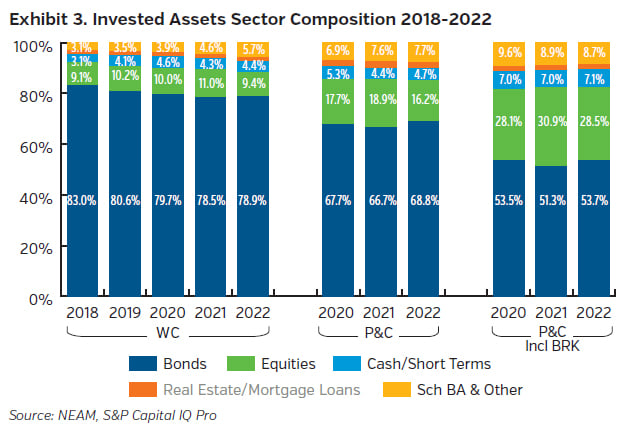
Exhibit 3 illustrates the asset allocations of the WC composite versus the P&C industry. The WC composite consistently favors fixed income over equities, with a gradual increase in Schedule BA assets, albeit remaining below P&C industry allocations as of year-end 2022. This distinction becomes even more evident when including BRK in the P&C composite. In 2022, all three composites saw a decline in equity allocations, reflecting the overall downturn in the equity markets.
Lower Risk Assets as a Percentage of Surplus
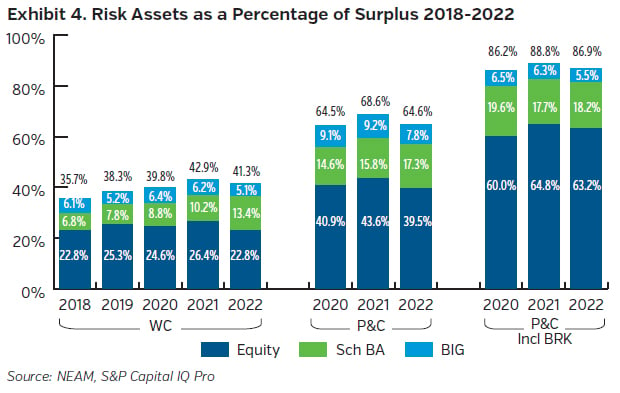
We categorize equities, fixed-income assets with ratings below investment grade (<BBB) and Schedule BA assets as risk assets. Exhibit 4 presents risk assets as a percentage of surplus for both the WC composite and the P&C industry. As of year-end 2022, the WC composite had risk assets amounting to 41.3% of surplus, which was significantly lower than the industry’s 64.6%. This difference is primarily driven by large carriers (those with invested assets over US$1B) in the P&C industry, who have a greater appetite and capacity for risk assets compared to those in the WC composite. The most substantial difference is observed in equities, both on an absolute and relative basis. The inclusion of BRK elevates the P&C industry’s risk asset allocation to above 85% of surplus, further highlighting the contrast between the two composites.
Book Yield Closely Trailing Industry
As illustrated in Exhibit 5, the WC composite’s fixed income portfolio exhibited lower book yields compared to the P&C industry until 2020. However, during 2021 and 2022, WC writers have narrowed the gap, bringing the average book yields of both groups to nearly identical levels. Remarkably, 2022 marked the first instance since 2018 that both groups witnessed an uptick in book yields, as insurers reinvested in higher market yields – an outcome of the Federal Reserve’s repeated rate increases that year. In contrast to equities and other risk assets, the inclusion of BRK had only a marginal impact on the P&C industry’s fixed income portfolio, resulting in no material deviation in book yield.
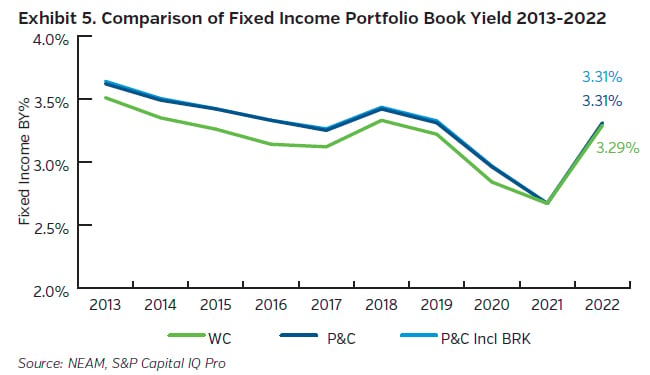
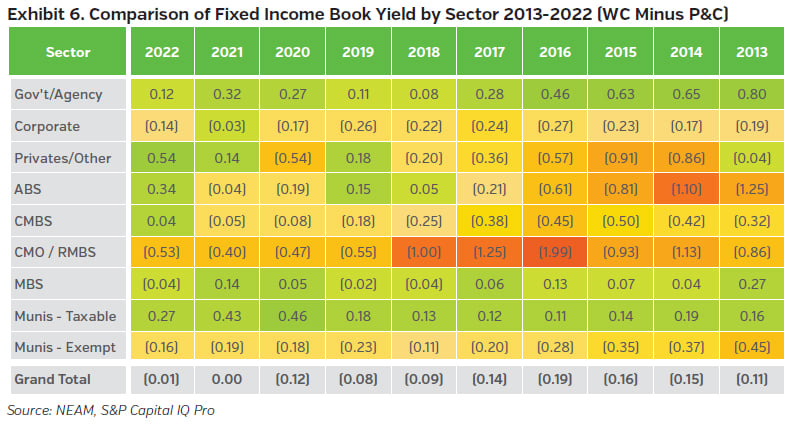
Exhibit 6 illustrates the difference in fixed income book yields between the WC composite and the P&C industry, broken down by sector. Green (red) cells indicate years and sectors where the WC composite performed better (worse) than the P&C industry. The P&C industry most significantly outperformed in the collateralized mortgage obligations/residential mortgage-backed securities (CMO/RMBS) sector, whereas the WC composite consistently performed better in the government/agency and taxable municipal sectors. The asset-backed securities (ABS) sector, with its recent increases in book yield and sector allocation, was the primary driver in elevating the WC composite’s book yield to the industry level.
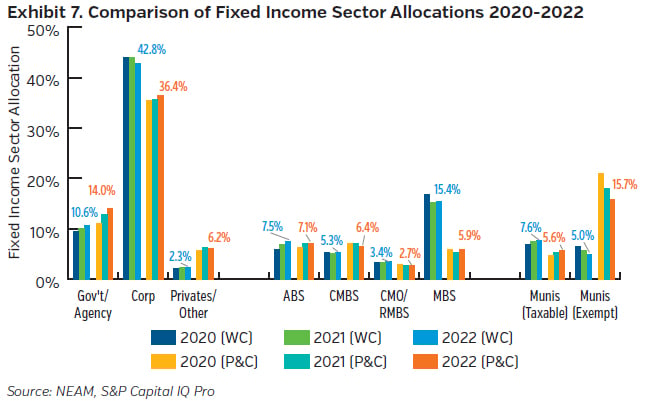
Overweight Mortgage-Backed Securities & Underweight Tax-Exempt Municipal Bonds
The fixed income sector allocations for the WC composite and the P&C industry are shown in Exhibit 7. A key difference is the WC composite’s materially smaller allocations to tax-exempt municipal bonds compared to the P&C industry. This can be attributed to the substantial presence of state-run or state-funded writers in the WC composite who, being already tax-exempt, have little incentive to invest in this sector. Conversely, the WC composite has had larger allocations to mortgage-backed securities (MBS) and corporate bonds than the P&C industry. Recently, both the WC composite and the P&C industry have increased their holdings in government/agency bonds while reducing investments in tax-exempt municipal bonds.
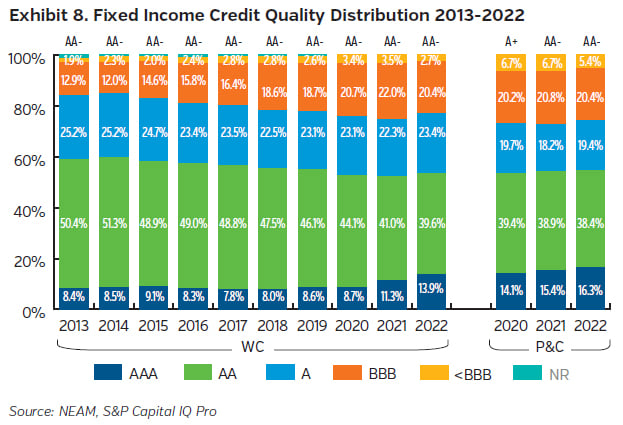
Similar Credit Quality to the P&C Industry
Exhibit 8 displays the trends in credit quality of fixed income portfolios for the WC composite and the P&C industry.2 Over the past decade, the WC composite has reduced its allocations to ‘AA’-rated bonds and increased its holdings in ‘AAA’ and ‘BBB’-rated bonds. As a result, by the end of 2022, the credit quality distribution of the WC composite closely resembled that of the P&C industry. Recently, both groups increased their allocations to ‘AAA’-rated bonds, capitalizing on increased rates from sectors such as asset-backed securities (ABS). The average credit rating remained stable at ‘AA-’ for the WC composite and within the ‘A+’ to ‘AA-’ range for the P&C industry. The P&C industry has allocated more to bonds with ratings below investment grade (<BBB) compared to the WC composite.
Duration Recently Deviated from the P&C Industry
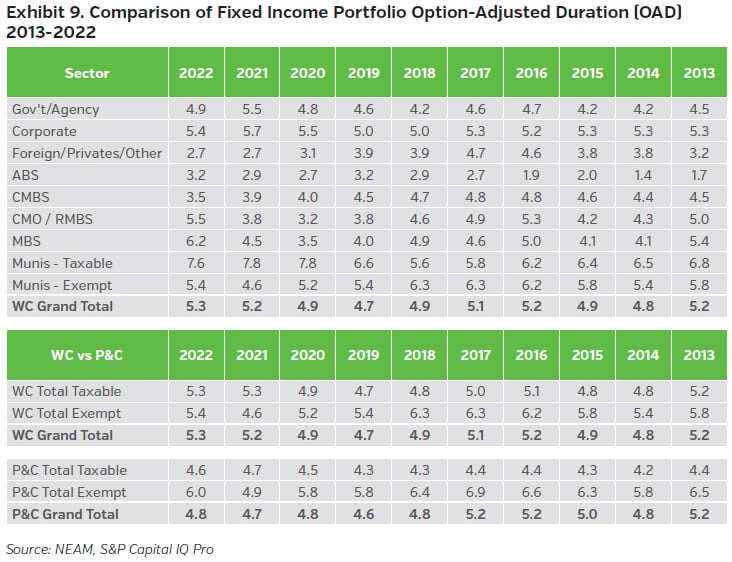
Exhibit 9 illustrates the option-adjusted duration (OAD) by fixed income sector, comparing the WC composite and the P&C industry. Until 2020, the WC composite’s OAD closely mirrored that of the industry, but a shift occurred in 2021 when the WC composite extended its taxable OAD from 4.9 to 5.3 years. Since then, the WC composite has further extended its OAD in sectors such as MBS, CMO/RMBS, and tax-exempt municipal bonds. As of year-end 2022, the OAD of the WC composite was 5.3 years, 0.5 years longer than that of the P&C industry. Despite this recent increase, the question arises regarding whether this gap is substantial enough to fully account for the inherently longer-tailed nature of the WC business. As examined earlier in Exhibit 1, the WC composite has a reserves-to-premium ratio (a proxy for reserve duration) that is twice as high as that of the P&C industry. This supports the notion that P&C insurance companies manage their fixed income OAD almost independently from their insurance business, which will be explored in detail in an upcoming Perspectives issue.
KEY TAKEAWAYS
We used a composite of WC writers to represent their overall enterprise profile and compared that with the rest of U.S. P&C industry to explore differences in their investment decisions. Some key takeaways from this analysis:
- The WC composite, when compared to the P&C industry, exhibits similar investment leverage, lower premium leverage, and a higher reserves-to-premium ratio (a proxy for reserve duration).
- The WC composite’s net investment income (%) has consistently been lower than that of the P&C industry, primarily due to its relatively lower allocations to risk assets.
- Although the WC composite was previously trailing the P&C industry in fixed income book yield, recent improvements in sectors such as ABS have closed this gap.
- Regarding fixed income sectors, the WC composite is overweight in MBS and underweight in tax-exempt municipal bonds relative to the P&C industry.
- The fixed income credit quality of the WC composite aligns with that of the P&C industry, but with lower allocations to ‘AAA’-rated and below investment grade bonds.
- The fixed income durations of WC writers and the rest of the industry remained consistent historically and have only recently begun to diverge, despite the significant difference in reserving patterns between the two groups.
Endnotes
1 Invested assets over US$50M as of December 31, 2022 and net written premium in 2022 over US$10M.
2 Starting from 2020, the NAIC credit rating reporting expanded from six to 20 categories. The NR category shown for 2019 and prior years consists mostly of true private placement securities.


