
Executive Summary
This issue of Perspectives discusses implications of investment choices as non-life insurers in the U.S. consider different measures of return and risk. Traditional accounting measures of investment performance such as yield and price return are generally intuitive, but alone may not provide a complete understanding of the risk and return characteristics of a portfolio.
When asset allocation decisions are evaluated using accounting return measures alone, opportunities and their underlying costs may not be fully appreciated. Some insurers are particularly sensitive to income stability from their invested assets. Others are equally concerned about price gains or loss of the portfolio. A common measure for risk is standard deviation of those returns, which evaluates upside and downside variation. Yet for some insurers, the downside (negative return) possibility of their portfolio is the concerning risk. Although, all of these measures of risk and return may be relevant considering yield-driven total returns.
We will discuss how different metrics meant to measure the same thing can affect investment outcomes in different ways. This will show how various measures of success or costs can lead to investment choices that are statistically optimal, but not universally viable given different operational preferences among insurers.
Accounting versus Economic Portfolio Return and Risk
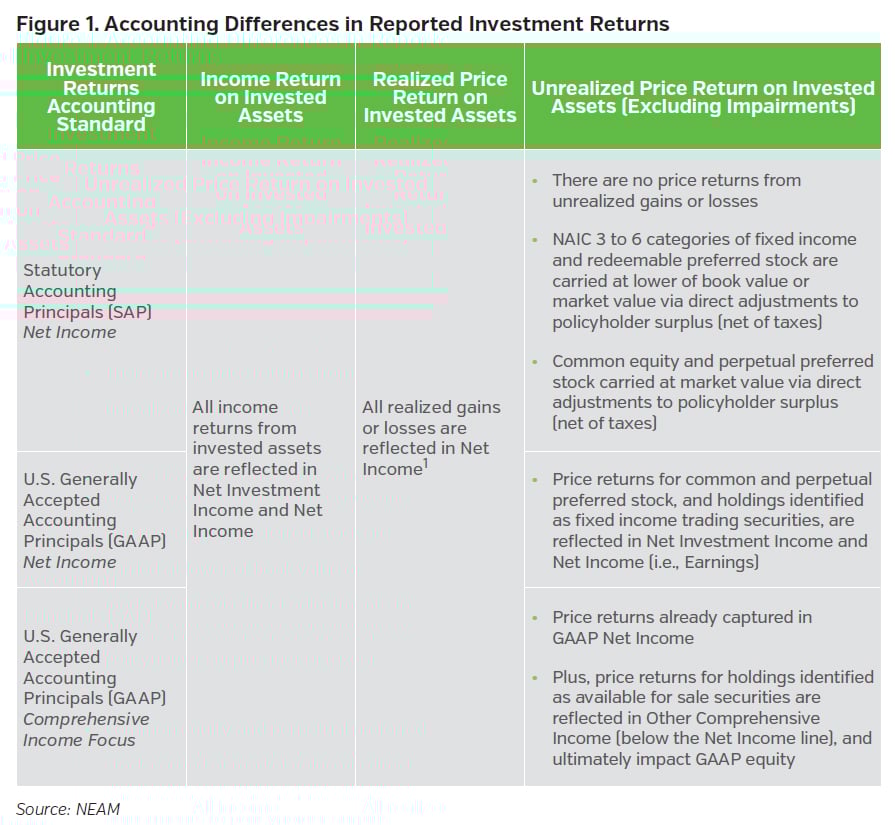
The periodic yield generated from invested assets of U.S. non-life insurance firms is a key contributor of return on assets and capital. While the relevance of the price return component of return on assets and capital depends on the accounting or economic focus of the insurer. Mutual insurers may focus on Statutory Accounting Principles (SAP) and the investment income contribution to Net Income. Public insurers are required to file U.S. Generally Accepted Accounting Principles (GAAP) statements which capture investment returns differently from SAP for Net Income purposes when considering holdings of common and preference shares. Moreover, some GAAP filers focus on Comprehensive Income to assess the total return of investments. Each of these three will define reported investment returns in different ways. And, to the extent that these different return definitions are used for portfolio optimization, the positioning and composition of portfolios will be different over time.
Figure 1 shows high level accounting differences in investment returns within Net Income or Comprehensive Income for SAP and GAAP.
For our discussion, we classify three non-life insurer types. Insurer S is a U.S. mutual insurer who is only concerned with investment returns as defined by SAP net income statements. Insurer GN is a U.S. stock insurer who files GAAP financials and is focused on GAAP net income. Insurer GC is also a U.S. stock insurer filing GAAP financials, but given certain stakeholder expectations is focused on Comprehensive Income. The operational characteristics which apply to each insurer are summarized in Figure 2.
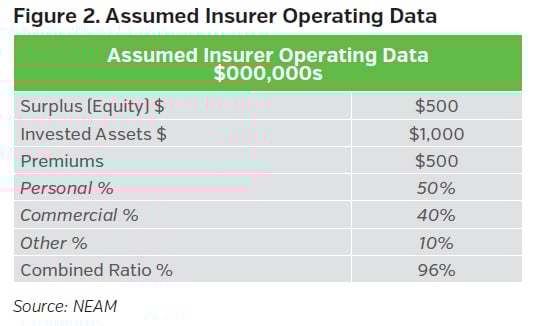
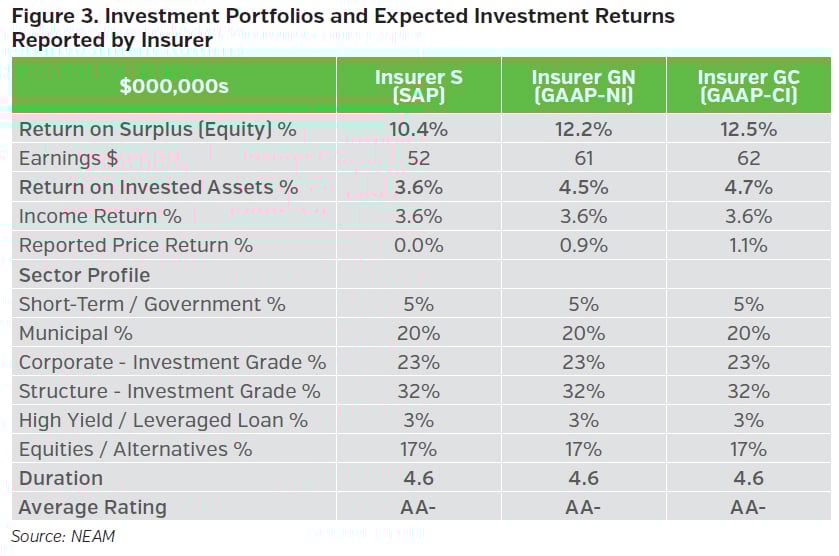
Figure 3 provides summary statistics of the investment portfolios and expected investment returns for the three insurers. Each holds the same starting portfolio of assets. We use monthly return time series data of indices representing portfolio securities from December 1997 to December 2019. From this we estimate average (expected) monthly returns and volatilities. For simplicity we make the strong assumption that GAAP equity and SAP surplus are the same for each insurer.2 Each insurer has a 21% effective tax rate. Although each portfolio has the same underlying economics, they have different reported returns due to account definition differences of how investment price returns are reflected in SAP, GAAP Net Income (GAAP-NI), and GAAP Comprehensive Income (GAAP-CI).
Accounting Returns and Economic Volatility
What about the economic volatility or risk? Consider Insurer GC’s GAAP-CI total price and income returns focus. A time series of Insurer GC’s portfolio would recognize the total income and total price return variation over time. In contrast Insurer S’ SAP return time series of the same portfolio would recognize only income returns as noted in Figure 1 above.3 Volatility estimates based on the SAP return time series may understate the total variation inherent to the portfolio since price variation is largely excluded.
Insurers may define investment returns differently dependent on accounting definitions, but we presume that each insurer would have a singular definition of the volatility associated with total return across all assets. We also presume total return variation inclusive of income and price variation for all assets, and call this economic volatility. This is consistent with how rating agencies and regulators measure investment risk within their capital models4 – e.g., AM Best’s Capital Adequacy Ratio (BCAR). Moreover, economic volatility may be more appropriate when considering downside risk measures, such as (Tail) Value-at-Risk or (T)VaR. (T)VaRs are assessing potential severe portfolio or capital loss considering expected total income and price returns and economic volatility, where portfolio positions may need liquidation to service obligations at inconvenient times.
Evaluating Risk Adjusted Return Estimates
Risk-adjusted performance measures, such as the Sharpe ratio provide an intuitive measure of return per unit of risk, such as the standard deviation inherent to that return. This “risk context” serves as an anchor to level set characteristics underlying a return across security types. It provides insight into the compensation of risk that a security or portfolio affords at a point in time. Without risk context the perspective of certain opportunities could be incomplete. There are several risk measures in addition to standard deviation that can be considered – e.g., (T)VaR, drawdowns, required regulatory or rating agency capital, or simply a probability of a negative return. Joint use of these measures fosters a richer awareness and appreciation of asset and portfolio performance.
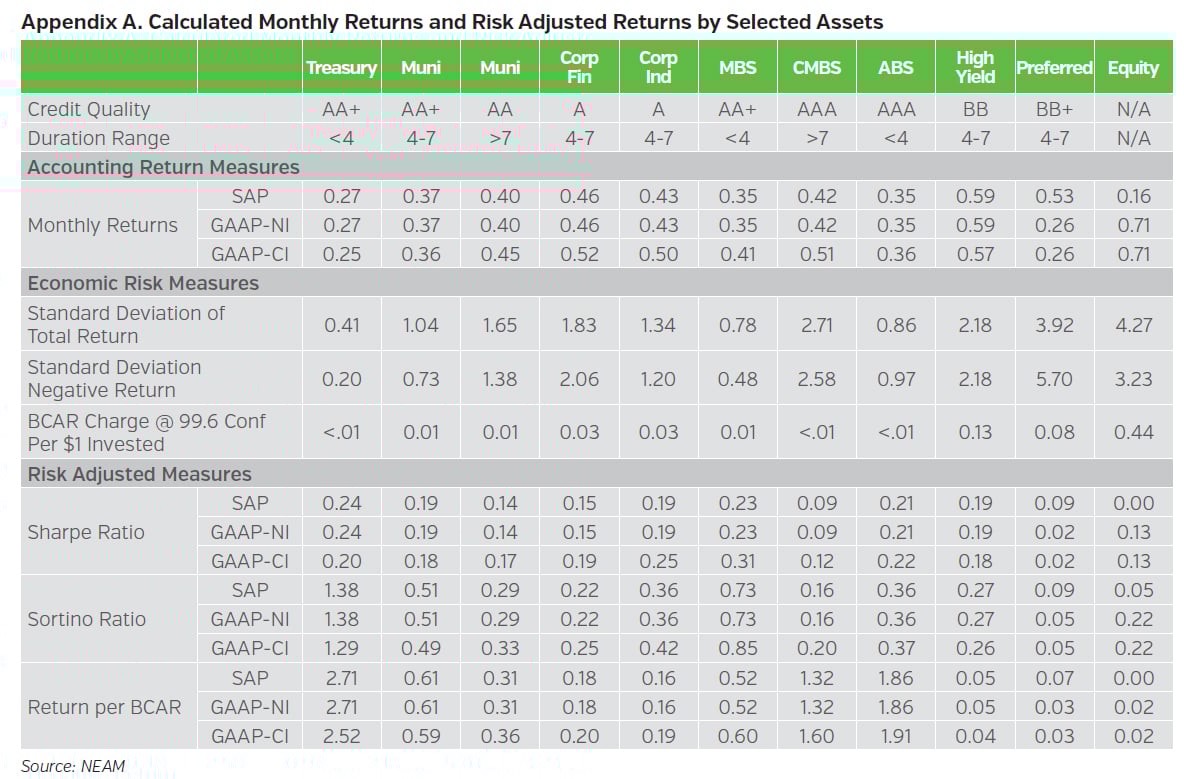
For illustration we select 11 asset types across different sectors that we find are typical for an insurer’s investment portfolio. These include different sectors, credit ratings and durations. We use the same monthly return time series data and statistics used for Figure 3 to estimate returns and risks for these assets.
We also calculate three types of risk-adjusted returns. First, we calculate Sharpe ratios. The Sharpe ratio measures the investment return (SAP, GAAP-NI, GAAP-CI) less a risk-free rate,5 divided by the standard deviation of economic volatility of all returns. Next, we calculate Sortino ratios. Sortino differs from Sharpe as is it considers returns less a minimum requirement, divided by the negative return variation of an asset’s economic volatility. It considers the investment return6 (SAP, GAAP-NI, GAAP-CI) divided by the deviations of negative economic volatility (i.e., negative returns only). Finally, we estimate investment-related BCAR charges at the 99.6% confidence level by asset type, and the respective accounting return divided by those charges. We then rank order7 the accounting returns and risk-adjusted returns for each asset. One is the highest and 11 the lowest for each category.
Figure 4 shows a heat map based on these rankings for each asset. The top tier are in green, mid-tier yellow and bottom-tier orange. (See Appendix A for the calculated values underlying the rankings.)
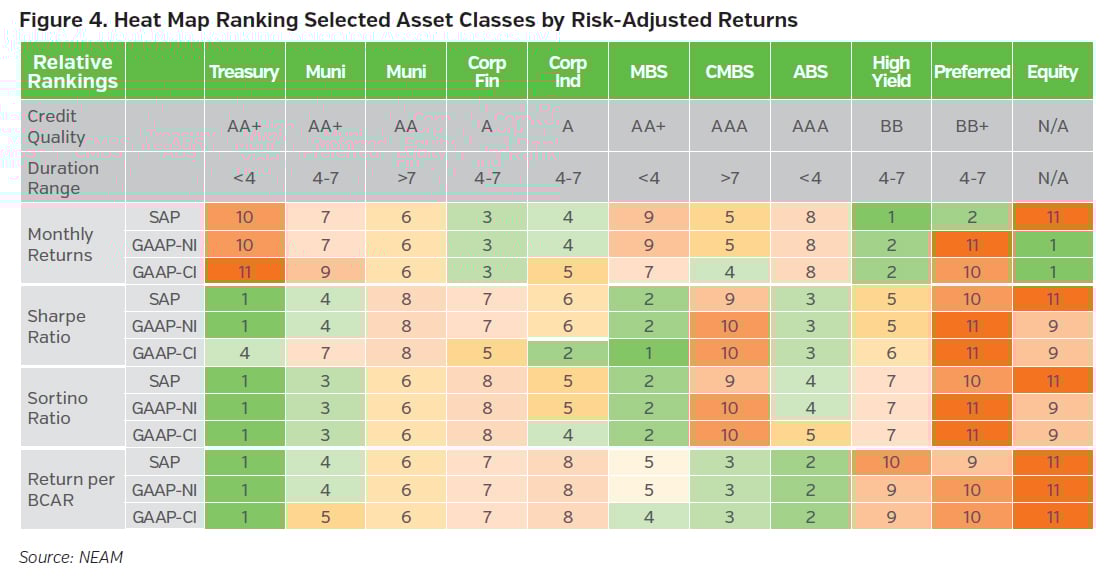
Navigating several metrics for returns and risk can be daunting. Heat maps such as Figure 4 may be a useful heuristic to identify opportunities and how they compare to risk preferences in a holistic manner. Assets that generally rank favorably across all measures indicate attractive qualities. While assets that have dramatic swings in rank positions or consistently rank less favorably may warrant higher levels of scrutiny and caution. For instance, in this illustration, treasuries consistently rank highest with most risk-adjusted returns, but would offer relatively low income or total returns compared to other assets. In contrast, equities have high GAAP returns, but are relatively less attractive on a risk-adjusted basis, while corporate industrials generally fall in the middle range of most relative rankings. Understanding these tendencies leads to more informed decision making as benefits (returns) are measured against their costs (volatility, capital charges, negative returns, etc.).
Enterprise Based Asset Allocation™ Process
The Enterprise Based Asset Allocation™ (EBAA™)8 process can be a powerful framework to evaluate different investment strategies, underwriting scenarios or general capital management considerations. It considers risks and returns of investments and insurance jointly, and their combined impact to capital. EBAA™ analysis can evaluate opportunities from an accounting and economic lens and compare opportunity differences, including the risk contexts mentioned above. Also, any diversification benefits across assets, as well as assets and liabilities, may become relevant, which is reflected in Figure 4 above.
For illustration, we employ the EBAA™ process with the aim of optimal strategic asset allocation considerations for Insurer S, Insurer GN and Insurer GC. We use the same data as Figures 2, 3 and 4, and include observed correlations over the period. To isolate the impact of different investment return definitions, we hold premiums and underwriting results constant. Reasonable constraints for ranges of credit quality, duration, risk assets and portfolio turnover are applied equally to each Insurer. The optimization objective is to maximize return on equity (or surplus) considering each insurer’s accounting definition of investment return, minimize economic volatility of earnings, and cap the 99.5% T-VaR to the existing 25%. We show two price returns for each Insurer – price return based on the insurer’s respective accounting definition and the economic price returns based on the assets total price return. No insurer has realized gains or impairments. Figure 5 summarizes key results.
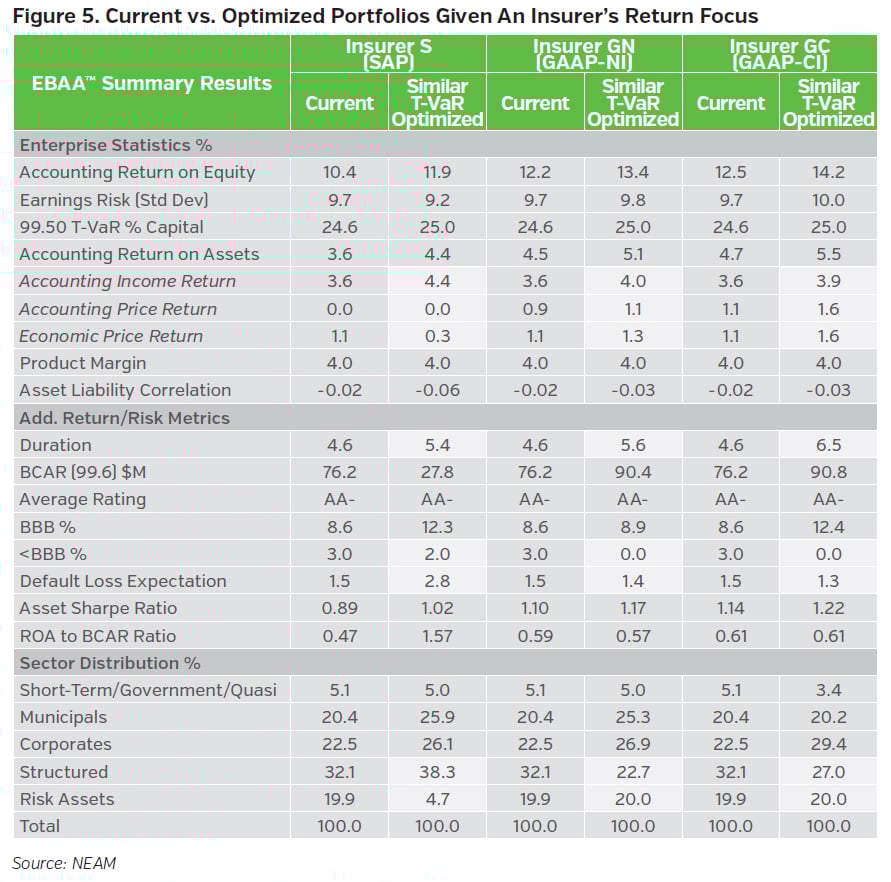
We cannot emphasize enough that current and projected capital market conditions should be considered with any EBAA™ process. Historical data alone may not provide a full understanding of risk and return expectations and opportunities, given prevailing interest rates levels and spreads and other economic factors. However, considering the historical data used in this illustration, Insurer S’ portfolio generally gravitates toward assets with the highest income potential, ignoring the price impact of any asset.9 Insurer GN prioritized income as well, but recognizes some of the expected price appreciation of equities and alternatives. While Insurer GC’s portfolio is agnostic to income versus price, and gravitates toward assets with the highest total return potential regardless of the source of that return. Other takeaways:
- Income versus price: Sometimes there are trade offs between them. An income only focus may overlook the total price and income return potential that any asset provides. Alternatively, the potential adverse price change of fixed assets as spreads widen or rates rise is not a factor when income is the sole focus.
- Duration: All portfolios are willing to extend duration. The GAAP-CI return portfolio extends duration the most, welcoming more of the price return potential of longer dated assets. The data set includes several years of falling rates, so this is expected.
- Credit: All portfolios were kept at average ‘AA-’quality. Insurer S’ focus on income, including from high yield assets, outweighs the higher credit default expectations this affords compared to Insurer GN and Insurer GC portfolios.
- Risk assets: We define risk assets as <BBB fixed income, common stock, preference shares, and alternatives. As price is recognized as part of the return calculation, risk asset allocations grow. For example, in the data set used equity’s price return is 70% to 75% of its total return, alternatively an intermediate ‘A’ rated Corporate Industrial’s price return is less than 20% of its MTM total return. It is part of the reason why Insurer S’ risk asset allocation drops significantly, and is the only insurer to retain ‘<BBB’ rated risk assets.
Despite the portfolio differences each outcome is optimal in its own regard, but not universally viable. Viability is dependent on an insurer’s unique risk and return preferences.
Key Takeaways
Insurers must navigate accounting and economic realities of their business, and the associated metrics used to measure these realities. Sometimes these are not aligned, and insurers are faced with a sort of metric roulette. They must choose among several measures those which are most appropriate for their operational needs and stakeholder expectations. We discussed just a few examples:
- Accounting treatments – e.g., Statutory, GAAP Net Income, GAAP Comprehensive Income
- Return measures – e.g., income returns versus price returns
- Risk definitions – e.g., volatility, downside potential, capital-at-risk, risk-based capital
- Risk-adjusted performance metrics – e.g., Sharpe ratio, Sortino ratio, returns vs. BCAR charge
NEAM’s investment management approach employs a yield-driven total return strategy. This is predicated on understanding the needs and objectives of our clients. Our proprietary Enterprise Based Asset Allocation™ (EBAA™) methodology facilitates that understanding. We partner with our clients to assess their overall risk profile and capital sensitivities as we seek to determine an optimal and viable investment strategy. It reflects risk and total return metrics that we believe are appropriate and supportive to the operational objectives of the client, not simply model-driven statistically optimal outcomes.
This “one size does not fit all” approach helps support a client’s unique preferences, including how those preferences are measured, are fully appreciated as investment opportunities are evaluated. Outcomes that compliment an insurer’s long-term objectives, align with its stakeholder expectations and complement its enterprise risk and capital management are identified as a result.
NEAM’s portfolio management tools utilize deterministic scenario analysis to provide estimates of total returns and other portfolio metrics herein based on the prospective application of certain assumptions. No representation or warranties are made as to the reasonableness of these assumptions. Projected results are for illustrative and informational purposes only and do not represent actual accounts or trading and may not reflect the effect of material economic and market factors. Clients will experience different results from any projected information shown, including the potential for loss. Results shown are not a guarantee of performance returns.
Endnotes
1 It is worth noting that property and casualty insurers recognize all realized gains and losses immediately through Net Income, while life insurance companies are required to amortize non-credit realized gains and losses over the remaining life of the asset.
2 SAP surplus and GAAP equity are usually different for U.S. insurers. One reason is that SAP surplus does not adjust market values for assets held at book value, such as an ‘A’ rated bond. Under GAAP accumulated unrealized gain(loss) of the same ‘A’ rated bond is reflected as part of equity capital.
3 One might also consider defaults and impairments.
4 Examples: 1) AM Best’s interest rate risk charges (B3) in BCAR, 2) S&P Global Ratings’ Insurance Capital Model asset-liability management charges, 3) Solvency II interest rate component of the market risk module charges.
5 We use the three-month T-bill monthly return from December 1997 to December 2019 as a proxy of the risk-free rate.
6 The Sortino ratio definition also includes a minimum return adjustment to the total return time series. We assume a 0% minimum return is required for this illustration.
7 This is equivalent to a Likert scale and does not account for degree of difference, only that one asset has a higher or lower number compared to other the assets for each metric.
8 A broader discussion of NEAM’s Enterprise Based Asset Allocation™ (EBAA™) process is within NEAM’s September 2016 Issue of Perspectives entitled “Considering Opportunities in Low Return, Uncertain Environment – An Enterprise View.”
9 As noted the impact of unrealized price change of assets are not reflected in net income, but for some assets price change results in a direct adjustment to surplus under statutory accounting.


