
The second quarter of 2018 exhibited a much steadier overall rhythm than the eventful cadence evidenced earlier in the year. Volatility, while still below long-term averages, normalized and enabled the market to return 3.4% in aggregate for the quarter. The market had advanced within 3% of its all-time high by mid-June before trade tensions caused an uptick in volatility and a fade in price momentum. Trade tension also manifested itself in the currency markets as the U.S. dollar strengthened, correspondingly weakening the Euro and many emerging market currencies. The U.S. market fared better than the rest of the world in this backdrop evidenced most notably by China’s Shanghai Composite Index falling into a bear market. Outside of trade, the resurgence in the energy complex impacted market performance. Amid the rally in oil prices, energy finished the quarter as the best performing sector, reversing its laggard position from Q1. Technology continued its leadership role, powered by strong performance in several secular growth names.
While the equity market remained near its highs, the messaging from the bond market felt more cautious. The yield curve continued to flatten with the U.S. Treasury 2s-to-10s spread closing the quarter at 33 bps, a differential not seen since 2007 and roughly half the level which prevailed at the turn of the year. Likewise, investment grade credit spreads have widened approximately 40 bps from the tights seen in January, a notable move magnified by M&A driven supply in the first half of the year. While the yield curve may, in part, be distorted by front-end Fed policy normalization and back end foreign monetary policy divergences, the level and steepness of the yield curve is nonetheless unsettling. Fixed income markets appear to be pricing a different path of economic growth and lack of sustainability of the robust earnings gains relative to the sentiment of the equity market.
At the midpoint of the year, the S&P 500 index had gained 2.6%, outpacing returns for the U.S. Treasury and corporate bond markets, cash and gold. The U.S. performance compared favorably to other geographies in U.S. dollar terms as it was the only major region to post gains year-to-date, with the rest of the world contended with larger implications from a trade war, political uncertainty in Europe and decoupling global monetary policies. The performance of the S&P 500 was bested by the gains of the technology-centric NASDAQ and the Russell 2000 given its small cap, domestic focus.1
Trade tension has obscured the fundamental strength of the market making its trajectory more difficult to ascertain. The market’s dynamic messaging is akin to a kaleidoscope in which the interlocking pieces and prisms create unique but related views. One might simplistically conclude that its symmetric nature leads each person to see approximately the same thing, but in reality the motion of the crystals results in an ever-changing view which is largely subjective. Beauty is in the eye of the beholder, a parallel seemingly relevant to the way that the capital markets perceive risk at any given time. Although consensus is often the easier path, greater circumspection is needed to understand whether risk is adequately priced in the market. While rosy to the masses, the current kaleidoscope feels more characteristic of a late cycle, momentum-driven environment where risks are underappreciated in our view.
MARKET NARROWNESS
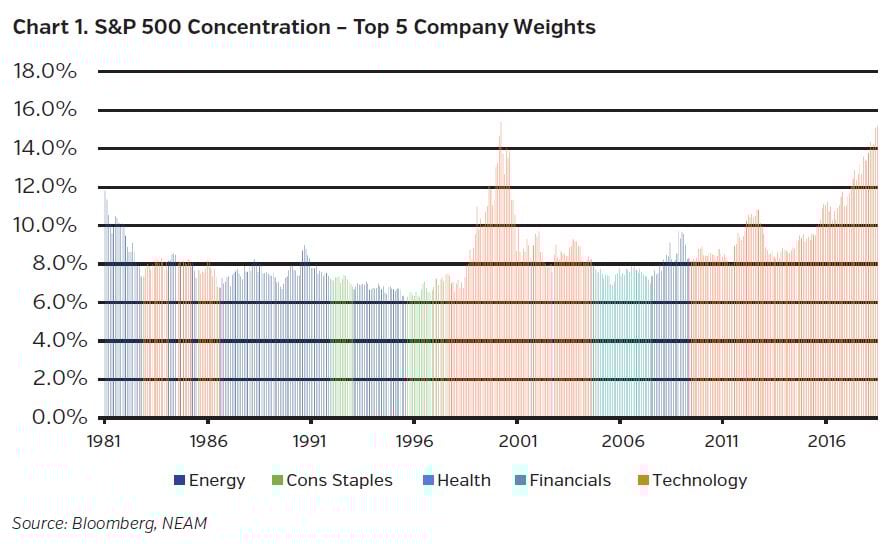
The equity market, defined here as the S&P 500 Index, continues to exhibit narrowing leadership with gains concentrated in a focused subset of names. This risk is less understood as, almost deceivingly, the overall market return is positive year-to-date while the median stock in the S&P 500 index has recorded a 0.6% loss. Goldman Sachs estimates that Amazon contributed more than one third of the year-to-date gains of the S&P 500 and as few as ten stocks have contributed more than 100% of the market return over the same time period2. While this mathematical exercise does not take into consideration the other side of the equation, meaning the multitude of stocks which are negative on a year-to-date basis, the statistic holds relevance for market breadth which is a proxy for the health of the aggregate price trend. In addition, the top holdings in the S&P 500 now comprise a weighting well above average, albeit not yet to the historic extremes seen at the peak of the more recent Dot-Com bubble (Chart 1). This is another indication of the more limited foundational construct of the market as price appreciation can become self-reinforcing for the largest constituents leaving most of the market in their wake.
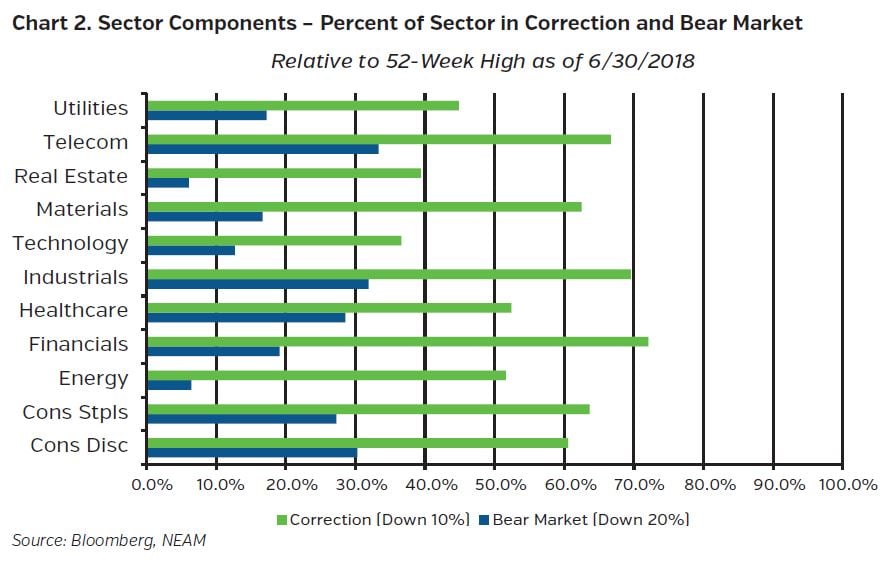
When examined on a sector basis, the market is already well within a corrective mode (Chart 2). Eight of the eleven sectors illustrate this point exposing that the stock price of over half of its constituents has fallen greater than 10% from recent highs. Technology is the healthiest sector on this basis while financials, industrials, telecom and consumer staples reflect more controversy. There are several sectors which have already suffered significant dislocation with close to one third of constituents trading down 20% or more relative to fifty-two week highs. These sectors approach 40% of the market’s weighting collectively. Suffice it to say, due to the aggregate advance, the market is perceived to be healthier than reality, as hints of a stealth bear market appear underneath.
SMALL CAP EUPHORIA
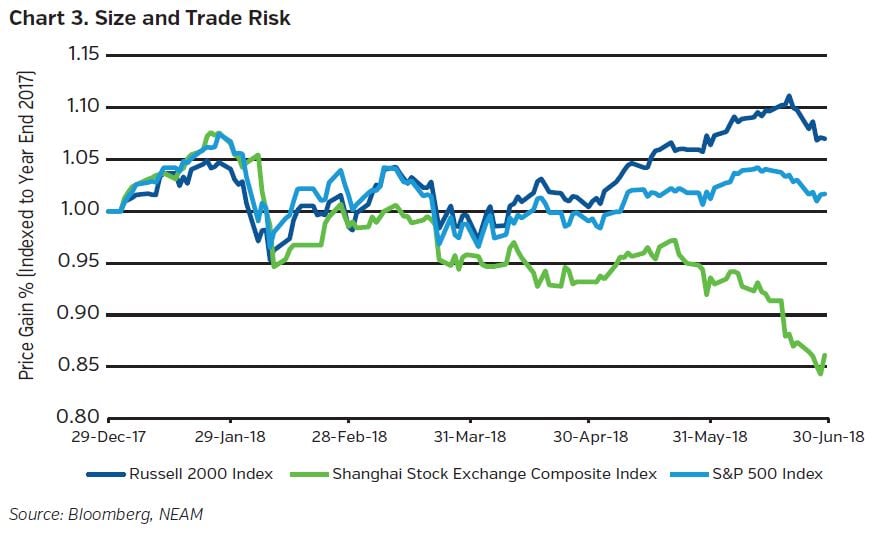
Trade remains a large risk for the equity market given its relevance to economic growth and earnings potential. This is no more evident than in the diverging performance of domestic large and small cap stocks in the quarter. The Russell 2000 Index commandingly outpaced its large cap brethren due to its relative insulation from the impact of foreign trade and its domestic sales orientation, which shelters it from the higher dollar (Chart 3). As also shown in Chart 3, small cap equities exhibited almost the exact mirror image of the action in the Chinese stock market during the quarter further emphasizing the safe haven halo which small cap currently adorns. Risks appear understated as small cap equity pricing leaves little room for error in light of lower credit quality for this business cycle. Per Cornerstone Macro, interest coverage ratios for small cap companies, which represent 11% of the total debt of the S&P 1500, average 3x, near historic lows and less than half the level measured in the 2001-2007 expansionary period3. These stretched ratios may leave these firms adversely exposed to rising rates and tighter liquidity typical of the late cycle backdrop. After this exceptional advance, small cap equities may involve more risk than perceived, another important prism in the kaleidoscope.
Small cap companies also dominate the high yield universe. To this point, the median and average market capitalization of the public constituents in the Bank of America Merrill Lynch Cash Pay High Yield Index approximate $8bn and $3bn, respectively. Similar to the equity market, credit investor risk appetite is strong for these levered entities as evidenced by spread behavior. High yield spreads have narrowed this year while investment grade spreads have widened. The widening narrative can partially be attributed to technical reasons, including repatriation driven selling, M&A induced supply and negative fund flows. While in contrast, high yield continues to benefit from its higher coupon and shorter duration profile supporting demand and mitigating spread weakness.
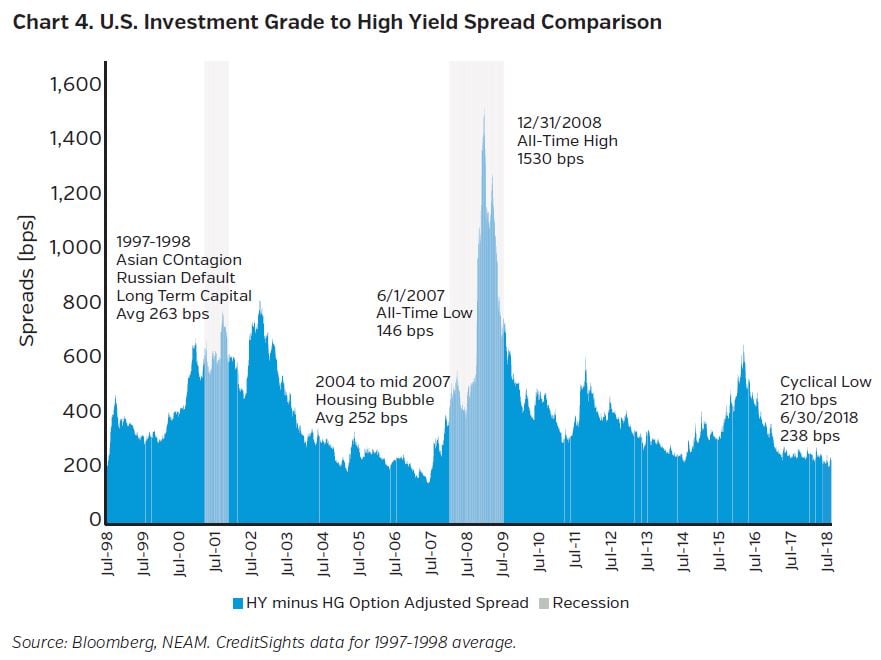
However, this may be too simplistic given the relative compensation for high yield bonds versus investment grade entities. This quality spread differential hit a cyclical low of 210 bps before closing the quarter at 238 bps (Chart 4). Putting these levels into historical context, today’s level remains below the averages achieved in the period leading up to the housing crisis in 2007 and the 1997-1998 Asian Contagion/Russian Default/Long-Term Capital Bailout period4. Fundamentals are good, but valuations already discount these healthy conditions. History shows that these compressed spread periods can be elongated, suggesting that leverage does not appear to be an imminent threat. Conversely, our kaleidoscope depicts this as an underrated risk which bears watching as the cycle extends.
INFLATION
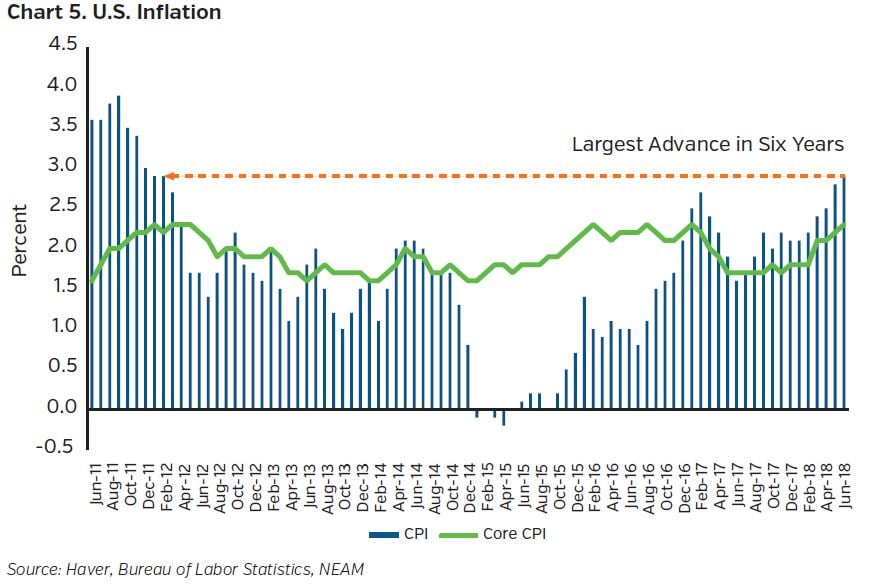
In our view, inflation also qualifies as an underappreciated risk. First, declining inflation volatility in recent years has lowered the surprise threshold, suggesting some vulnerability to even a modest shock. Second, tariffs represent a risk as globalization has enabled the U.S. to import disinflation. Any material change in cost of goods due to protectionism could breed inflation and impede economic growth. While framing this risk is difficult, Ian Shepherdson of Pantheon Macroeconomics, pegs the impact of President Trump’s most recent round of tariffs at a possible 60 bps lift to core CPI within a year5 (Chart 5). Energy prices could also provide an inflationary headwind for consumers with gasoline prices up $0.50 per gallon year-over-year, the equivalent of a $65 billion tax hike.6
While still contained, wage pressure could potentially deliver inflationary pressure resulting from the tightening labor market and diminishing skills base. Average hourly earnings paced 2.7% year-over-year growth in June, modest for late cycle full employment. It remains to be seen if this pace will accelerate given the fact that there are now more jobs than job seekers as evidenced by the Job Openings and Labor Turnover Survey (“JOLTS”) data for May. For context, this ratio stood north of six job seekers per every job opening at the height of the financial crisis. Additionally, the Bureau of Labor Statistics reported a record number of people quitting their jobs, indicating that job hopping stands at its highest rate since 2000. Any sustained rise in labor force participation and continual technology advances could keep structural pressure on compensation. However, should wage growth accelerate and help usher in higher inflation, the Fed could be forced to raise interest rates more aggressively late in the cycle.
CONCLUSION
Earnings momentum feels market supportive and could, perhaps, help indices make new highs before this cycle peaks. However, it may increasingly be achieved within an environment of rising equity volatility and wider credit spreads. Likewise, stock market leadership may continue to narrow, likely further favoring growth stocks. History shows these elements should prove unsustainable as momentum bubbles eventually burst. Nevertheless, they can be very long lived so it is near impossible to decipher the precise timing of this sea change, but as rates rise, there could be incremental pressure on secular growers given the discounted cash flow supporting their valuation level. Likewise, small cap leadership may curtail itself as these companies do not prove to be as insulated from trade issues as hoped, and weakened credit worthiness may assert itself at some point. Trade remains a risk on many fronts, especially with regard to igniting inflation.
The kaleidoscope turns differently for each market participant. Our kaleidoscope shows patterns characteristic of a late cycle, momentum-driven environment while others may see more bullish market messaging. Consequently, our view endorses the defensive elements imbedded in our portfolio positioning that we believe will accrue benefits over a full market cycle. Reversion to the mean, likewise, remains a guiding principle in our investment approach as does a long-term return horizon; both require patience. Since it is virtually impossible to time the market, we continue our focus on risk adjusted returns, remaining cognizant of balancing downside risk with potential reward.
ENDNOTES
1 Bank of America Merrill Lynch, “Global Performance Monitor: Defensives Dominate”, dated July 2, 2018.
2 Goldman Sachs, “US Weekly Kickstart, The Tale of the tape: An Investigation of 1H S&P500 index, sector, stock and thematic performance”, dated June 29, 2018.
3 Cornerstone Macro, “Corporate Leverage: Cracks Beneath The Surface, But Not Yet A Macro Risk”, dated June 28, 2018.
4 CreditSights, “US HY: Moving Parts of Spreads”, dated July 2, 2018.
5 Bloomberg, “Tariffs Lurk Around Corner After Tame June for U.S. Inflation”, dated July 12, 2018.
6 Gluskin Sheff + Associates Inc., “Breakfast with Dave”, dated July 3, 2018.


