Interest rates will rise. Of that we are relatively certain. However, we are less certain regarding the start date, sequencing, severity and the sustainably of the increase. Insurers are accustomed to managing the uncertainty of insurance risks. How should they manage investment risk in an uncertain rising interest rate environment?
First, managements need to take a multi-year enterprise-based review to understand financial statement cash flow dynamics of interest rate changes. Next, they should select among alternative strategies the one offering the most favorable outcomes for key performance metrics. This review process should be simple and not burdened by models with decimal point displays implying levels of precision that do not exist.
Using 2013 industrywide data, we estimate that differences between “optimal” and alternative strategies can exceed 100 basis points of compound growth in book value. We recognize that there will be wide variations among companies, depending upon the “success” of their insurance operations. However, from reviews we have conducted with client companies, we are confident of the broad application in the approach that follows.
Framing the Issue
We assume two alternative prospective interest rate “states.” In the first state, interest rates remain more or less “flat,” rising only 50 basis points over the next five years, not too dissimilar from post “great recession” fluctuations. In the second state, we assume a 300-400 basis point increase, an “up” environment, reflecting both rising rates and curve steepening over the next three years and no rate changes in the two following years.
In each state, we assume modest premium growth, combined ratios in the more recent range of 96-99, stable reserve payout patterns and no acceleration of prospective payout patterns. Incorporating interest rate sensitive underwriting behavior and “normal” or “expected” catastrophe loss levels has little impact upon the rank ordering of alternative investment strategies. However, when stress testing investment strategies, we believe it is imperative to adopt an “enterprise” view incorporating adverse underwriting results simultaneously.
We assume three mutually exclusive fixed income investment strategies:
- Get-short-now. The existing fixed income portfolio is sold and those proceeds and all subsequent cash flows are reinvested in one-to-three year instruments.1
- Investable-funds-go-short. All cash flows are reinvested in one-to-three year instruments.
- Stay-the-course. All cash flows are reinvested to preserve the current duration profile.
Results
We scale the results based upon a starting point of 2013 industry-wide financial statements and cusip level investment holdings.2 We focus upon three performance metrics over the five-year period: cumulative earned investment income; ending GAAP equity and annual compound growth in capital. For each metric there are six potential outcomes; one for each of three possible strategies occurring for each of two interest rate states.
Chart 1 below shows the potential cumulative five-year earned investment income for each strategy for each rate state. For example, if rates were to rise and the get-short-now strategy were executed then earned investment income should total about $195 billion (Column 1). However, if rates were to remain essentially flat, that strategy should yield about $165 billion of cumulative earned investment income (Column 4). The stay-the-course strategy offers the greatest potential income return and the smallest potential return differential between rising and flat interest rate states (Columns 3 and 5, respectively).
Chart 1. Cumulative Earned Investment Income ($ Billions)
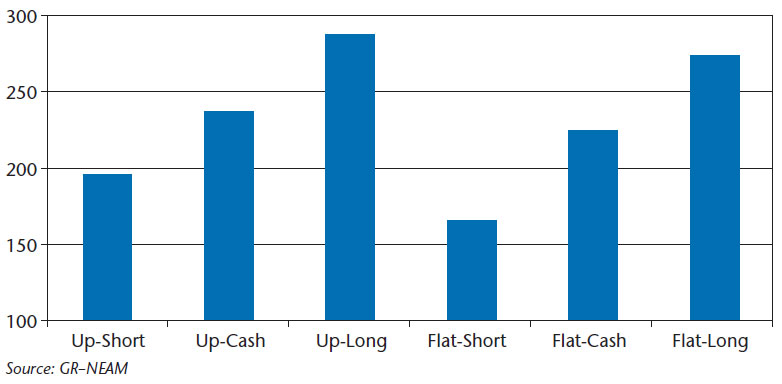
Chart 2 below shows the estimated five-year ending GAAP equity for each scenario. Similar to the results above, the stay-the-course strategy provides the dominant outcome in either rate state. Further, with a get-short-now strategy the penalty in terms of expected GAAP equity at $962 billion (Column 1) versus actual GAAP equity at $939 billion (Column 4) is the greatest of the three alternatives, if in fact rates do not rise.
Chart 2. Ending GAAP Equity ($ Billions)
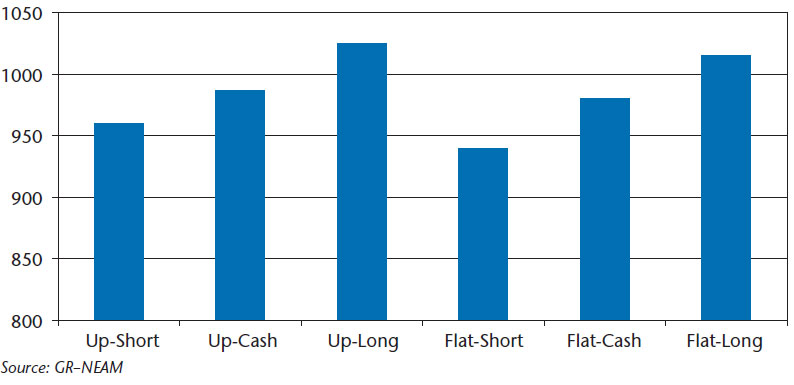
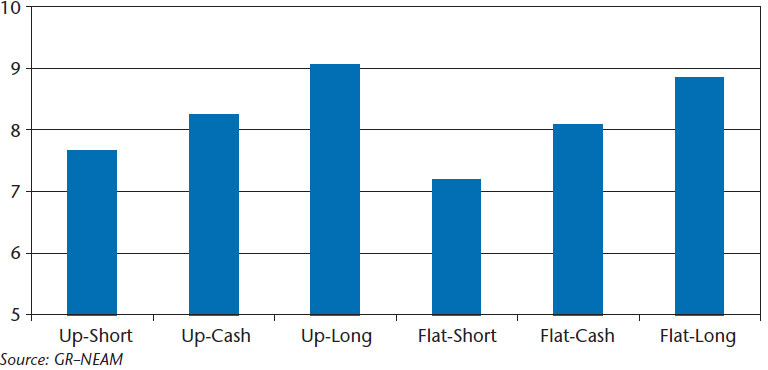
Chart 3 below summarizes the results in terms of potential annualized compound growth of GAAP equity from year-end 2013 starting estimate of approximately $665 billion. The differences between the highest and lowest performing strategy varies from 140 to 170 basis points of annualized growth in equity.
Chart 3. Compound Growth in GAAP Equity
The results in the simple examples above may be enriched by stress testing insurance underwriting results while at the same time examining alternative investment strategies in anticipation of possible interest rate changes. There are two additional financial metrics which bear scrutiny: minimum total annual liquidity and maximum end-of-year unrealized losses.
Chart 4 below displays the minimum total liquidity available in any year during each of the years for the above scenarios. Remember that total liquidity is the sum of operating cash flow and investment maturities and pay downs. By this metric, the get-short-now strategy (Column 1 and 5, respectively) is the dominant strategy.
Chart 4. Minimum Total Annual Liquidity ($ Billions)
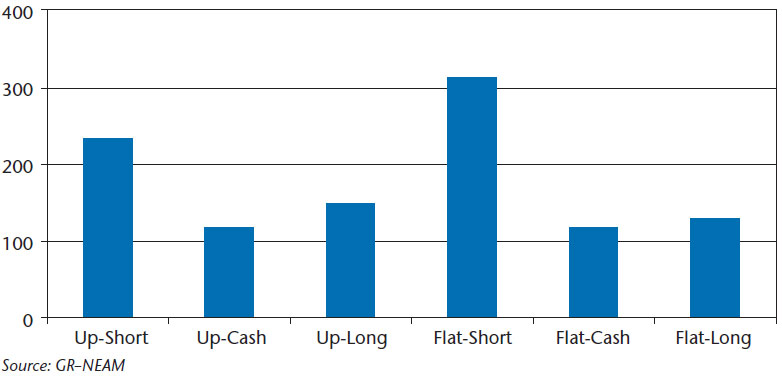
Chart 5 below shows the second stress testing performance metric upon which to focus. As interest rates rise, bond prices fall either to levels of less embedded gain or greater unrealized loss. The magnitude of the valuation change is the amount of the rate change and embedded yield of the portfolio across the portfolio’s term structure. By this metric, the stay-the-course strategy is the least desirable in the event of a rate increase while the get-short-now strategy is the least desirable in a flat environment.
Chart 5. Maximum Unrealized Loss Position ($Billions)
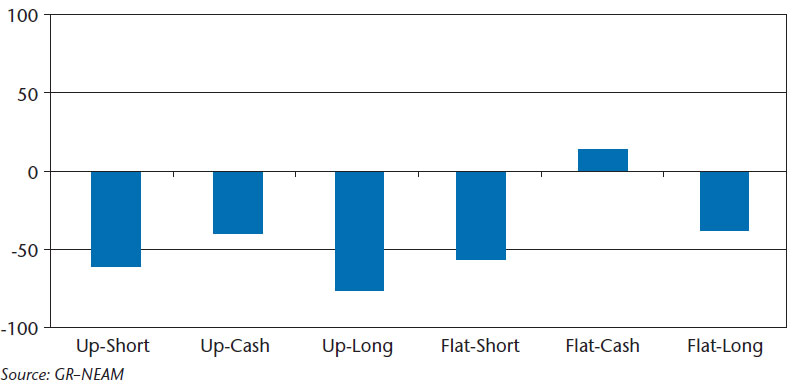
In an enterprise setting, stress testing of the underwriting outcomes is necessary to assess whether the total liquidity resources of the company become so deficient—due to adverse underwriting results and loss payouts—that unrealized losses become realized losses as bonds are sold to pay policyholder claims. As shown above, for the example of a “successful” underwriting organization, the issue is moot and the preferred investment strategy becomes clear: stay-the-course strategy. “Questionable” underwriting operations limit investment flexibility.
Summary
With the specter of rising interest rates, insurance executives question the need for altering their investment strategy, in particular should they “go short” to avoid potential unrealized losses as rates rise and to “preserve flexibility” (in order to time the market)? Using industry data, we show that a stay-the-course strategy may generate the greatest accretion of GAAP equity over time.
However, as noted above and as our clients are aware, the limiting factor upon investment opportunities in an uncertain capital markets environment is the sustainability of successful underwriting operations. When underwriting operations become a “net consumer” rather than a “net contributor” to operating cash flow difference, performance metrics come into play. We hope you agree that most basic investment decisions will require an enterprise-based return and risk assessment, and more importantly for you, we hope you can “stay-the-course.”
Endnotes
1 Cash flow is defined as operating cash flow plus investment pay downs and maturities.
2 See General ReView Issue #64 for a summary of industry portfolio holdings characteristics.


