
LDTI comes live in 2023
Starting in 2023, U.S. public life insurers are expected to adopt Accounting Standard Update (ASU) 2018-12, the updated GAAP accounting rules for long-duration contracts. Among various changes required by this accounting update, standardizing the discount rates in long-duration contracts reserving could have implications (or unintended consequences) as life insurers attempt to manage, or mitigate, the reported earnings or book value volatility under this new accounting rule. This issue of Perspectives focuses on how liability discounting could influence life insurers’ enterprise optimization and investment strategy.
Life Insurers are expected to navigate accounting, regulatory and rating agencies’ requirements and economic realities when evaluating and optimizing their enterprise values. Sometimes these are not aligned, or even conflicting, and insurers need to understand the trade-offs and choose measures that are most appropriate for their operational needs and stakeholder expectations.
Standardizing Liability Discount Rate: “De-Linking” Liabilities Valuation from Assets Valuation
Life insurance portfolio construction typically follows a bottom-up approach1 where insurance premiums are collected and invested accordingly to fulfill the expected claims or benefits when they come due over time. Liability cash flows constitute the foundation of the asset liability management (ALM) analysis, and their ensuing discounted present value, duration, and convexity become the “by-products or derivatives” of these cash flows. In a scenario where asset and liability cash flows are perfectly matched, the discounted present value of these asset and liability cash flows should result in similar, if not identical, valuations; otherwise, the metrics (present value, duration, key rate duration, etc.) for assets and liabilities derived from the cash flows present inherent inconsistency in the context of ALM.
Valuing liability cash flows with discount rates different, and independent from the underlying earned rates from the assets which back them, essentially “de-link” liabilities from assets in the ALM analysis. In the case of long duration targeted improvements (LDTI), long-duration insurance contracts are measured with standardized discount rates, i.e., the “A” corporate bond yields, for all life insurers. This de-linking of valuation between assets and liabilities will require a different approach and mindset for life companies attempting to manage their reported LDTI mark-to-market (MTM) volatility for earnings or book values. In the following sections, we will use NEAM’s Enterprise Based Asset Allocation1 framework to illustrate how valuing liabilities at different discount rates could influence enterprise optimization and investment strategy.
A LDTI Case Study Using Enterprise Based Asset Allocation (EBAA™) Framework
A profit-seeking insurance organization needs to generate favorable return on equity for its capital providers. Starting from the traditional return on equity (ROE) definition, we can further decompose the ROE of a life insurance enterprise into the following DuPont formula.
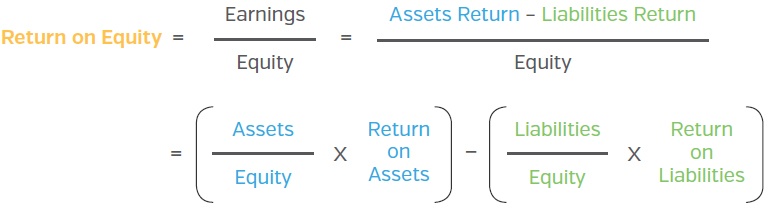
This holistic approach considers the characteristics and interactions of invested assets and insurance products. The economic framework utilizes MTM total return, volatility and correlation to assess an insurance enterprise’s return and risk trade-offs through the modern portfolio theory efficient frontier analysis.
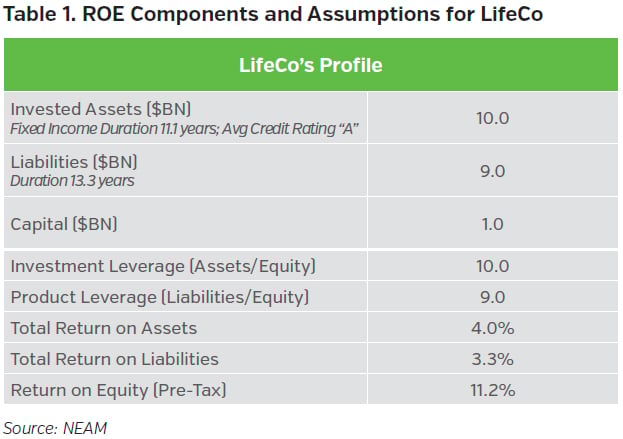
Table 1 highlights key components and contributions of ROE for a U.S. life insurer (LifeCo). The return on assets (4.0%) reflects LifeCo’s expected MTM total return of its fixed income securities, equities and alternatives. The fixed income portfolio has an average credit rating of A and a duration of 11.1 years. LifeCo’s reserves encompass life and annuity business with an aggregate duration of 13.3 years. The return on liabilities (3.3%) represents the “cost” or “required rate of return” of liabilities. In addition to return, volatility, and leverage assumptions for LifeCo’s assets and products, we will need the interdependency (or correlation) assumptions between assets and products for the EBAA™ optimization.
To develop the correlations between assets and products, we first simulated LifeCo’s Total Return on Liabilities (TRoL) under historical capital market conditions (i.e., monthly data for the last 25 years) and then correlated these simulated historical TRoL time series with historical assets total return time series to derive the respective correlations. In this case study, we generated TRoL time series under both historical “A” corporate bond yield curves (i.e., LDTI mandate) and historical Treasury yield curves (i.e., risk-free rates) and derived the corresponding assets and products correlation assumptions for LifeCo’s EBAA™ analysis. In addition, these modeled TRoL time series exclude potential cash flow variability caused by mortality and morbidity risks as the objective is to illustrate how liabilities measured at different discount rates could impact the assets and products correlations, which will subsequently influence asset allocation results.
Divergent Enterprise Risk Profile Driven by Liabilities Discounting Bases
Table 2 summarizes LifeCo’s enterprise risk profile from liabilities MTM at two different bases. Assets risk and liabilities risk (i.e., standard deviation) are un-levered while the tail risk metrics (i.e., T-VaR) are levered (i.e., expressed as a percentage of LifeCo’s capital).
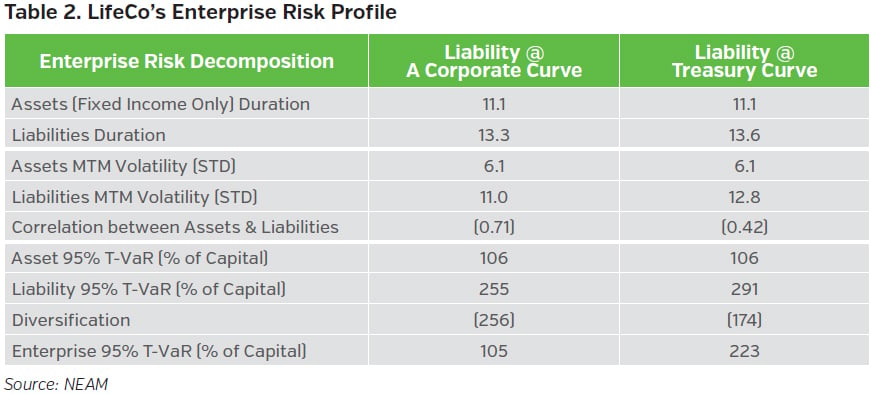
First let’s examine and rationalize the relatively different magnitude of the MTM volatility between assets and liabilities. Assets MTM volatility reflects LifeCo’s balanced asset composition, which encompasses various sub-sectors, maturity buckets and credit ratings within the fixed income portfolios, in conjunction with potentially diversifying equity and alternative assets. The asset MTM volatility captures the inherent diversification benefits among fixed income, equity and alternatives asset classes. On the other hand, the liability MTM volatility reflects primarily the discounting impact from the underlying yield curves, whether ‘A’ corporate or Treasury bond, used in the total return calculations. Essentially, the liability MTM volatility can be thought of as the MTM total return volatility of a similar-duration fixed income bond. For example, the liability MTM volatility of 11% should be comparable to the MTM volatility of an “A” corporate bond with a duration of 13.3 years.
As indicated earlier, given that LifeCo’s fixed income portfolio has an average credit rating of A, which approximates the mandated “A” corporate bond discount rate under the LDTI, the resulting diversification (-0.71) between assets and products are much better than the diversification (-0.42) when liabilities are valued using Treasury yields (i.e., risk free rate). LifeCo’s enterprise tail risk measure (95% T-VaR) more than doubled when liabilities are measured with rates (Treasury) that are materially different (or independent) from asset earned rate (“A” corporate bond yield). Next, let’s examine how liabilities discounting could potentially impact asset allocation outcomes.
Liabilities Discounting Might Influence Asset Allocation Decision
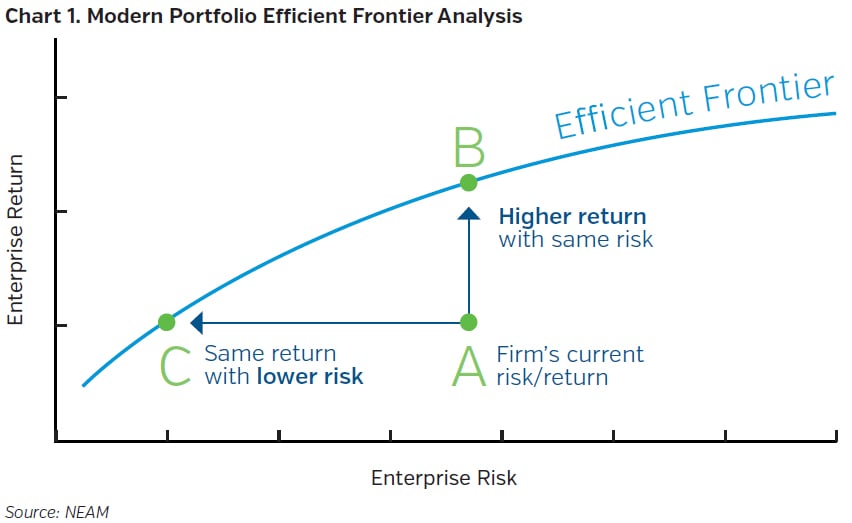
A portfolio optimization framework evaluates return and risk tradeoffs among different asset classes and identifies portfolio configurations that are optimal (or more efficient) in terms of selected return and risk metrics. Undoubtedly the risk tolerance metrics used vary by company, depending on the enterprise’s objectives and stakeholders’ expectations. Our enterprise optimization is configured to seek to maximize the enterprise’s total return while minimizing its earnings risk, subject to the company’s specific constraints. Chart 1 illustrates the concept of enterprise efficient frontier. Point A represents the company’s existing return and risk profile; and the efficient frontier represents potential opportunities for the company to achieve a higher risk-adjusted return profile. For example, point B illustrates a higher return with the same level of risk, while point C illustrates the same return at a lower level of risk; both points are considered to be more “efficient” than the current profile A.
In our LifeCo case study, we performed EBAA™ optimization with liabilities discounted at “A” corporate bond yield and Treasury yield. The goal is to identify key directional differences between the optimized allocations at the lower-risk and the higher-return points of the respective efficient frontier, subject to capping S&P investment capital charges at current levels.
Table 3 summarizes the optimization results under two different liabilities discounting bases. According to LifeCo’s key components and contributions of ROE shown in Table 1, the current enterprise return is identical; however, the enterprise risk measure (T-VaR) differs significantly because of the assets and products correlations (-0.71 vs. -0.42) derived from different historical TRoL total return time series.
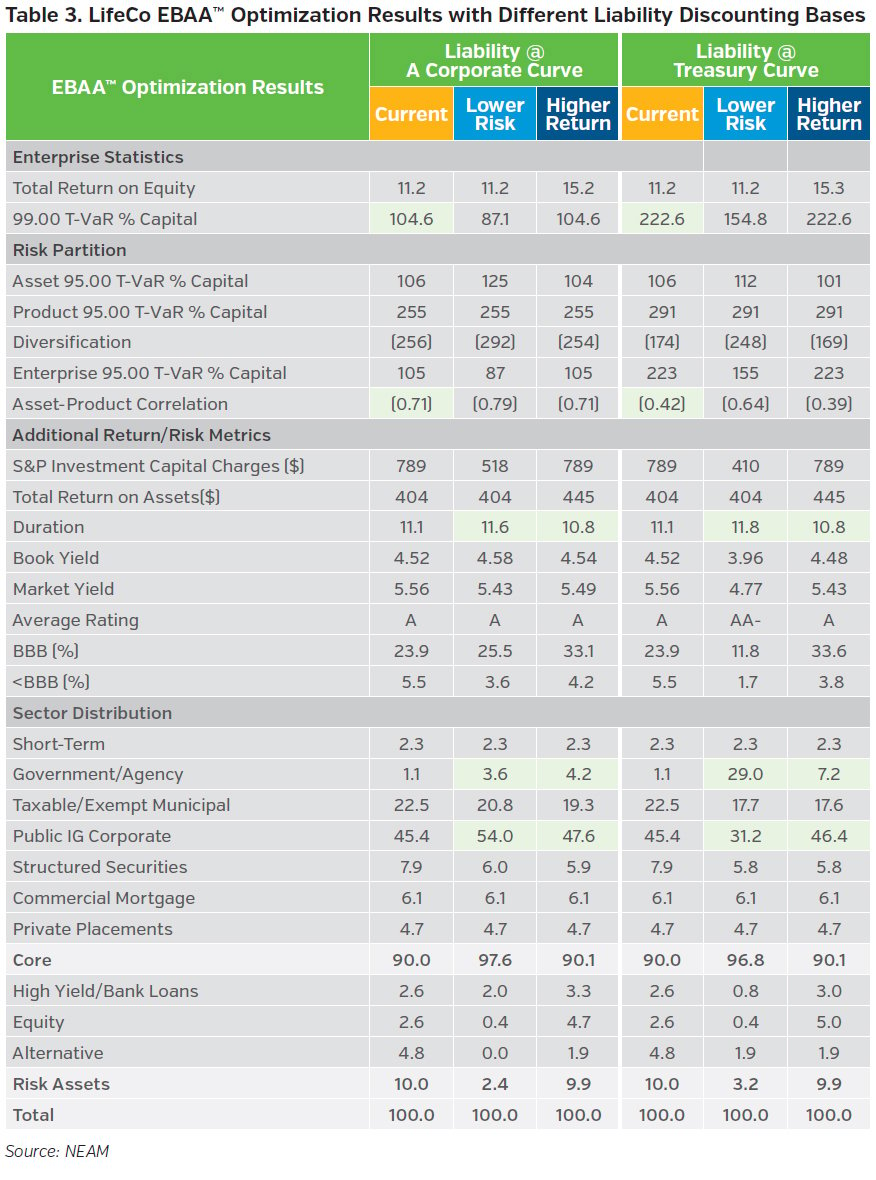
Extending duration of a fixed income portfolio typically results in higher MTM total return volatility. Under our EBAA™ framework, the lower “enterprise” risk portfolio under both optimizations actually extended duration to better match its liabilities’ duration of 13.3 years. And yet, the lower risk portfolio did significantly reduce its risk asset allocation, which subsequently resulted in much lower S&P investment capital charges.
When liabilities are discounted with “A” corporate bond yield (LDTI’s mandate), both the lower risk and higher return portfolios exhibit increased allocations to investment-grade (IG) corporate bonds. On the other hand, when liabilities are valued with Treasury yields, allocations to government and agency rose as these sectors provide better offset against liabilities’ MTM volatility derived from risk-free rates.
Key Takeaways
- ALM matching or management requires a consistent valuation basis across assets and liabilities; standardizing reserving discount rates means de-linking liabilities valuation from assets valuation.
- Under a mark-to-market framework, to manage the enterprise risk, life insurers need to do more than just match duration of assets to that of liabilities. Correlations among assets, liabilities and cross assets and liabilities need to be considered when evaluating and optimizing enterprise value.
- LDTI’s mandating a standardized discount rate for liability measurement could have asset allocation implications as life insurers attempt to manage reported earnings and book values volatilities.
We welcome your feedback and comments. Please contact us if you would like to know more about the implications that the LDTI will have for the life insurance industry and, more specifically, for your business.
Endnote
1 Please see NEAM Perspectives “Adopting a Holistic Enterprise Approach for Life Insurer Portfolio Optimization," May 2019.


