
Executive Summary
To understand how life insurers have fared through this prolonged low yield environment, we have published a series of studies1 that review the life industry’s net investment spreads. Principally, these spreads are the difference between “earned” rates from assets versus “paid/credited” rates to insurance contracts.2
Have we reached the bottom? was the title of our 2017 report that examined the industry’s net spread results through 2015. In retrospect, the answer to that question was a resounding “No.” From 2015 through 2019, the life industry experienced an additional 50 bps of net spread compression. Given that the 10-year U.S. Treasury yield dropped from 1.92% to 0.93% from year-end 2019 to year-end 2020, the industry’s net spreads are likely to narrow further.
Although the overall net spreads of the industry declined, the results vary by company size and business focus. As the life industry continues to consolidate, large companies grow larger and demonstrate better net spread results than small companies. Annuity-focused companies, which tend to manage their net investment spreads diligently, fare better than their non-annuity-focused counterparts, as expected.
NARROWING SPREAD DRIVEN BY DECLINING EARNED YIELD
Chart 1 shows the historical trends of earned rates (net portfolio yields3), guaranteed rates (liability valuation rates), and net spreads (i.e., the difference) for the industry. The industry’s narrowing net spread is driven primarily by the net portfolio yield, which decreased by 103 bps, from 5.32% in 2010 to 4.29% in 2019. During the same period, the guaranteed rate was reduced by only 33 bps. The industry-level spread dropped below 100 bps for the first time in 2016 and reached a new low of 56 bps in 2019. Industry net investment spread is mostly determined by a small number of large companies, while most life insurers’ net spreads are lower than the industry average.
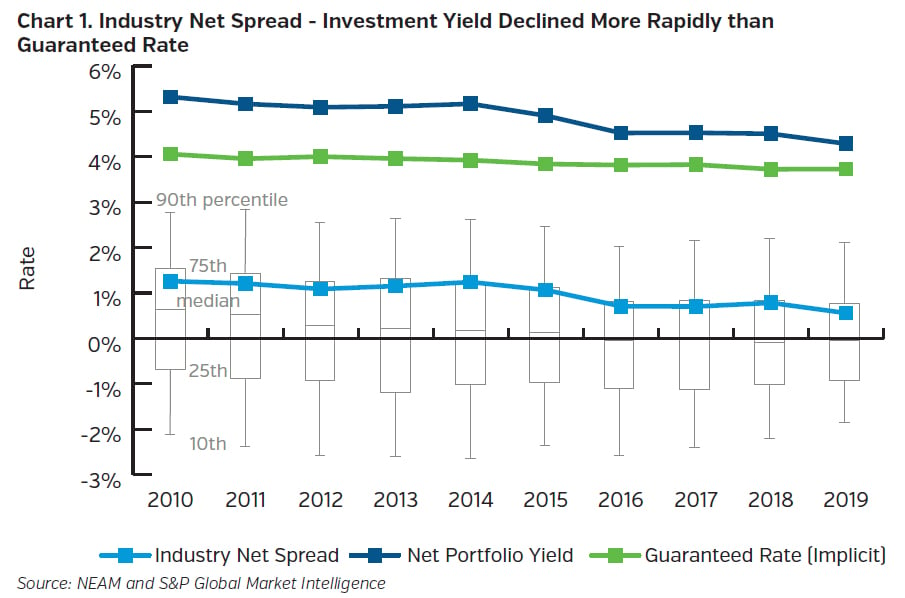
Chart 2 shows the proportion of life insurers with a positive net spread. Although the net spread is “implicitly estimated,” the results indicate concerning trends. The proportion of the industry with a positive net spread, measured by total industry reserves, declined from 87% in 2010 to 74% in 2019. The trend is more pronounced when expressed by company count: down from 65% (478 companies of a total of 740) in 2010 to 49% (306 of 622) in 2019.
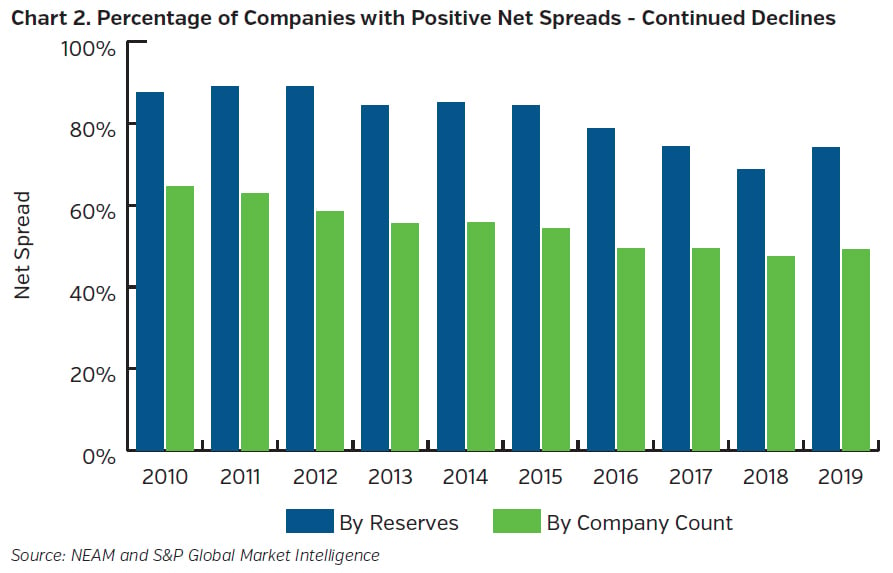
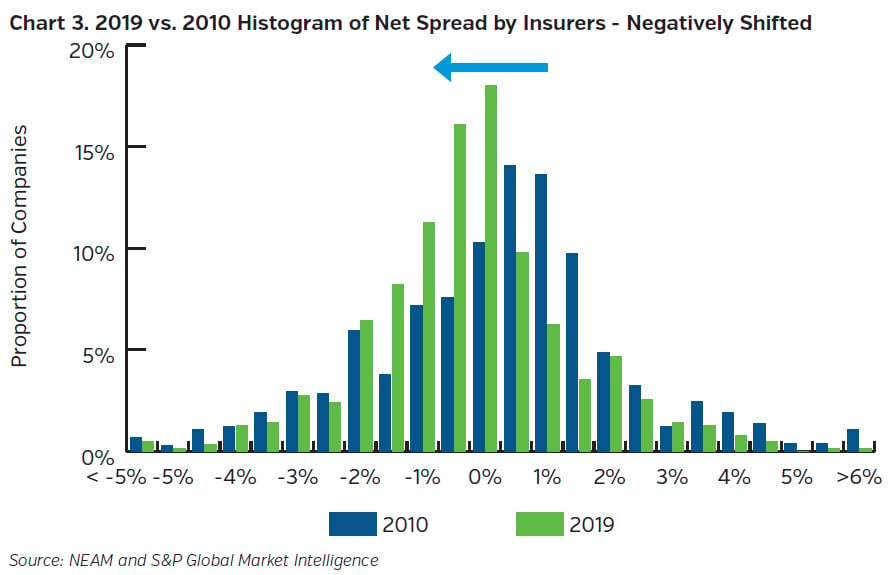
Chart 3 compares the distribution of net spread by company count in 2010 and 2019. This comparison further illustrates that an increasing proportion of insurers have lower net spread levels. Essentially, the distributions of net spread results shifted to the left (lower level) from 2010 to 2019.
LARGE COMPANIES GROW LARGER AND MORE DOMINANT
As highlighted in our prior studies, net investment spread results continued to vary significantly by company size. The life industry has continued to consolidate over the decade(s). As of year-end 2019, the companies with over $15 billion in reserves represent 80% of the industry, while those with less than $1 billion in reserves make up only 2% (see Chart 4). We will further examine how investment spread results differ by company size.
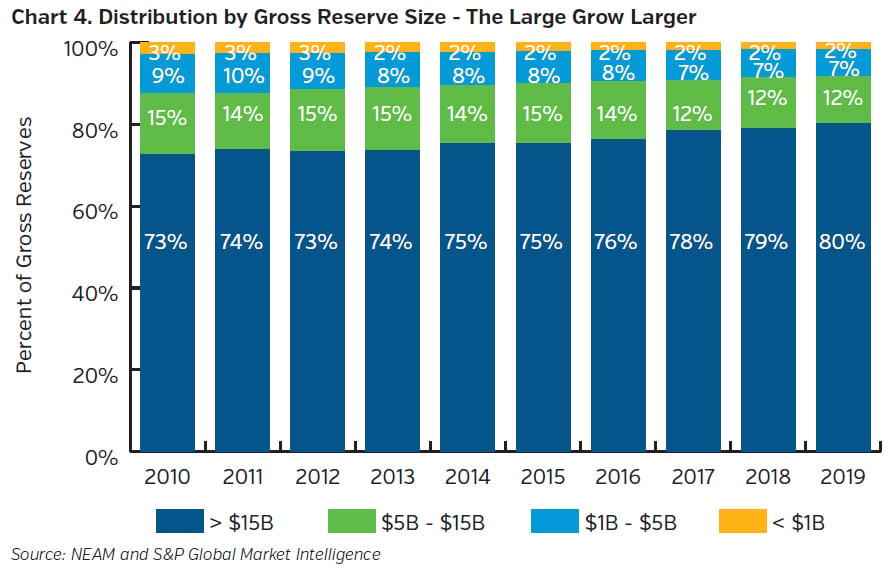
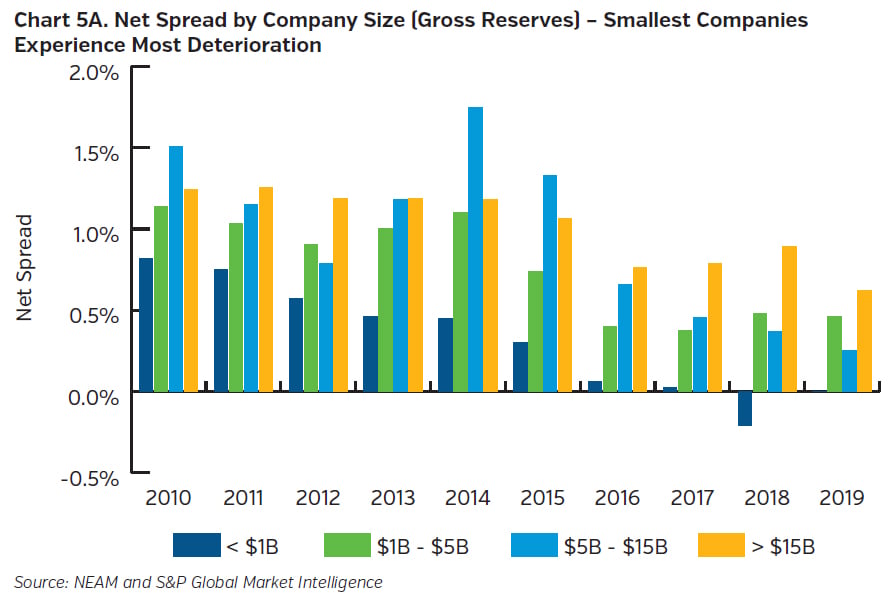
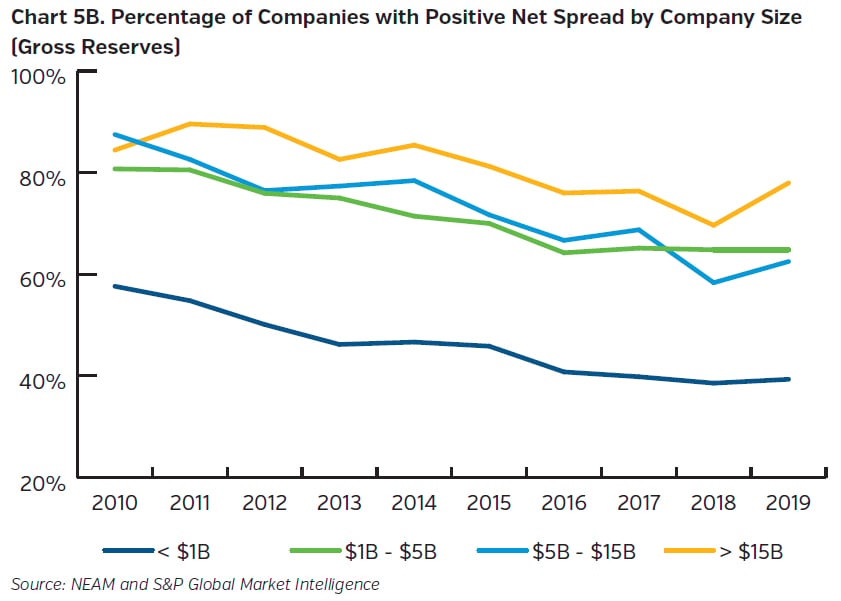
Chart 5A shows that the net spreads for the smallest companies (reserves less than $1 billion) experienced the most deterioration. For the last five years, their average net spreads appeared only slightly positive, with a negative net spread4 observed in 2018. On the other hand, the largest companies (reserves greater than $15 billion) maintained the highest average net spread since 2016. These large companies continued to have the highest percentage of reserves with positive net spread (see Chart 5B). Mid-sized companies, both the $1 billion to $5 billion, and $5 billion to $15 billion reserve categories, seemed to follow a similar declining pattern of their net spread results over the last decade.
ANNUITY COMPANIES OUTPERFORM
In addition to varying net spread results observed by company size, we also noticed materially divergent net spreads by business focus. For this analysis, we classify life insurers as:
- Life-focused: More than two-thirds of statutory reserves classified as life business
- Annuity-focused: More than two-thirds of statutory reserves classified as annuity business
- Diversified: Others
Over the last decade, the proportion of annuity-focused companies grew while the proportion of diversified companies declined. As of year-end 2019, 35%, 30%, and 35% of the industry’s gross reserves were represented by life-focused, annuity-focused, and diversified companies, respectively.
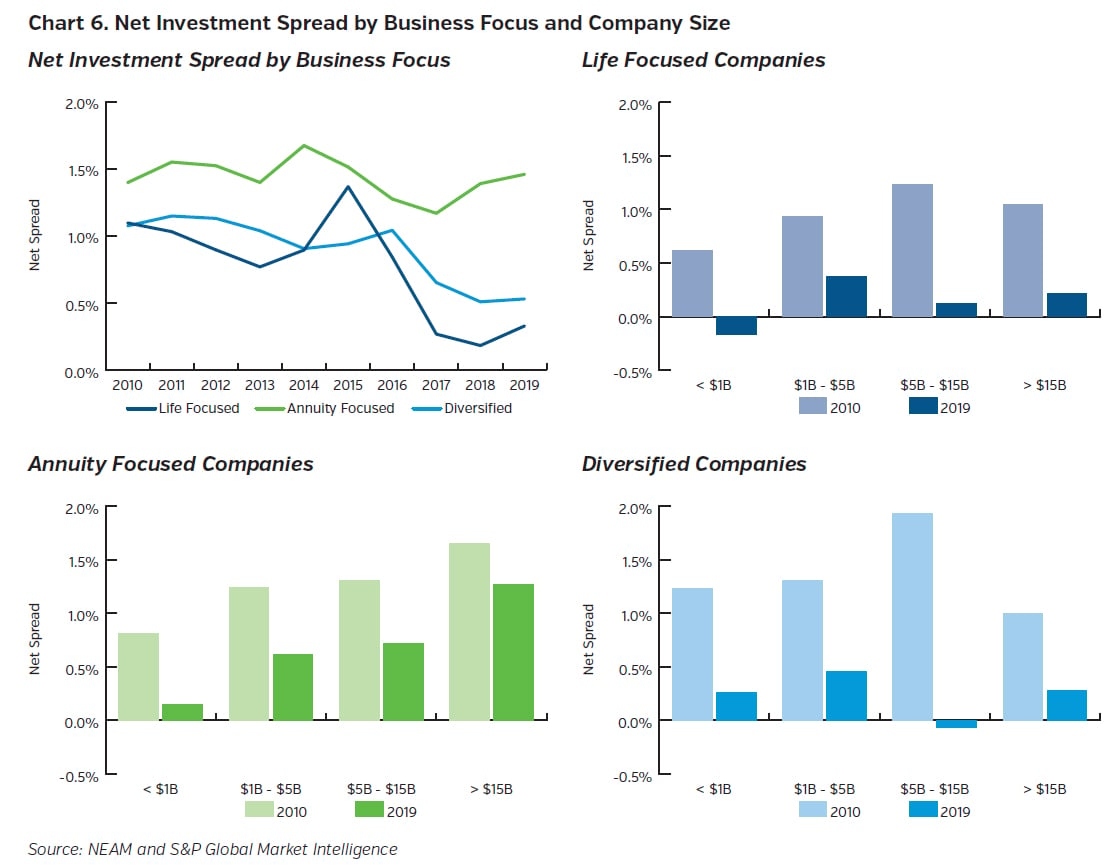
Chart 6 compares net spread results by business focus and company size. Annuity-focused companies’ average net spreads consistently outperformed those of the other two business types. When we further examine the net spread results of each business type by company size, annuity-focused companies seem to exhibit a scale advantage, i.e., the larger annuity companies not only experienced the least decline in net spreads, but also achieved higher spread levels than the smaller annuity companies. For both life-focused and diversified companies, the $1 billion to $5 billion companies outperformed their peers in 2019.
KEY TAKEAWAYS
- Overall, the life insurance industry-wide spreads have continued to narrow. While both the earned and guaranteed rates exhibited a downward trend, the former declined at a faster pace than the latter.
- The life industry continues to consolidate, as large insurers grow larger and more dominant.
- Large companies continue to show better net spreads than small insurers. Insurers with less than $1 billion in reserves experienced the most decline in net spread results.
- Annuity companies show nearly 100 bps more favorable net spread results than life and diversified companies.
We welcome your feedback and please contact us if you would like to know more details about our net investment spread analysis.
Endnotes
1 General ReView – Life Industry Net Investment Spread: Declining but Stabilizing. February 2014.
Perspectives – Life Industry’s Net Investment Spread: Have We Reached the Bottom?. January 2017.
2 This issue of Perspectives follows an approach and methodology utilized earlier but incorporates additional data points and analytics. As noted in the previous studies, statutory valuation interest rates are used to proxy minimum investment returns (i.e., guaranteed rates) that life insurers must earn to maintain profitability.
Net Investment Spread = Net Portfolio Yield – Guaranteed Interest Rate,
Net Portfolio Yield =

Guaranteed Interest Rate was approximated by the weighted-average valuation interest rate that was extracted from Statutory Financials, Exhibit 5: Aggregate Reserve for Life Contracts.
3 The net portfolio yield reflects investment returns from both affiliated and unaffiliated investments.
4 During 2018, 22 companies exited the “reserves less than $1 billion” category, either being consolidated or moving to the next size category. These 22 companies’ average net investment spread was above the average of this category in 2017, and their departure resulted in a negative spread for this category in 2018. In 2019, the reversed positive spread in this category was driven by companies with negative net spreads exiting the category.


