
Executive Summary
Successful insurers make sound choices with investments and underwriting that translate into strong performance over time. In NEAM’s experience this is often rooted in a deep understanding and an alignment by these firms of their risk capacity and their risk preferences. They generally take a layered approach to strategy and risk management, to identify the balance of asset-driven risk and return and liability-driven risk and return that best suits their organization. NEAM advocates framing investment decisions based on a holistic understanding of an insurer’s risk tolerances that align with risk-adjusted return objectives over time.
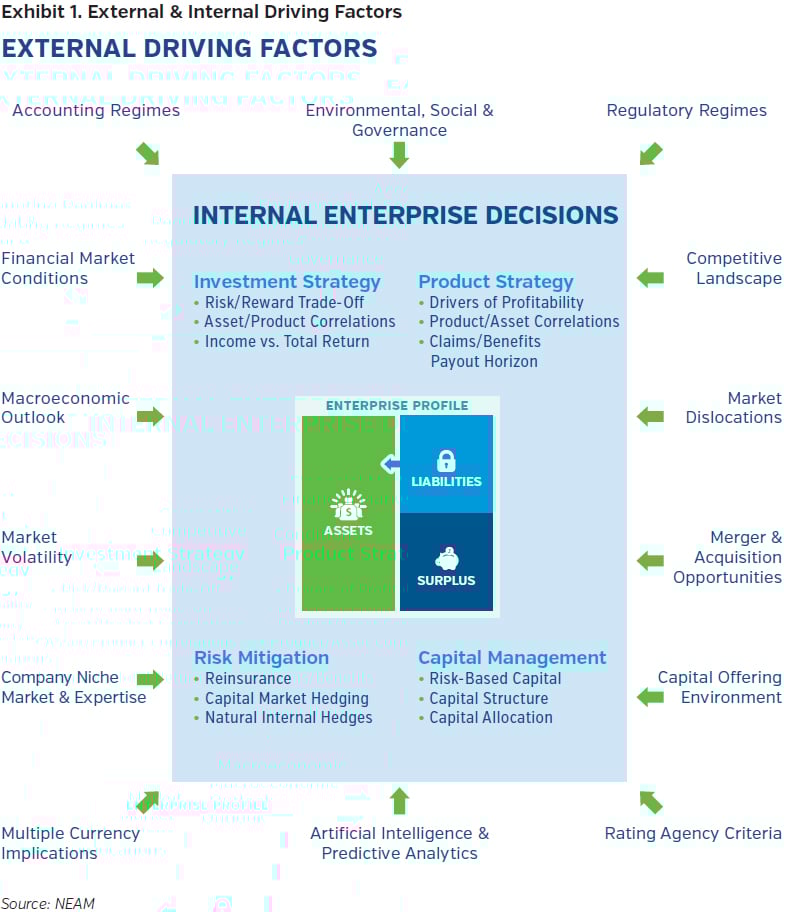
Market Influences & Enterprise Decision-Making
P&C insurance companies navigate through a broad range of challenges and opportunities every day. There are external factors, such as capital market dynamics, pressures from competition, soft and hard insurance market pricing cycles, and regulator and rating agency expectations. Each insurer has a different level of sensitivity to, and control of, these factors. Yet, leading insurers aim to make appropriate decisions that manage the challenges and take advantage of the opportunities inherent to these influences. When the decision-making process is effective, over time these leading firms position themselves toward an ideal enterprise profile with risk retention and risk compensation suitable to their strengths and objectives. They tend to form optimal enterprise risk and return profiles that foster long-term risk-adjusted returns suitable to their strengths and aligned with stakeholder expectations.
Layering Risk Capacity Utilization
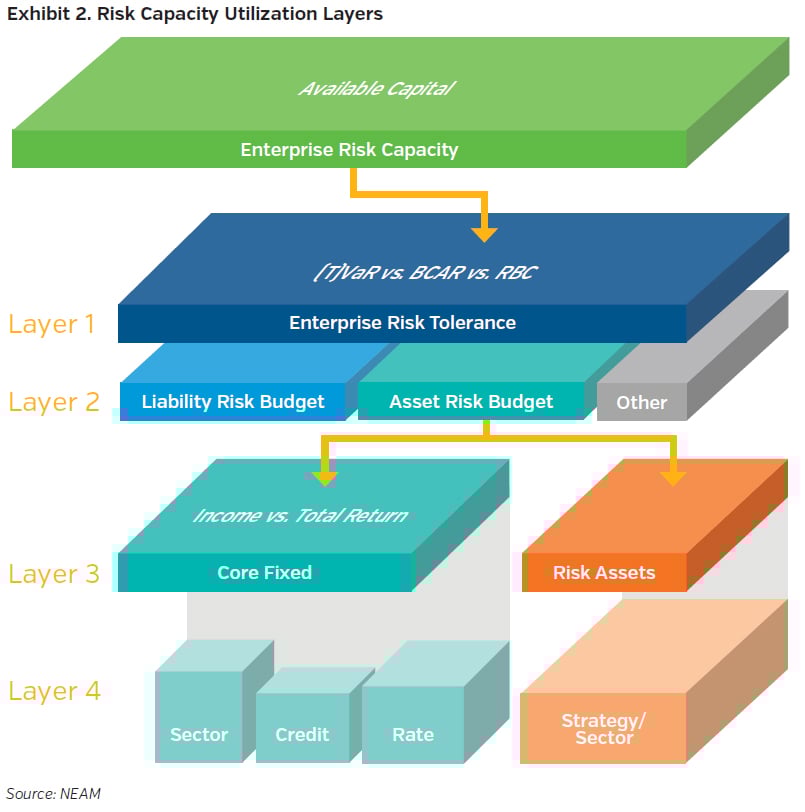
Enterprise risk decisions have several layers but can begin with enterprise risk capacity as a starting point. We define enterprise risk capacity for an insurance company as their available capital or surplus. Without adequate capitalization, solvency concerns will curtail any insurer’s ability to operate in the eyes of regulators, rating agencies, counterparties, and customers.
An insurer deemed to have adequate financial strength should have enterprise risk capacity levels suitable for its needs.
However, the management team should determine how best to utilize that capacity for strategic purposes. We call this consideration Layer 1, and this initial layer can be linked to risk tolerances, preferences and stakeholder expectations. It starts by defining how much of its capital the firm is willing to put at risk to collectively support the uncertainty that underlies opportunities across the firm, namely with investment choices and underwriting decisions. This enterprise risk tolerance can be measured in different ways. Some employ economic measures such as a (tail) value-at-risk estimate. Others use solvency ratios or risk-based capital metrics from regulators and rating agencies. All can link to a view of capital-at-risk to frame and measure enterprise tolerances.
Layer 2 focuses on risk budgeting, where liability risk and asset risk are evaluated both jointly and separately. The firm must determine how much risk capacity should be used for each area that contributes to earnings and of any dependences between the two. For most insurers this is split between the underwriting margin associated with insurance liabilities and returns from invested assets. Each area offers opportunity but also entails risk. Some P&C insurers prefer to have more risk sourced from premiums and reserves and less from investment uncertainty, perhaps due to a greater understanding of or higher compensation for that risk. While others, because of financial or operational leverage or specific actions taken over time, have an implicit or explicit bias toward investment risk and return.
Comparing Implied Risk Budgets Across Selected Industry Segments
Achieving optimal enterprise risk and return profiles can depend on alignment with risk preferences and retained risks. Leading firms understand their risk budgets, noted as Layer 2 above, including how much risk is retained within investments and within underwriting or other sources of returns. When risk budgets are understood and managed optimally, earnings targets are supported, and the objectives of management and expectations of stakeholders are met. Financial leverage plays a key role in risk alignment and risk budgeting as well.
Enterprise risk measures such as tail value-at-risk (T-VaR, which estimates the potential loss of value with adverse negative tail events) or earnings volatility metrics can estimate enterprise risk levels and related tolerances. These holistic measures can be very useful within strategic asset allocation analysis.
Exhibit 3 shows a four-chart comparison of average returns, risk estimates and leverage for three segments of U.S. P&C insurersi – 1) a 10-company sample of some of the largest monoline workers compensation insurers (WC); 2) a 10-company sample of some of the largest personal lines insurers (PL), and 3) a cross section of over 475 U.S. insurers writing all major insurance coverages, including the selected 10 WC and 10 PL firms. We look at data across a 10-year period ending in 2021 for our return and volatility estimates. Leverage and T-VaR estimates are as of year-end 2021.
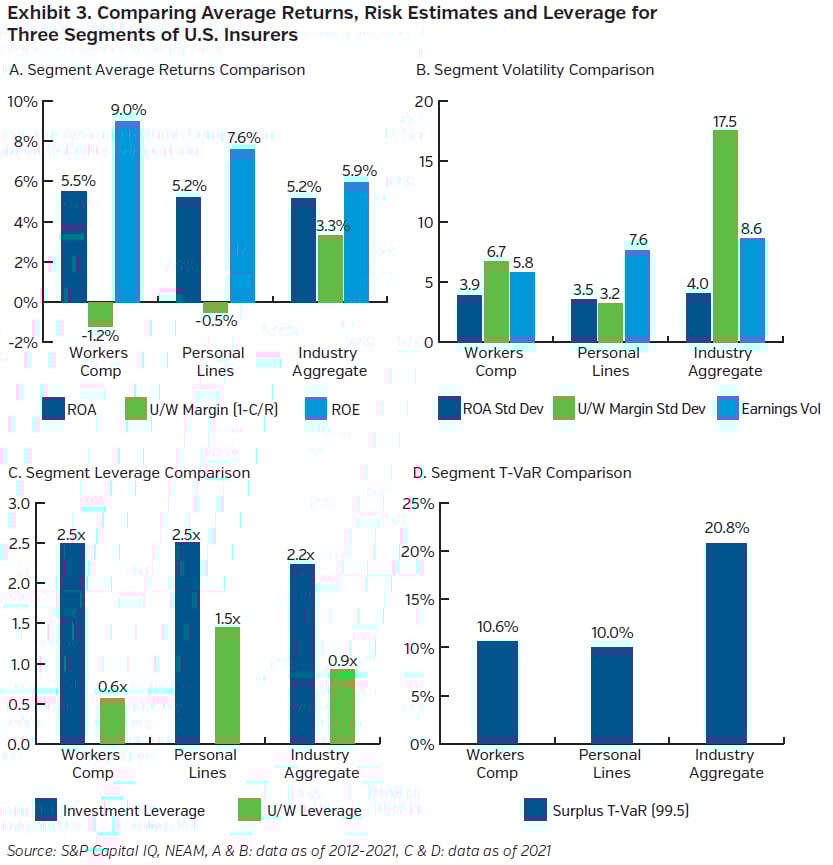
Exhibit 3A and 3B column charts show return on assets (ROA) and ROA volatility that are relatively similar for WC and PL in our sample. In contrast, underwriting margin and related volatility are very different between the two. Additionally, Exhibit 3C shows WC and PL have similar investment leverage at 2.5x but vastly different underwriting leverage (0.6x for WC vs. 1.5x for PL). Despite these differences, Exhibit 3D shows WC and PL enterprise T-VaR estimates that are both about 10%, vs. 20.8% for the broader industry.
A simplified interpretation is that both PL and WC have similar enterprise risk tolerances given their similar enterprise T-VaRs of 10% to 11%, and that they are more conservative compared to the broader industry at a T-VaR over 20%. However, their respective risk budgets within those enterprise tolerances are different, particularly from an underwriting perspective. Exhibit 3B shows WC’s underwriting volatility at 6.7 vs. PL’s at 3.2, and Exhibit 3C shows WC’s underwriting leverage (0.6x) is less than half of PL’s (1.5x). Perhaps WC is willing to assume higher uncertainty and volatility with underwriting pricing or reserving adequacy, in part due to the dampened impact of that uncertainty given their relatively lower underwriting leverage. And like PL, WC is willing to maintain higher investment leverage relative to the broader industry.
Multiple factors and reasons frame an insurer’s risk tolerances. NEAM suggests avoiding siloed risk taking, and to develop investment risk budgets that complement insurance risk budgets and stay within broader enterprise risk tolerances. Ideally, this holistic perspective fosters optimal risk-adjusted returns that align with the insurer’s long-term objectives over time.
Key Takeaways
Enterprise risk capacity for an insurer can be measured by its available capital. How that capacity is utilized and allocated varies by company, but successful firms budget risk across their balance sheet in a way that achieves risk-adjusted returns that meet or exceed stakeholder expectations throughout market cycles. NEAM presents a framework to assess enterprise risk capacity utilization and risk budgeting, with the following takeaways:
- Leading firms navigate the myriad of external factors that influence their operations and make effective decisions that, over time, support an optimal risk and return enterprise profile, one that aligns with stakeholder expectations.
- Multi-layered decision-making can be effective at determining target capital levels, which we equate to risk capacity; this leads to tolerances for risk capacity utilization, and risk budgeting across sources of risk and return for the enterprise.
- The financial position of different insurer types – e.g., personal lines and workers compensation – may imply differences in their asset and liability risk budgets, even if their enterprise risk profiles are similar.
NEAM offers and encourages insurers to employ a broad range of analytics that provide a rich perspective of potential opportunities to enhance risk-adjusted performance over time. Industry and peer risk and return trends can provide base-line considerations to frame enterprise risk preferences. Holistic strategic asset allocation analysis that explicitly links assets, liabilities, and capital, coupled with stress and scenario testing, can improve the quantification and evaluation of opportunities and their challenges.
Endnote
i The sample of workers compensation insurers and personal lines insurers were selected due to their premium size and underwriting focus. We do not imply that these firms are more or less successful than other insurers or are the only representations of their segments. Insurers that underwrite a broad range of product lines and are not exclusively or substantially workers compensation insurers or personal lines insurers were only included in the broader industry sample.


