The U.S. property and casualty insurance industry book yields are at the lowest levels since the early 1950s, reflecting a continuation of record low capital market opportunities. And they are poised for still greater declines. Allocations to risk assets are at their highest levels in recent memory;1 and premium and investment leverage are at their lowest levels since the 1930s. Combined ratios, while fluctuating in a narrow breakeven range, are the beneficiaries of benign catastrophe losses and favorable reserve development.
Against this backdrop, we assess the impact of rising interest rates on investment income due to recent Federal Reserve monetary policy action.2 We focus primarily upon insurers’ fixed income portfolios, though we do account for equity holdings. Our assessment begins by identifying key building blocks of prospective investment income: fixed income returns and term structure, prospective capital market returns, underwriting cash flow, other income and expenses, and paid taxes.
Next, we present estimates of future investment earnings over a range of term structures. Rising rates can slow the pace of declining yields and earned income. However, recovery to prior embedded yield levels is multi-year (if ever), based upon the speed and magnitude of increases, the current term structure, net cash flow and investment strategy. Several of these factors are unique to each insurer. Therefore, customized capital management and investment strategies are key components of recovery. We caution, however, that rehabilitation can be an arduous task without guaranteed outcomes.
Future Investment Earnings’ Building Blocks – Strictly Investment Matters
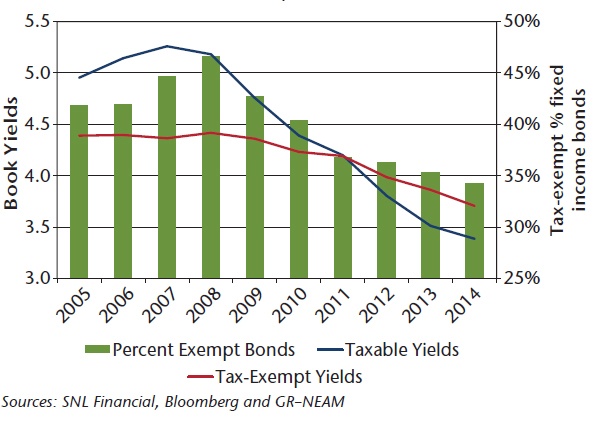
Chart 1 displays historic embedded yields and option-adjusted durations of the industry’s taxable and tax-exempt portfolios over a 10-year period (2005–2014). As shown in the left-hand panel of Chart 1, taxable bond yields have been in steep decline since their 2007 peak. Their descent has been so rapid that embedded taxable yields fell below those of tax-exempt bonds in 2012. At year-end 2014, they were trailing tax-exempt yields by 32 bps.
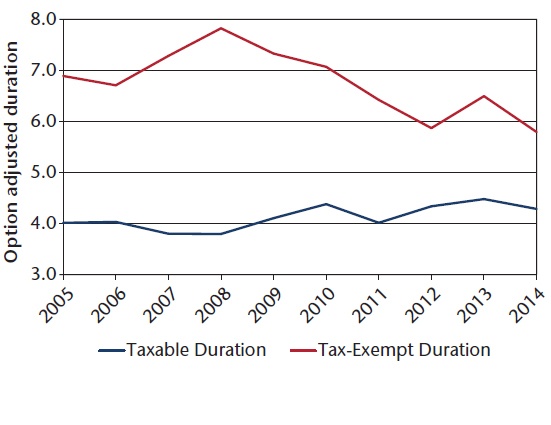
The right-hand panel of Chart 1 reveals a root cause in the difference between taxable and tax-exempt portfolios’ yield degradation; namely, their respective durations. Tax-exempt portfolios having a higher duration had a smaller portion of their total value maturing each year and, therefore, were subject to reinvestment
at lower prevailing rates. Although tax-exempt durations generally declined in the last decade, they remained substantially higher than taxable bond durations. As the percent of industry fixed income holdings allocated to tax-exempt portfolios dropped (left-hand panel—green bars), the aggregate gross yields declined more quickly.
Chart I: Taxable and tax-exempt historic pre-tax book yields and durations 2005–2014
 Source: SNL Financial, Bloomberg and GR-NEAM analytics
Over the same period, credit quality significantly weakened. Table 1 highlights the degradation by major rating categories from 2005 to 2014. From 2005–2006 to 2009–2011, the decline in the AAA/AA category was led by corporate bonds and structured securities. From 2009–2011 and in 2014, the credit quality decline was additionally impacted by adverse U.S. Government and municipal bond credit events. With respect to municipal bonds, there was a very sharp decline in AAA-rated holdings, reflecting an erosion of prime municipal credit.
Table 1: Fixed income ratings across time

Source: SNL Financial, Bloomberg and GR-NEAM analytics
Over the entire period, triple-B and below investment-grade holdings ballooned from 8% to 19% of holdings. This was due primarily to the corporate sector. The majority of the ratings migration was attributable to downgrades. However, as noted in prior issues of General ReView, a residual amount was due to “buying credit.”
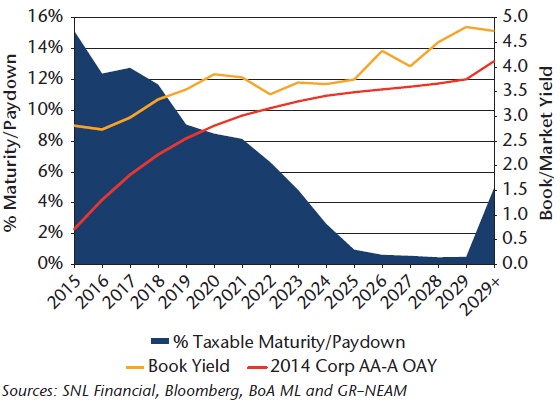
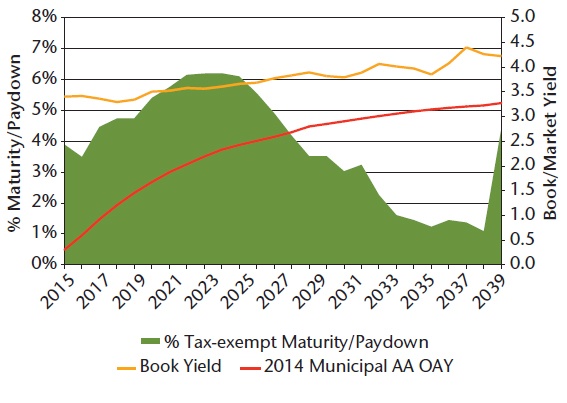
Chart 2 shows the estimated year-end 2014 term structure of the U.S. property and casualty insurance industry taxable and tax-exempt holdings. The blue and green shaded areas represent the sums maturing (bullet bonds) and paying down (structured securities) by year of maturity or weighted average life, respectively for taxable and tax-exempt holdings. The gold line represents the associated year-end taxable or tax-exempt embedded yield term structures. The red lines are reference yield curves of AA-A industrial corporate and double AA municipal bond indices at year-end 2014. The reference curves’ credit ratings reflect the average credit quality of the industry’s taxable and tax-exempt fixed income sectors.
Chart II: 2014 Taxable and tax-exempt bond holdings term structure
 Source: SNL Financial, Bloomberg, BoA ML and GR-NEAM analytics
Taxable bonds maturing or paying down in 2015 equal about 15% of current holdings. Their book yield is about 2.82%. As of year-end 2014, to replace that yield would require reinvestment of AA-A ra ted industrial bonds at a 4.8 year or greater duration. Bonds maturing in 2019 have a book yield of 3.55%. Without a change in rates, the replacement bond would need a maturity in excess of 10 years. Preventing further book yield degradation is not possible without extending the duration, further reducing the credit quality or a combination of both in the absence of rate increases.
For tax-exempt bonds, 3.9% of holdings mature or pay down in 2015. Their book yield is 3.40% and the replacement yield is not available at any maturity point across the year-end 2014 double AA municipal term structure. Without a rate increase in the municipal sector or material change in credit quality, the decline in tax-exempt yields will not only continue but actually accelerate.
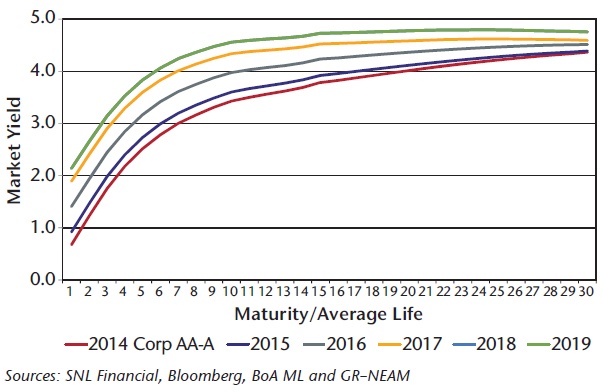
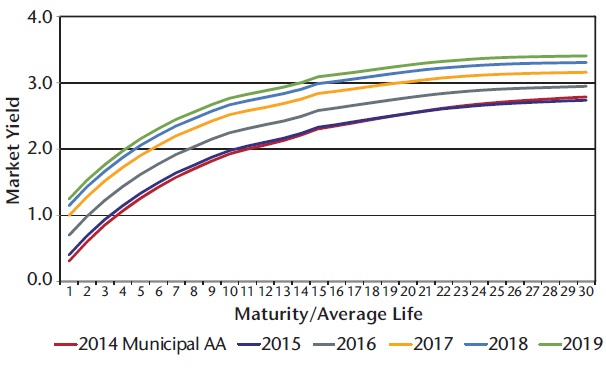
Chart 3 below displays a set of multi-year taxable and tax-exempt prospective yield curves. For each fixed income category there are underlying rate shifts (175 bps and 100 bps, taxable and tax-exempt, respectively) accompanying modest curve flattening. These curves represent proxy re-investment opportunities for maturities and pay downs, and investment opportunities for other sources of cash made available for investment in each year. They also represent the yield curve used to discount each year-end’s embedded yield term structure to estimate the total return impact of changing rates.
Chart III: Taxable and tax-exempt prospective term structures by year of reinvestment
Source: SNL Financial, Bloomberg, BoA ML and GR-NEAM analytics
Future Investment Earnings’ Building Blocks – Insurance Operations
The second major component of future investment return is net operating cash flow (NOCF), defined as net cash from underwriting operations, investment receipts and various non-allocable revenue and expenses such as fee income, interest payments, shareholder dividends and paid federal taxes. Net cash flow from underwriting is defined as premium receipts less losses and underwriting expenses paid, all net of reinsurance.
The drivers of insurance operating income and cash flows are premium levels, incurred losses and operating expenses—all the components of the combined ratio, and policyholder dividends. Historic and prospective claims’ payout patterns are used separately to estimate payouts of year-end carried reserves and prospective incurred losses, respectively.
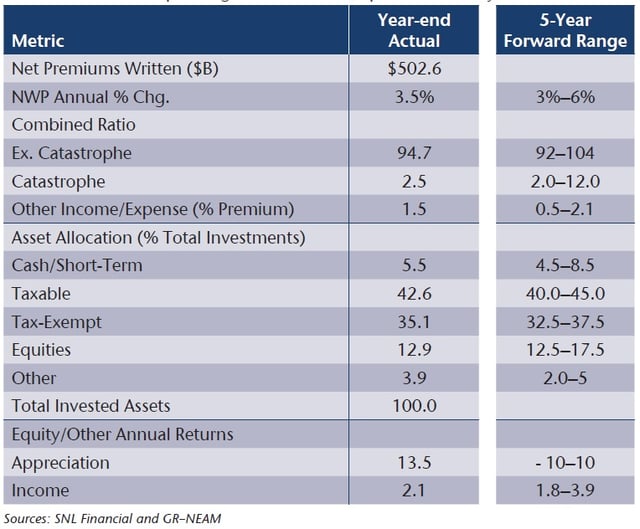
Table 2 below presents a brief summary of relevant insurance operating variables and an assumed range of values for purposes of estimating the impact of prospective interest rate changes upon insurers’ financial results based on U.S. property and casualty insurance industry aggregates. These values are representative of 2014 industry results and are intended only for illustrative purposes. Readers would rely upon their own business plans and how they shape the reinvestment of total cash flows across prospective term structures to reflect and test their investment strategies.
Table 2: Insurance operating and other assumptions summary
Source: SNL Financial and GR-NEAM analytics
Fitting the Pieces Together
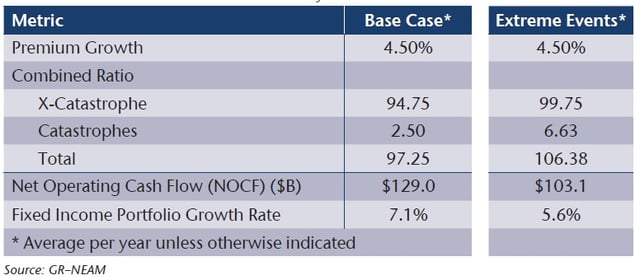
Table 3 presents two scenarios relying upon varying assumed values for the above metrics. The first is characterized by rather benign underwriting results: 4.5% per year premium growth, 94.75 attritional loss combined ratio, and an additional natural catastrophe loss charge of 2.5 combined ratio points per year. In the second scenario, growth is unchanged; the attritional loss combined ratio increases 5 points to 99.75, and two additional catastrophe events of $55 billion and $60 billion are assumed to
occur in years 2016 and 2018, respectively.
Table 3: Financial and statistical summary
Source: GR–NEAM analytics
For purposes of this presentation, the only meaningful differences in outcomes are NOCF and its impact on portfolio growth. In the high combined ratio “extreme event” scenario, NOCF is reduced by an average $26 billion per year. With fewer funds to invest, the fixed income portfolio assets in the extreme event scenario increases but at a lesser rate than in the base case lower combined ratio scenario. Note specifically that prospective embedded yields are largely unaffected by the extreme events.
Chart 4 displays historic and projected fixed income yields, portfolio valuation and after-tax earned investment income for the base case scenario.* The left panel shows pre-tax yields for the taxable (blue) and tax-exempt (red) components of the fixed income portfolio. By 2019 the portfolio’s taxable embedded book yield recovers to 2011 levels. However, given the assumed prospective term structure of taxable securities, the future embedded book yields will always be less than pre-2009 levels without further erosion of credit quality. Tax-exempt holdings continue their downward drift throughout the projection period. Given the assumed prospective tax-exempt term structure, their embedded book yields are not expected to recover to pre-2014 levels.
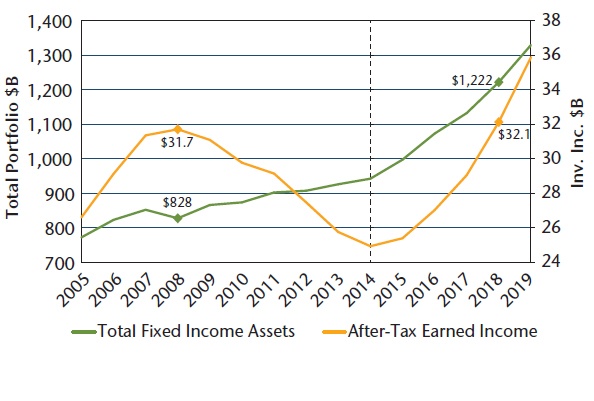
Chart IV: Historic and projected fixed income yields, portfolio valuation and after-tax earned income
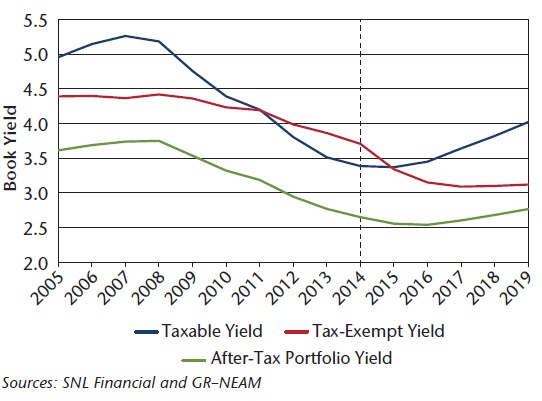
 The fixed income portfolio after-tax embedded book yield is shown in the left panel of Chart 4 (green). Its recovery is minimal and agonizingly slow. It reflects the prospective book yields of the portfolios’ taxable and tax-exempt components, as well as the allocation of NOCF and maturity/pay down proceeds for reinvestment.
The allocation is 60/40 (taxable/tax-exempt) of funds available for fixed income investment. This split reflects the taxable/tax-exempt shares of total fixed income holdings shown in Table 2.
*Past performance is not necessarily indicative of future returns.
The right panel of Chart 4 displays historic and prospective total fixed income assets and after-tax earned investment income. In dollar terms, 2014 appears to be the rock bottom low following the financial crisis, which abruptly ended a period of robust income growth. In the base scenario, after-tax earned income does not recover to 2008 peak levels until 2018, at which time the asset base (red) generating similar income ($32.1 billion) is nearly 50% greater than that of year-end 2008.
Summary
The Federal Reserve’s programmed response to the 2008–2009 capital markets meltdown was quantitative easing: the suppression of interest rates and favoring of risk assets. High quality, liquid assets providing reasonable returns needed by individual investors and savers disappeared. The U.S. property and casualty industry was unfavorably impacted throughout this period and adjusted by accepting lower-rated securities and increasing allocations to risk assets. Changes in duration were more or less market driven. The Federal Reserve recently raised interest rates, suggesting the possibility of future rate increases and the end of quantitative easing. Yet, there remains uncertainty about the timing and level of those increases. Despite this uncertainty, we believe that this issue of General ReView highlights several key factors to consider:
- Fixed income portfolios are poised for a continued decline in book yield.
- Plausible rate increases can reverse this negative trend, but achieving pre-2013
- embedded yields is not possible.
- The “new normal” for prospective investment returns will require insurers to
- consider their enterprise strategy:
- Enterprise (and investment) return thresholds and risk tolerances will
- need further review.
- Favorable underwriting results will become even more critical.
- The declining return on equity will be a major factor in capital management
- Alternative investment strategies and options will need more demanding evaluation.
We welcome your feedback and comments. Please contact us if you would like to receive an assessment of the prospective return scenarios for your investment portfolio and discuss winning strategies for the future.
Endnotes
1 Risk assets are defined as below investment grade securities, non-rated holdings, unaffiliated common equity and Schedule BA assets.
2 Had the Federal Reserve not taken this first step, insurers as a class might have been deemed systemically important financial institutions (SIFI). This is due to declining investment earnings and exposure to marked-to-market illiquidity and default risk that may require further Federal oversight. While we believe this is unlikely and a bit extreme, it has been proposed as a possibility by members and staff of the Federal Office of Insurance (FIO).
GR-NEAM’s portfolio management tools utilize deterministic scenario analysis to provide an estimated range of total returns based on certain assumptions. These assumptions include the assignment of probabilities to each possible interest rate and spread outcome. We assume a 12 month investment horizon and incorporate historical return distributions for each asset class contained in the analysis. These projected returns do not take into consideration the effect of taxes, changing risk profiles, operating cash flows or future investment decisions. Projected returns do not represent actual accounts or actual trades and may not reflect the effect of material economic and market factors. Clients will experience different results from any projected returns shown. There is a potential for loss, as well as gain, that is not reflected in the projected information portrayed. The projected performance results shown do not represent the results of actual trading using client assets but were achieved by means of the prospective application of certain assumptions. Results shown are not a guarantee of performance returns. Please carefully review the additional information presented by GR-NEAM.


