
We choose the topic of Goodwill for this Perspectives for several reasons. First, for insurance organizations which are Generally Accepted Accounting Principle (GAAP) filers it represents a component of reported equity. Second, the Coronavirus-19 and recent capital market volatility will adversely impact insurers’ GAAP and statutory operating results and capital positions. And third, the Financial Accounting Standards Board (FASB) comment period on the current goodwill accounting framework has expired and results are pending.
In this Perspectives, we highlight various definitions of capital to place in context the impact of goodwill depending upon the purpose for which capital is utilized. Next, we present goodwill levels by insurance industry segment and express the amount in relation to other intangible assets, debt, net income and reported equity. We conclude by noting the need to consider these items within the asset allocation risk calibration process.
We begin the analysis with 144 publicly-traded GAAP filers in the S&P Global Market Intelligence insurance database. We find that 79 organizations reported some level of goodwill at year-end 2019. For these entities, cash and invested assets, equity, goodwill and net income totaled $4.0 trillion, $1.3 trillion, $348 billion and $185 billion, respectively. Wide variation exists among companies and when combined with debt and other intangibles significantly alters estimates of leverage and perception of risk among industry segments and companies.
Capital – Very High Level Views
There are at least four views of insurer capital: reported GAAP equity; tangible GAAP equity; statutory capital and economic capital. Reported GAAP equity includes allowances for goodwill and other intangible assets. Tangible GAAP excludes all intangible assets, including goodwill and other non-physical (or intellectual property) assets deemed to have a useful life of more than one year, such as patents, trademarks and brand recognition.
Statutory surplus (capital) is governed most often by NAIC promulgated accounting rules.1 It serves as a cornerstone of regulatory solvency tests in the United States.2 Assets such as goodwill or intellectual property are most often reduced or given a non-admitted status for purposes of statutory surplus calculations. Only readily marketable assets available to satisfy policyholder obligations are recognized on the balance sheet.3
Economic capital includes a probabilistic overlay for assets, reserves and premium margins. Economic capital is deemed to be the amount of capital required (occasionally with an added buffer) to absorb losses in balance sheet valuations and margins of a particular amount, enabling the entity to meet all financial obligations. The time period is most often one year with pre-set confidence intervals. Treatment of goodwill and other intangibles are not uniformly addressed.
Industry-Wide Overview
Table I shows 2019 year-end summary statistics by industry segments of 144 U.S. GAAP filers.4 Goodwill represents 23.5% of total industry reported GAAP equity. All intangibles (including goodwill) plus debt represents 70.6% of total equity. Total and PC/Multiline is shown, excluding Berkshire Hathaway (BRK) for two reasons; first, its size has such impact on industry totals; and second, its asset composition and acquisition history are very unique and diversified well beyond insurance activities.
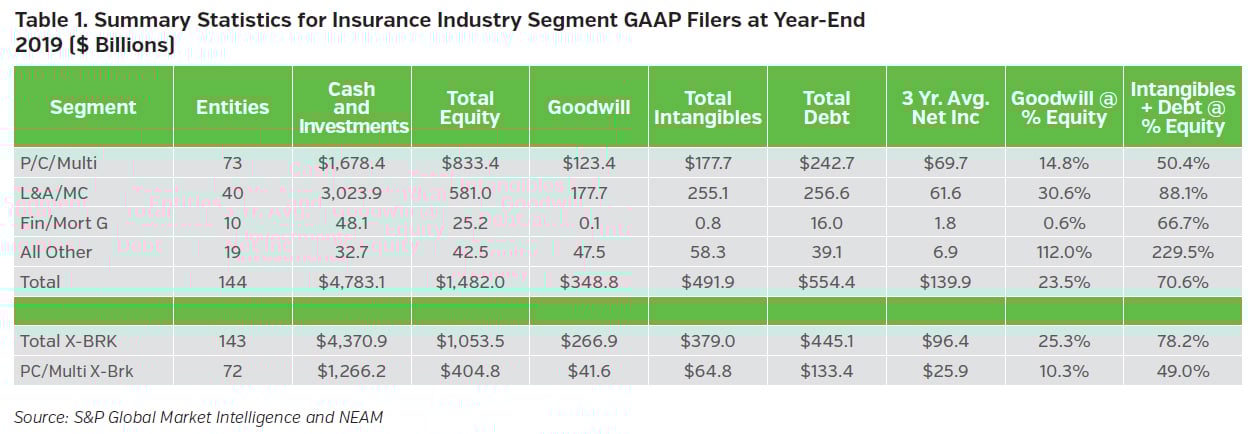
Table 2 repeats the above format for only those 79 entities with reported goodwill. Financial and mortgage guaranty companies have virtually no intangibles and only modest debt on their balance sheets. National brokers drive the high ratios of goodwill and total intangibles plus debt to equity in the All Other category.
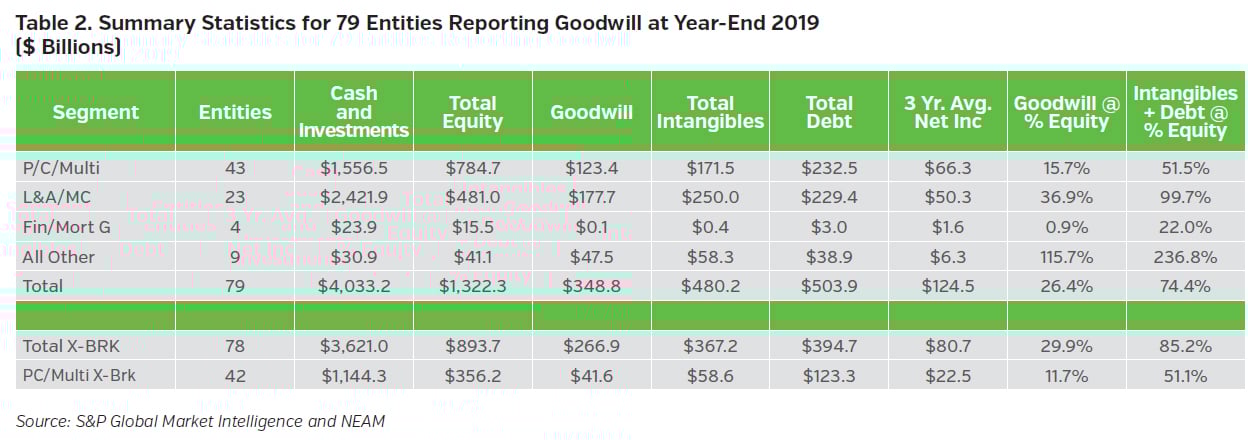
Within the PC/Multiline category, the ratio of intangibles plus debt to equity is primarily due to the utilization of debt rather than goodwill whether before or after the exclusion of BRK. L&A/MC ratios are driven by managed care companies requiring further review.
Segment Variation
In this section, L&A/MC and PC/Multiline segment results are further decomposed. Table 3 shows summary statistics for the L&A and MC segments and individual company results within the Managed Care segment. The traditional L&A segment total intangibles plus debt to equity ratio of 48.7% is in line with the PC/Multiline segment as shown in Table 2 above. Similarly, for each of these two large risk-bearing segments the ratio is due primarily to debt, not goodwill.
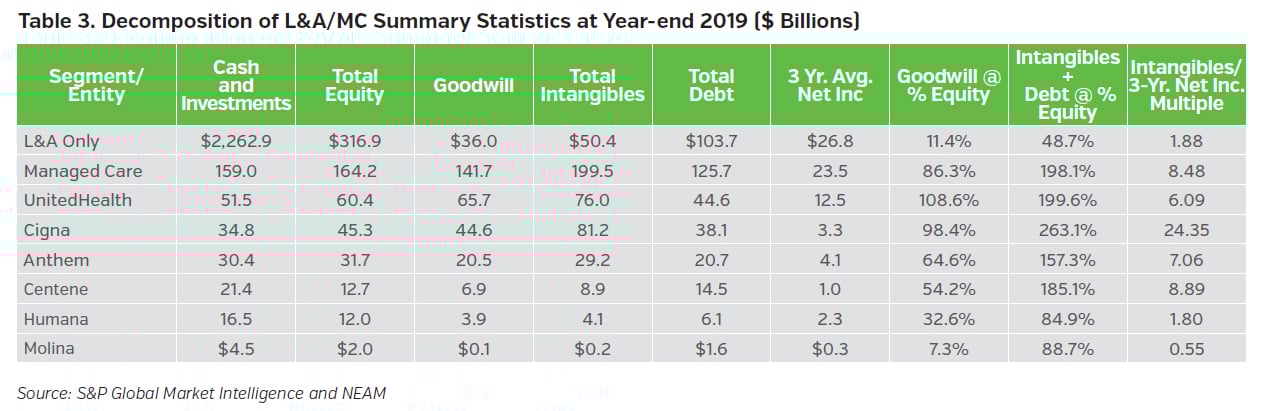
The ratios of goodwill and total intangibles plus debt to equity are much higher for the managed care companies than the principal risk-bearing segments of the insurance industry. The managed care ratios are more aligned with those of national brokers having a meaningful component of fee for services within their businesses.
Similarly, the ratios reflect premium prices paid by acquiring companies in a rapidly consolidating industry segment financed by debt. That noted, if margins were squeezed, the managed care segment’s financials could be adversely impacted by goodwill write-offs and a required acceleration of debt repayments, creating a weakened liquidity position and much smaller equity base.5
Table 4 shows summary statistics for the PC/Multiline segment, BRK and the 10 companies having the greatest sum of total intangibles plus debt. For the entire P&C segment, only three companies’ ratio of total intangibles plus debt to equity exceed 75%; otherwise, the majority of companies hover in the 25% to 60% range and, for the 10 insurers with the largest sums, the ratio averages about 55%.
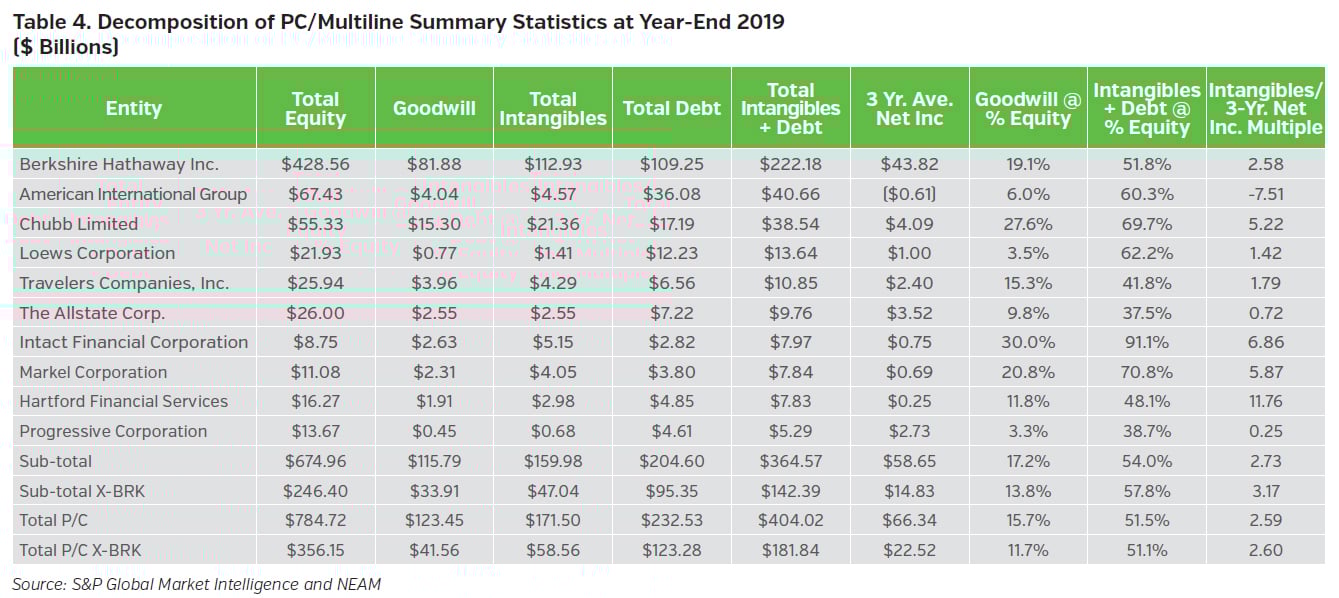
The last column of Table 4 shows the multiple of total intangibles to the average of the last three years’ net income. This reflects the number of recent years’ average earnings needed to offset a complete write-off of all intangibles. There is wide variation in the multiple. The range is from -7.51 (reflecting negative income) to 11.76 (reflecting positive but low income relative to the amount of intangibles).6
The PC/Multiline segment “payback” period is 2.6 years with or without BRK. This compares to 1.9 years for the traditional L&A segment and 8.5 years for the managed care segment. Taken as a whole, the dominant risk-bearing segments of the insurance industry and most companies within these segments are not over burdened with goodwill and other intangibles. Yet, prudence will dictate these additional leverage components should be accounted for within the enterprise capital return and risk management process.
Key Takeaways
- The framework for calculating and testing goodwill are under examination by the FASB initially limiting any impact to GAAP filed statements.
- The combined impact of total intangible assets plus debt in relation to reported GAAP equity and net income is manageable for the two largest risk-bearing segments.
- Managed care companies’ equity and income exposure to the sum of total intangibles and debt is 4 times and between 3 to 4 times greater than the risk-bearing segments, respectively.
- Regardless of segment, total intangible assets and debt increase insurer leverage and should be accounted for within the enterprise capital return and risk management process.
The next edition of Perspectives will complete the Enterprise Trilogy: The Intersection of Capital, Underwriting and Investment Management Opportunities by demonstrating the impact of the utilization of goodwill, debt and asset derivatives’ hedging on asset allocation. In the interim, if you would like to learn more about NEAM’s Enterprise Capital Return and Risk Management framework, please feel free to contact us.
Endnotes
1 Individual states might allow for more conservative treatment of assets on a very selected basis.
2 Statutory surplus is key reference point for risk based capital charges (RBC) and insurance regulatory information system (IRIS) ratios.
3 Investment grade securities are reflected in surplus calculations at book value (not market value) on the presumption their maturities are matched to the duration of insurer policy obligations. Below investment grade fixed income securities (and those marked as other than temporarily impaired (OTTI) securities) and equities are carried at market value.
4 “PC” and “L&A” refer to property-casualty and life & annuity companies, respectively. “MC” refers to managed care companies. The “All Other” category includes brokers and title insurers.
5 The situation creates a unique circumstance wherein the GAAP filer could experience a severe impairment of reported capital whereas the statutory subsidiary would be confronted only with surplus loss due to margin pressure. Statutory surplus on managed care companies total $65 billion at year-end 2018. GAAP equity and goodwill were $146 billion and $135 billion, respectively.
6 This multiple is somewhat akin to the asbestos and environmental survival ratio within the P&C industry.


