During the 1Q of 2016, the bull market celebrated its seventh birthday. This milestone was not met with the usual revelry, but rather pronounced volatility as the S&P 500 posted its worst start to the year in recorded history before staging a remarkable comeback. More specifically, the market tallied slightly over a 1% return for the quarter, rallying back from the over 11% deficit reached in early February. Notably, this is the first time the market has fallen by more than 10% within a quarter while finishing positively since 1933, according to data compiled by LPL Financial. Suffice it to say, history was made within this proverbial roller coaster quarter as investors fluctuated between extremes.
At the core, the capital market volatility was driven by China, commodities and central banks; the sharp movement in asset prices represented a dynamic calibration of the odds of global recession. Concerns about global growth drove the initial downward spiral as fears fixated on the negative feedback loop derived from a potential hard landing in China and the resulting commodity complex pressure. The prevailing atypical positive correlation between oil prices and the stock market set the mood, and the equity market tracked the material drop in crude prices. While lower commodity prices are certainly positive for consumers, the deflationary trend can stunt economic growth and corporate earnings. Likewise, the dislocation in oil raised the specter of an emerging market shock and ensuing capital outflows, adding to investor angst. Risk aversion dominated market sentiment, driving capital into safer haven assets like gold and U.S. Treasuries where yields fell over 60 bps at the height of apprehension in the ten year part of the curve. This flight to quality backdrop strengthened the U.S. dollar, reinforcing the circular nature of the negative feedback loop as oil struggled to find a bottom.
The negative cycle reversed in early February driven by China’s assertion that it would manage the Yuan against a basket of currencies, mitigating the chances of a sharp devaluation; this helped the U.S. dollar begin its retrenchment. Additionally, sentiment shifted as prospects for a coordinated production cut to boost oil prices and improving economic data in the U.S. spurred the market recovery. Undeniably, central banks also played a role in stabilizing the market with the large ECB stimulus and dovish commentary by the Federal Reserve Chair Janet Yellen. She signaled a slower pace of rate hikes in 2016, similarly suppressing the greenback. This enabled the market to sustain its gains and close the quarter in positive territory.
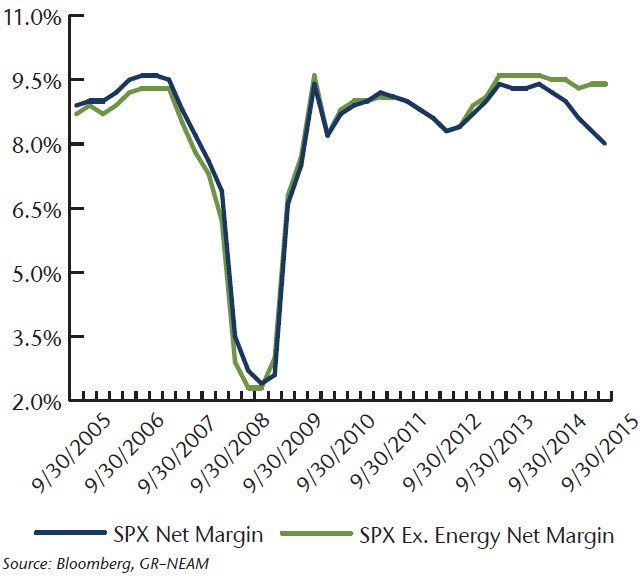
Although the quarter ended stronger than it began, in a maturing equity cycle, high volatility remains a central theme as investors await higher economic growth and earnings prospects to bolster stocks. The correlation between earnings and stock price behavior is well documented; it is imperative, consequently, to understand earnings as a component of prospective market returns. To frame our starting point, corporate margins, as measured by net margins of the constituents of the S&P 500, remain at healthy absolute levels but have fallen in aggregate from the recent peak achieved in 2014, primarily due to the energy sector and the impact of the stronger dollar on multinationals. Additionally, easy monetary policies contributed to demand being front loaded in certain commodity-centric and industrial sectors which are experiencing margin compression as demand slows against an elevated capital base. Excluding energy, net profit margins for the S&P 500 are near these record levels versus the contraction shown on an aggregate basis in Chart 1. Of note, this same trend is mirrored at the operating margin level so lower borrowing costs, while certainly beneficial, have not been a disproportionate aid to net margins.
Chart 1: Net Profit Margins of the S&P 500

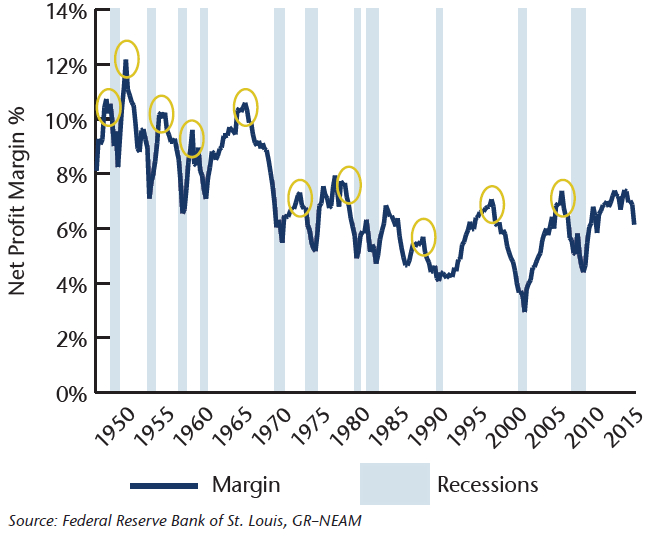
While isolating the energy impact provides some solace, it is too simplistic to dismiss the aggregate contraction in net profit margins of approximately 150 bps from the recent peak. This magnitude could have significance when viewed in the context of the business cycle. As Chart 2 illustrates, there is a historic link between profit margins and recessions in data compiled using the National Income and Product Accounts (NIPA) profits. This data was purposefully used to provide a broadened proxy for economy wide profits versus the S&P 500. This link between profitability and the business cycles is best depicted by the red circles highlighting the predictive power of profit margins, often leading recessions by approximately two years. In addition to our analysis, a study by JP Morgan concluded that declining corporate profits have been closely followed by or coincided with a recession 81% of the time since 1900. Admittedly, this relationship is not without exception, as falling profit margins can be part of a mid-cycle slowdown as evident in the 1980s, a time not dissimilar to the current period characterized by weak energy prices.
Chart 2: Business Cycle and Profit Margins

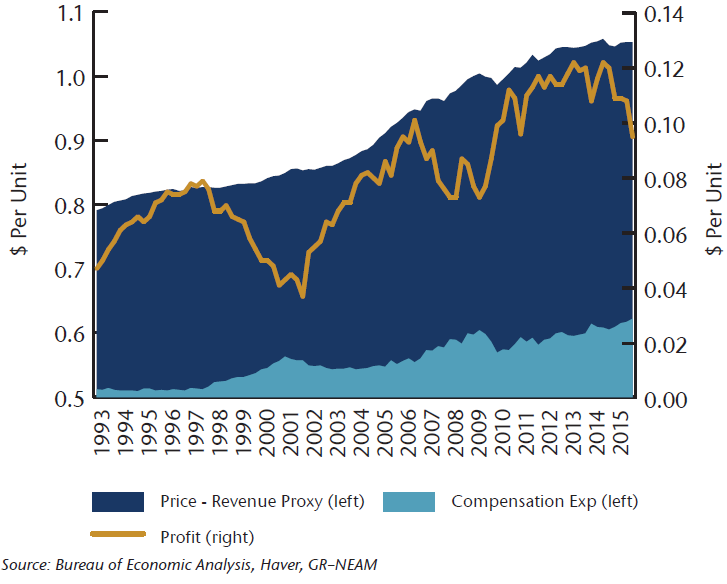
The logical question becomes margin sustainability. It is economically rational that profit margins are a mean reverting series as excess returns are prone to competition or income redistribution from capital to labor. This last point is especially relevant at this stage in the cycle as depicted in Chart 3. Productivity remains weak, resulting in flat output, while per unit compensation expense is rising. Without pricing power and faster revenue growth, corporate profit margins could face challenges. While not yet evident at the net margin level (excluding energy shown earlier), the negative impact on aggregate margins has begun as wage inflation accelerates somewhat from the tightening labor market. This is not all bad as higher compensation levels can lead to better top line growth and initial earnings recovery as consumers spend, but rising unit labor costs may also coincide with peaking margins if companies cannot raise prices.
Chart 3: Lack of Pricing Power

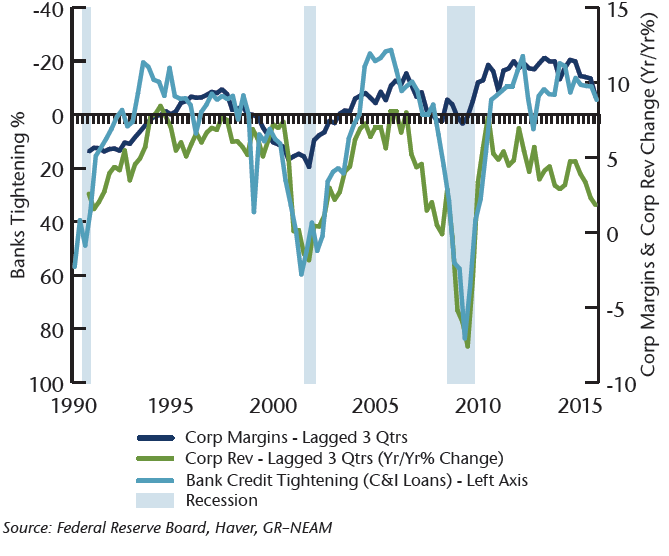
Credit conditions are also important to consider when assessing the profitability outlook. Using the quarterly Federal Reserve Board of Senior Officers Survey, credit conditions generally lead revenue growth and profit margins by roughly nine months, as illustrated in Chart 4. Any further tightening in credit conditions would be negative and reduce the odds of earnings acceleration in the 2H of 2016 despite companies cycling the collapse in oil prices and the heightened drag from FX translation. Credit availability is only one side of this story, however. The other side is the willingness of corporations to invest as a means to increase long term corporate value. Near record profit margins should enable high levels of investment, yet corporate behavior has shown a preference to protect margins or allocate capital to financial engineering versus growth projects (see 4Q Equity Market Review: The Legacy of Financial Engineering). Investment return prospects have also been hindered by global overcapacity, despite abundant liquidity from QE policies. Profit levels themselves typically play a contributing role to the economic cycle by funding investment, yet suppressed real interest rates have led to a moderation in fixed capital investment and contributed to lackluster productivity. Margin compression could further constrain investment appetite, a potential negative for the economic cycle and the equity market.
Chart 4: Credit Conditions

Conclusion
It is illustrative to view profit margins within the context of the business cycle and to ponder what earnings may or may not signal about the current stage and resulting outlook for equities. There are few business cycles that have had a duration longer than the current cycle, and this is the third longest bull market in stock market history. The market is mindful of this passage of time and the increasing macro risks as we simultaneously operate within a low growth, highly levered global backdrop. Monetary policy has not stimulated growth, and there are deflationary undertones to these policies. In a world of subdued revenue growth, future profit margins may be constrained as unit labor costs are increasing and many companies lack pricing power. Credit conditions need to be further supportive for business investment and earnings progress. Overall, we foresee this environment of low nominal growth in interest rates and choppy equity markets continuing. We retain our quality bias amidst higher volatility, less compensation for risk and lower implied returns for U.S. equities in this aging cycle.
Strategy Comments
Focused
In the first quarter, volatility accelerated before receding into a strong risk rally in the 2H of the quarter. From a sector perspective, the portfolio benefited from its positioning in consumer discretionary and materials, key drivers to our outperformance relative to the index. The consumer discretionary positions rose from improved earnings and consolidation beneficiaries. The price of gold rallied significantly during the quarter, profiting our gold miner holdings within the material sector. Stock selection and sector weighting for healthcare and technology also contributed positively to performance. The biggest detriment to the portfolio was financials which were pressured by earnings fears from energy loan losses and contraction in net interest margins in a negative interest rate world. Energy continued to be a drag on the portfolio, rooted in our adverse stock selection more than sector weighting.
We foresee elevated valuations and rising volatility characterizing the market in 2016. Our client portfolios maintain a more defensive posture, overweight in consumer staples and utilities and underweight industrials and financials, to provide some measure of downside protection in this backdrop. As volatility rises, divergence between stock prices and business values will likely return, making stock picking an important means to generate alpha. As such, we will continue to apply our fundamental disciplines to identify attractive investment opportunities and be prudent stewards of client capital.
Dividend Select
In the first quarter, volatility accelerated before receding into a strong risk rally in the 2H of the quarter. Against this backdrop, the 10-Year Treasury rose in price, driving yields lower by 40 bps by the end of the quarter. Consequently, the utility sector materially outperformed given its rate sensitivity, and our portfolios outperformed the market given the structural overweight to the sector. Our underweight in financials aided performance as financials were pressured by earnings fears from energy loan losses and contraction in net interest margins in a negative interest rate world. Additionally, our allocation to consumer staples added value. The portfolio was hurt by energy stock selection, as well as the underweight in industrials.
We did reduce the weighting in utilities during the 1Q given the outsized performance relative to more cyclical areas of the market. We reinvested the proceeds in industrials to increase our sector exposure as well as adding to consumer staples and healthcare. Subsequent to these modifications, our positioning continues to reflect a large allocation to utilities, and we likewise maintain our overweight in high quality, stable companies in consumer staples and healthcare. Our portfolio construction aims to attenuate risk in a market downturn. In the meantime, the strategy generates a greater than market average 3.5% dividend yield exceeding the broad market average and roughly double the yield of the 10-Year U.S. Treasury.


