Fear or Greed?
For much of 2012 through 2014, investors clearly chose greed as the S&P 500 Index rallied 16%, 32%, and 14% interspersed with the occasional mini-bout of caution. In September of last year, fear made an appearance, pounding on the door like the wolf in the proverbial fable and threatened to blow the house down. The combination of a spiking dollar, a slowing global economy, especially in emerging markets, and sharply declining crude oil prices sent the markets into turmoil. Since then, U.S. equity markets have oscillated between fear and greed, with heavy selling followed by buying strength, only to retrace downward with more selling. Clearly, the equity markets are experiencing crosscurrents and investors are vacillating with the tidal change of news headlines.
In these uncertain markets, it is best to build your house of stone by adhering to a disciplined investment philosophy, focusing on both risk and return. This helps investors to avoid the inevitable whiplash that arises from constantly changing portfolios while chasing the shifting winds. As value investors, we consider both risk and return when selecting securities, choosing those that in our opinion offer sufficient compensation for the risks we take.
Before evaluating risk and return, we must identify appropriate measures for each, the combination of which offers predictive value. For return, we can use the inverse of the Shiller Cyclically Adjusted Price to Earnings (CAPE) ratio; this measure takes the current market capitalization of the S&P 500 Index and divides it by normalized real earnings. Hence, the reciprocal of the Shiller CAPE gives you the earnings yield of the market. In assessing risk, we use the equity risk premium, which is defined as the earnings yield less the real 10-Year Treasury rate. The equity risk premium is thus the spread an investor is expected to return on stock earnings over that of the risk-free rate.
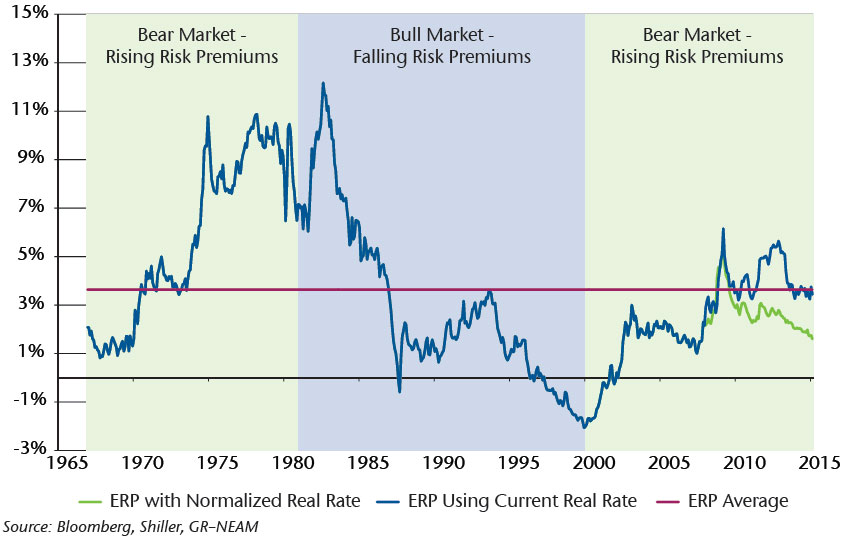
The two metrics combined illustrate the risk/reward proposition being offered in the markets. It is clear from the definitions that the two are truly twins. Lower compensation for risk is partially driven by a low earnings yield, which is synonymous with high valuations as defined by the Shiller CAPE. Equity risk premiums are not static over time, but fluctuate with investors’ perception of risk in secular market cycles. Sentiment drives these cycles in the equity markets whereupon valuations rise and the price of risk falls in a secular bull market. The opposite is true in a bear market. In Chart 1, it is clear that risk premiums can stay above and below the average for long periods, driven by the secular cycle. The key, then, is to understand what kind of cycle prevails.
Chart 1: Equity Risk Premium

One can divide Chart 1 into three sections: the first being the bear market of the 1970s where valuations became quite attractive and interest rates were high; the second being the bull market of the 1980s and 1990s where valuations were steadily rising and rates were falling; and the third being the bear market that began in 2000, and one, we would argue, continues to this day. Since 2009, the Federal Reserve’s implementation of the zero interest rate policy (ZIRP) has forced rates to historical lows, in effect inflating the price of risk (blue line in Chart 1). Despite the robust equity market, the risk premium looks to be near historical averages. However, if rates were to normalize to the average real rate, as defined by the TIPS market since 1997, the equity risk premium would be under 2%, materially below the historical average. Given where we are in the secular bear market cycle, we would expect an upward tug to the equity risk premium. On top of that, the Federal Reserve is debating the path forward for increasing interest rates. Betting that real rates will persist forever at extremely low levels is akin to building a house of straw, susceptible to the next heavy gust.
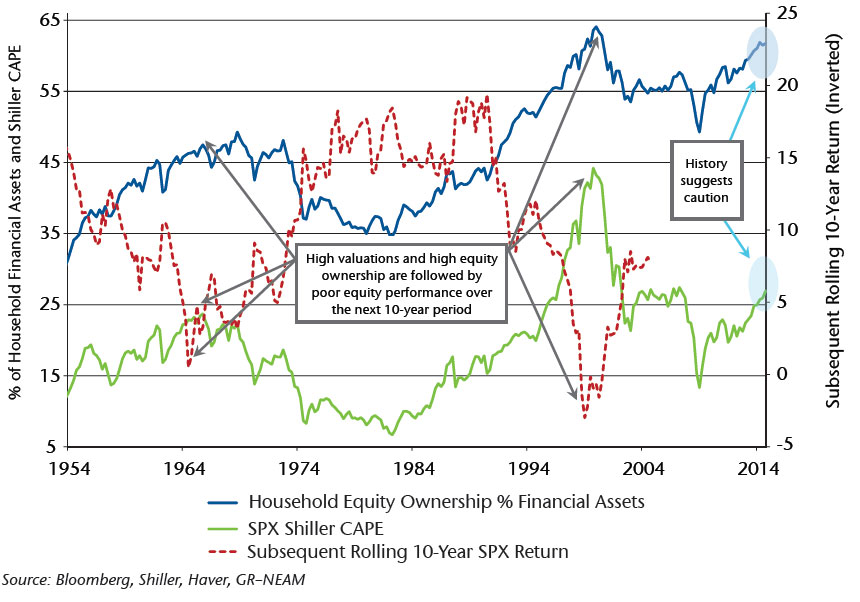
With the compensation for risk low, we would expect its twin, expected returns, also to be low. Said another way, we would expect the reciprocal of return, or valuation as depicted by the Shiller CAPE, to be high, as seen in Chart 2. The chart also shows that the Shiller CAPE is negatively correlated to future 10-year returns (red dotted line). As stated earlier, sentiment is the ultimate driver of valuations. Optimistically inclined investors tend to increase their concentration of equities, driving up prices. Similarly, more pessimistic investors tend to decrease their concentration of equities, causing prices to decline. Investor sentiment can be measured by the level of household equity ownership. The higher the ownership rate of equities, the more positive the sentiment. Eventually, the level of equity ownership reverts to long-run averages over time. This mean reverting tendency is the driver of the Shiller CAPE’s predictive capabilities.
Chart 2: Shiller CAPE, Subsequent Rolling 10-Year Return and Equity Ownership Concentration

Today, the Shiller CAPE stands at 27x and equity ownership is at near record levels, comprising over 60% of household financial assets. Historically, these metrics suggest muted equity performance in the future. These extremes in valuation and sentiment are typically resolved by falling stock prices, which boost the equity risk premium and lower valuations. With both returns and risk unattractively priced, we believe U.S. investors should err on the side of caution when putting more capital into the equity markets.
The timing of a reversal of current conditions could be tomorrow or in the next few years, and being completely out of the equity markets would be taking caution to the extreme, especially when some individual companies provide relatively attractive dividend yields and growth prospects at fair prices. A portfolio constructed with stocks that are attractively priced on an individual basis may provide some measure of downside protection when risk is repriced, and yet still be able to participate in rising markets.
Currently, we are finding these attractively priced stocks primarily in the energy and healthcare sectors. Energy stocks are pricing in aggregate oil prices far below marginal cost of production; historically this condition most likely resolves itself in an intermediate timeframe. The healthcare sector is going through the throes of consolidation, and in our opinion, the resulting entities should enjoy boosts to earnings and return on capital through economies of scale and synergies. Our client portfolios may not be able to chase the ebullient pace of the markets when risk is being ignored and returns are paramount, as our underperformance in recent years would testify. However, like a house built of brick and stone, our client portfolios are positioned for the eventual return of the big bad wolf.


