Introduction
In this Perspectives, we explore the utilization of asset allocation and reinsurance to achieve enterprise de-risking. We find asset reallocation combined with reinsurance to be the most effective means to manage an insurer’s return/risk profile following a more holistic enterprise-based framework. We believe there are few true caveats to the findings; however, several admonitions are offered impacting applications to individual companies.
Property and Casualty insurers’ operating environment is rapidly changing, which is affecting many different facets of their business. Telematics, cyber risk, climate change, tort capitulation, and other factors, are altering policy conditions; alternative capital sources and InsurTech are challenging entity structures and processes; rating agencies’ focus on enterprise risk management (ERM) is impacting solvency capital standards; and, regulators’ pursuit of evolving global social norms, such as environmental, social and governance (ESG) requirements, are impacting insurance and investment activities. In this landscape, low bond yields and volatile equity markets remain.
Against this background, executive management must decide risk preferences and tolerances, capital levels and structure, product mix (customer base, coverages and geography), asset allocation, and risk mitigation strategies, such as reinsurance and asset hedges. These critical decisions are often made in organizational silos without considering their interdependencies possibly resulting in sub-optimal outcomes. A simple and uncluttered “Enterprise” approach provides a uniform framework and common language to enhance the decision-making process. In future Perspectives, we will review additional business strategies.
The Reinsurance Decision
Reinsurance can serve several objectives for insurers, including achieving product and portfolio capacity, managing volatility and responding to various stakeholder pressures. Quota share arrangements are particularly useful to achieve the capacity objective. Excess of loss structures can readily meet the volatility objective. And, either basic reinsurance format might be further customized to satisfy specific requirements of rating agencies, regulators, shareholders or other constituents.
Regardless of the purpose, there is a cost to the ceding insurer in terms of reduced premium income and lowered expected underwriting profit due to the reinsurer’s targeted expected profit margin. Additionally, there is a reduction in invested assets from whatever they might have been in a pre-reinsurance setting and a loss of investment income on those assets.
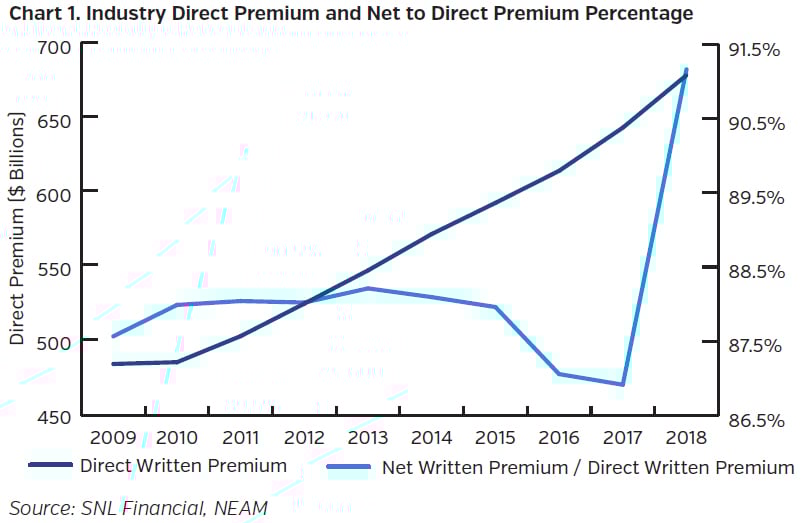
Chart 1 below depicts the level of unaffiliated direct premiums over the last decade and the percentage of net to direct written premiums. The net to direct percentage drifted downward slightly from 88% in 2014 to 86.9% in 2017 as ceded premiums to non-affiliates increased faster than assumed reinsurance from non-affiliates and affiliated transactions were stable. In 2018 ceded premiums to affiliates collapsed by nearly $24 billion overwhelming an increase in non-affiliated cessions of $11 billion. This drove the net to direct premium ratio to 91.2% in 2018, as net premiums spiked upward doubling the reported 2018 growth rate from the prior year. Five companies accounted for over $20 billion of the affiliated cessions’ collapse.
Of greater interest is reinsurance utilization effectiveness. We define reinsurance utilization effectiveness strictly from the cedants’ point of view as the impact upon either their underwriting margin (100.0 minus the combined ratio) or the improvement in the volatility of margin. Chart 2 displays the results for the last 10 years based on statutory filings.1
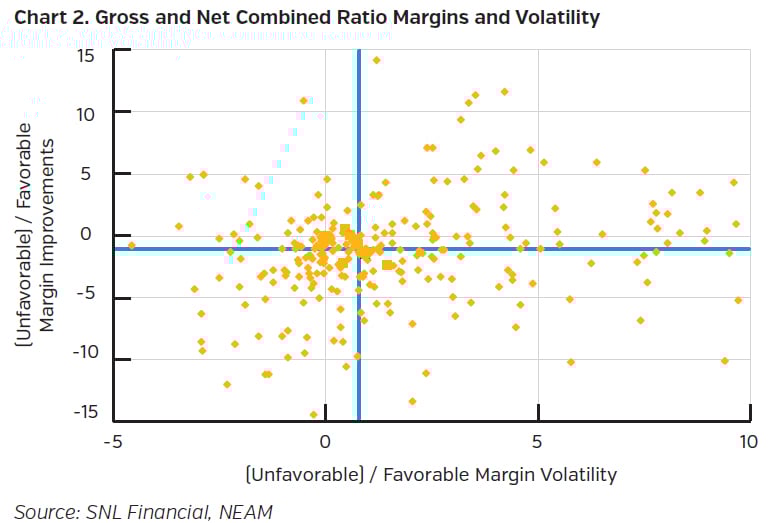
Companies in the southwest zero-zero quadrant (unfavorable margin and volatility) are deemed to have had a less than effective reinsurance experience. Conversely, those in the northeast quadrant have had both very favorable margin and volatility outcomes. We believe these outcomes should not be expected nor are they sustainable, giving rise to the caveats below. The northwest and southeast quadrants show mixed results.2
Ten years might be deemed too short a period and the combined ratio too narrow a metric to evaluate reinsurance decisions.3 However, individual companies can make their own judgments considering their objectives, and all companies should note the wide variation in reported results whether gross or net.
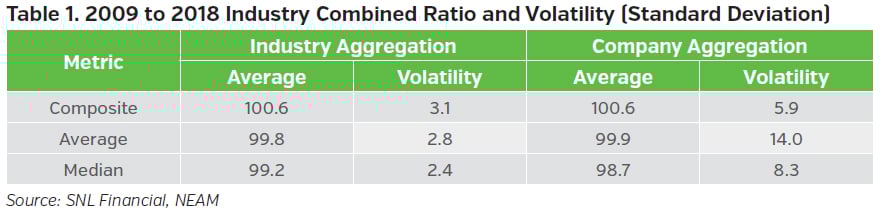
Volatility of industry results measured by composites, averages and medians materially understate the inherent risks faced by individual insurers. Table 1 shows industry-wide statistics in the first two columns and across individual companies in the last two columns. Although the averages of the two methods are nearly identical, there are wide differences in volatility, i.e., the 10-year industry-wide volatility is 2.8 points versus the 14.0 point average of companies’ volatility. Benchmarking to industry underwriting and enterprise risk tolerances might prove to be an elusive target.4
Reserve development is another dimension to underwriting volatility. Industry-wide (see prior admonition), for 24 years ending 2013, five-year reserve development of the initial accident year estimate averaged 3.75 combined ratio points for the 20 years it was favorable. However, in four consecutive years, 1998 to 2001, the five-year development was unfavorable, averaging -4.35 points. These swings greatly understate individual company results. And, whereas the cause might be fortuitous (or the work of government, i.e., N.Y. Child Victims Act), it is not foreseen, most always latent, frequently infectious and very often severe.
The Enterprise Framework
The enterprise framework is straightforward. The drivers of return (and risk) are underwriting outcomes (gross and net of reinsurance), including fee services, investment results (with and without hedging) and capital levels and structure. Business mix and asset allocation are readily addressed, as are debt, derivatives and off-balance sheet items such as pension liabilities.
The “arithmetic” of the enterprise framework is simple, following the DuPont formulation:

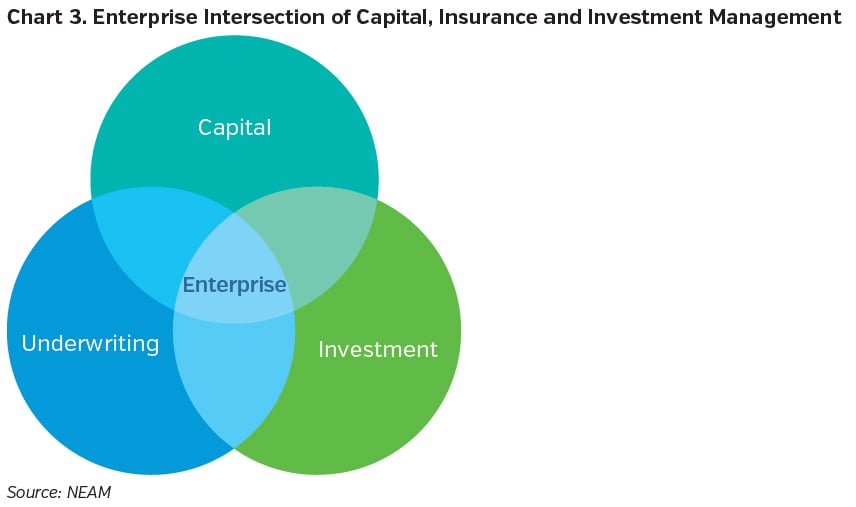
Premium and investment leverage are defined by the premium to capital ratio and invested assets to capital ratio, respectively; U/W margin equals 100 minus the combined ratio; and, investment returns equal the return on invested assets. Net service fees, reinsurance, derivatives and debt are additions or reductions to either revenue, expenses or leverage intended to reduce downside risk or increase returns. Chart 3 shows the “enterprise” at the intersection of capital, underwriting and investment decisions.
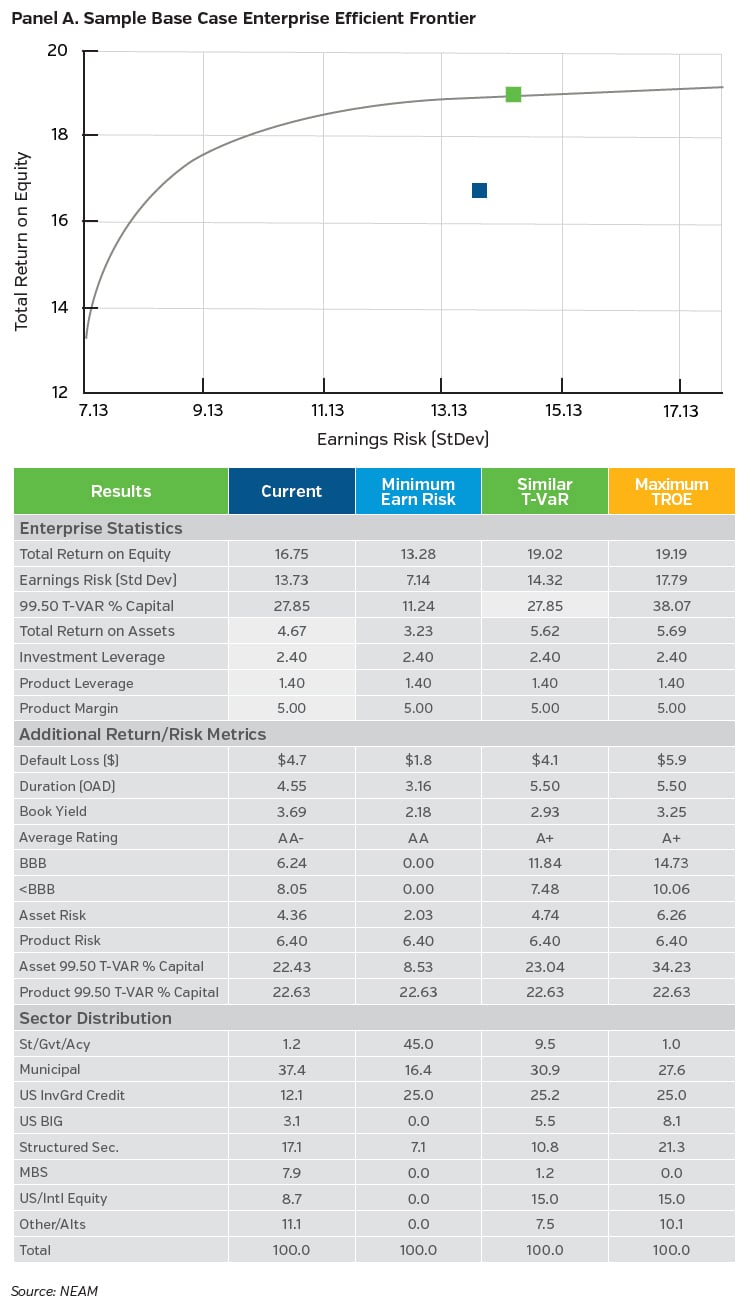
Panel A shows an enterprise efficient frontier and summary statistics for a case study. The base case premium and investment leverage, pre-tax underwriting margin and after-tax total return on assets are highlighted in the first column. Panel A also displays the various points along the enterprise efficient frontier and remains static as the investment portfolio is reconfigured to achieve the highest after-tax total return on equity for a given earnings risk level (or T-VaR).5
The Sample Scenario Outcomes
This Perspectives analysis is conducted on a single period basis consistent with Modern Portfolio Theory (MPT) asset evaluation and rating agency and regulatory frameworks, such as AM Best’s BCAR Model and Solvency II’s Standard Formula. Additionally, asset returns tend to be more symmetric to the downside and mean reverting than potentially extreme asymmetric underwriting losses that are burdened with latent multi-period adverse development. However, more robust statistics will reinforce the conclusion that asset reallocation complementing reinsurance structures is the most effective means of managing (reducing) enterprise risk.6
We present four scenarios in this Perspectives as case study examples; their relevant assumptions are shown in Table 2 below. The base case, already shown above, is merely a starting point before any of the three reinsurance overlays are applied. The initial underwriting margin is 5.0% of premium (95 combined ratio). Underwriting volatility is 8.0 combined ratio points pre-tax (6.4 points after-tax in Panel A). In each reinsurance scenario, we focus on achieving an estimated enterprise 99.5 T-VaR of 20% of capital, i.e., reducing downside risk from the base case enterprise T-VaR of 27.85%.
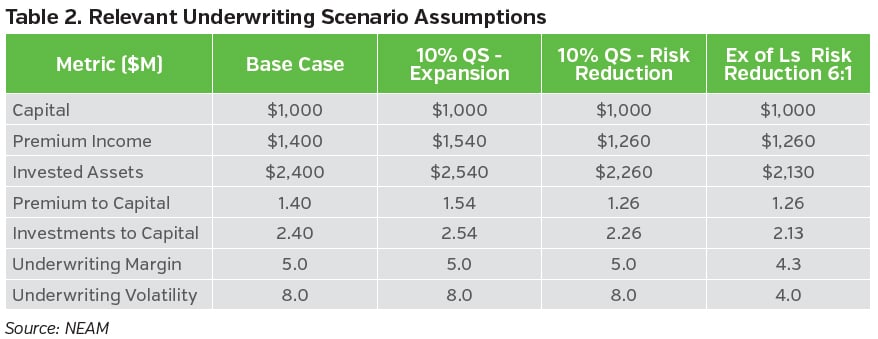
The first reinsurance overlay in Table 3 represents a 10% quota share used to expand premium writings sufficiently to result in a 10% net premium income increase. The underwriting margin and volatility are assumed to be unchanged, implying no degradation due to premium growth or over-rides.
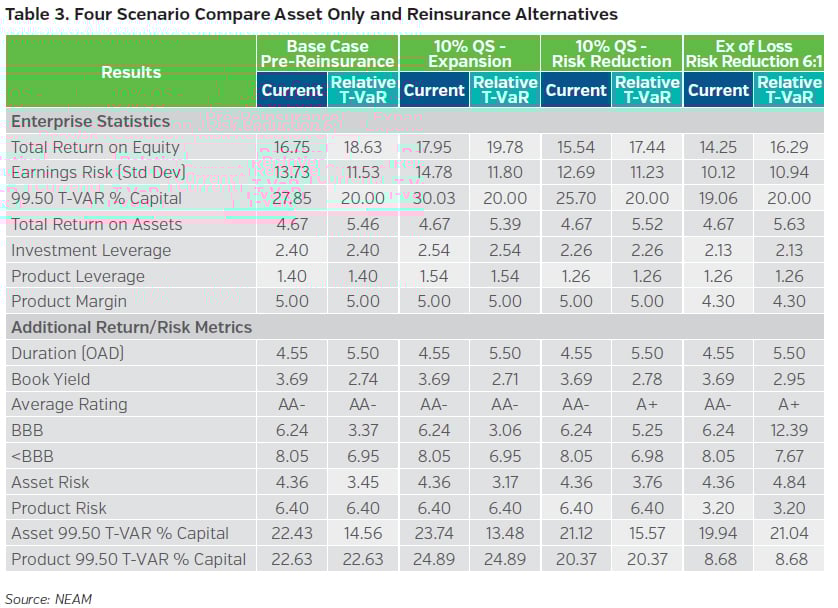
With the 10% risk reduction quota share the purpose is to reduce net exposure without losing market access. Premium income simply contracts and leverage declines. The combined ratio and volatility are unchanged.7 The initial (current) enterprise and product T-VaR are several hundred basis points less than the Base Case and enterprise risk is further reduced to the 20% target by asset reallocation.
The excess of loss risk reduction scenario shows a 10% premium leverage reduction and a haircut of investable assets, due to assuming larger (and slower paying) claims will be swept to the reinsurer. Also, of greater significance, is that the underwriting margin is assumed to be eroded 0.7 points and the underwriting volatility is reduced 4 points for a nearly 6:1 (4.0/0.7) benefit to cost ratio.8
It is noteworthy that the excess of loss case shows more than a 60% reduction in product T-VaR to 8.68% of capital from the initial base case level 22.6%. This is due to a nearly six times reduction in product risk (4 points pre-tax) relative to 0.7 points of product margin reduction and reduced product leverage. Although product risk is reduced 50% (from 6.4 to 3.2), the level of product downside risk of loss (product T-VaR) is reduced by more than two-thirds. In this scenario the initial enterprise T-VaR of 19.06 is less than the 20% target, allowing for a higher level of asset risk and return.9
Key Takeaways and Next Steps
NEAM’s enterprise framework offers a simple yet comprehensive approach to examine many of the inter-related financial decisions made by insurers as they seek to enhance sustainable risk-adjusted returns on capital. In this Perspectives, we examine alternative asset allocations and reinsurance overlays to determine the most efficient means of de-risking the enterprise’s return/risk profile.
These are our key takeaways:
- Across the Enterprise many strategic decisions are required involving underwriting, investment and capital management. To capture their interdependencies and enhance the decision-making process, an Enterprise framework providing a common language needs to be pursued.
- Conventional asset allocation reviews most often rely upon near symmetric single period asset return and risk metrics. Relying upon asset allocation exclusively to manage an insurers’ enterprise return/risk profile is an incomplete and uncertain solution.
- Insurer underwriting outcomes are often severely asymmetric which develop adversely over multiple years. Including losses arising from unanticipated events, insurers can realize adverse experience from multiple underwriting years in a single calendar year.
- An asset allocation-only strategy cannot provide immediate surplus relief, other than possibly reduced BCAR or RBC capital charges, nor lower leverage, and neither can it contain unexpected emergence of insurance outcomes. Only reinsurance can accommodate the former objectives and significantly dampen the volatility associated with the latter events.
- Optimizing reinsurance structures with a simultaneous overlay of asset reallocation allows for the partial financing of single period reinsurance costs via enhanced investment returns within overall enterprise risk tolerances facilitating the multi-period benefit of reinsurance structures.
- Outcomes are highly dependent on company specific underwriting results, reinsurance terms and conditions and capital market options. That noted, we believe there are meaningful opportunities for executive management to explore more holistic enterprise-based solutions as they overcome shortcomings of traditional methods.
Future editions of Perspectives will demonstrate the impact of product mix and the utilization of debt and asset derivatives’ hedging upon asset allocation. In the interim, if you would like to learn more about NEAM’s enterprise framework please feel free to contact us.
Endnotes
1 Each dot in Chart 2 represents one of the 480+ companies in the NEAM database. Their combined premiums and assets total in excess of 97% of the industry’s 2018 total.
2 The acceptance by cedants of outcomes shown in the northwest and southeast quadrants is very much dependent upon their assessment loss exposure and their utility function for loss avoidance versus the certainty of paid reinsurance premiums.
3 For example, natural catastrophe losses were relatively benign in this period and might impact the results relative to a longer-term view; and, latent injury claims were relatively subdued, not generating the magnitude of loss or publicity of the 70’s or 80’s.
4 We are very much aware of the asymmetric outcomes to which insurers are exposed from either large attritional commercial losses or contagion, including natural catastrophes. The metrics to isolate those conditions are merely an extension of the enterprise approach demonstrated in this Perspectives.
5 Tail Value-at-Risk (T-VaR) is our preferred measure of downside risk and is derived with fully accounting for the asymmetric nature of insurance and investment outcomes. It is expressed as a percent of capital and reflects losses within a specific time interval at a set confidence level.
6 This topic will be explicitly addressed in the next edition of Perspectives focusing upon the combined impact of insurer product line mix and asset allocation in pursuit of incremental returns and/or risk reduction.
7 Any change in premium levels and associated product margins and volatilities requires scrutiny in actual practice and remains the purview of client evaluation.
8 The 6:1 benefit to cost ratio is analogous to the conventional notion of “rate on line,” in this case approximating 15%. A higher rate on line would widen the differential between the base case asset allocation outcome and the excess of loss reinsurance outcome. The converse is true as the rate on line is reduced.
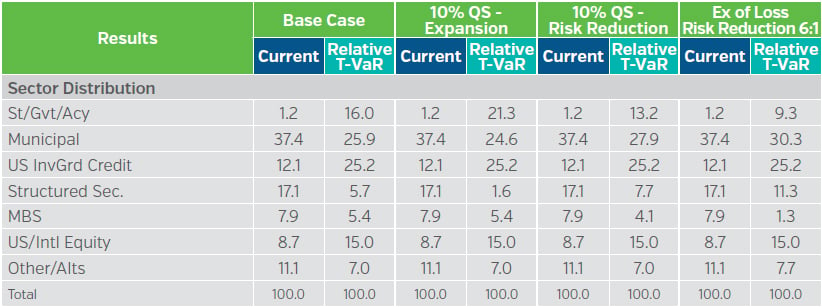
9 Sector allocations for the scenarios are shown below. The asset allocations (class, fixed income sector, duration and credit quality) reflect optimization across over 120 indices to which actual holdings and opportunities are possible.