
Many articles discuss enterprise risk management (ERM) and provide compelling reasons to establish and measure risk preferences. Some say that an effective and prudent enterprise risk and capital management process requires a well-articulated risk appetite framework. But, how does one define what that risk appetite should be?
As companies aim to allocate capital across the enterprise efficiently to generate acceptable returns and manage risk, what factors should be contemplated? What stakeholder expectations should play a role? And once a risk appetite is defined, how does one measure this intrinsic, yet illusive component of superior ERM?
In this issue of Perspectives, we explore these questions and in defining and refining risk preferences. Some organizations with relatively less risky enterprises cluster with higher returns to capital, higher financial strength ratings and higher valuations. However, the relationship between enterprise return and risk is not necessarily linear.
Defining Risk Capacity, Risk Appetite and Risk Tolerance
We consider enterprise risk capacity as an insurer’s capital position, which is consistent with many regulators and rating agencies’ approach to measuring solvency and financial strength. The level of an insurer’s balance sheet capital (or surplus) is considered in relation to a risk-based (or economic) capital value based on an insurer’s operations. This is usually articulated in a probabilistic framework with explicit confidence levels or with capital ratio levels that may implicitly correspond to confidence levels. All else equal, the higher the balance sheet capital relative to risk-based capital, the stronger the solvency or ratings’ level.
There are different definitions for risk appetite and risk tolerance, though sometimes these terms are used interchangeably. For the purposes of this discussion we define these two separately.
Risk appetite is the range of risk types that an organization is able to understand, select and price effectively over time, supporting the firm’s earnings and value proposition. The definition might embody different insurance products, asset classes or other opportunities that an organization has the capacity and understanding to assume. Risk tolerance is the amount of those risks that will be assumed over a period. The former is more qualitative and strategic, coinciding with operational objectives; the latter is quantified and often linked to a portion of risk capacity such as capital-at-risk or earnings volatility.
Value-at-Risk (VAR) is commonly used to quantify the risk of capital loss and an insurer might measure its risk tolerance, and ultimately frame its risk appetite, using this metric. VAR is often articulated as a  percentage of capital loss not to be exceeded over a period of time, given a certain a level of confidence (Figure 1). An extension of VAR is Tail Value-at-Risk1 (T-VAR), which measures the expected loss if the VAR threshold is breached. Thus, T-VAR has the advantage of estimating the expected loss in the tail, which could be significantly different from a VAR estimate if an insurer has a sizeable tail-risk exposure common to property catastrophe insurance and equity-like securities. T-VARs are particularly of interest to regulators and rating agencies.
However, risk tolerance need not be limited to tail risk measures. An insurer may welcome a degree of uncertainty with earnings if the compensation of that risk is appropriate – i.e., high risk-adjusted return on equity (ROE). Striving for an acceptable ratio of return versus risk is a particularly relevant component of risk tolerance for publicly-traded insurers where shareholder scrutiny of periodic earnings is linked to stock valuations.

Consider a fictitious company called ‘Conservative Insurer,’ which has determined that its target enterprise 99.5% VAR is just under 10% of capital and its associated T-VAR is 12%. This suggests that if a 0.5% potential loss event were to occur in the balance sheet, the expected capital shortfall in that 0.5% likelihood range would be 12%. This target T-VAR can be considered as a capital-at-risk estimate and Conservative Insurer’s aggregated risk tolerance. A benefit of T-VAR is that it forms one common measure of risk, making comparisons across different risk types such as investments or underwriting easier
Once Conservative Insurer’s risk tolerance is known, appropriate levels of capital can be allocated across the enterprise within that tolerance. It can set risk budgets to underwriting and investing specifically while maintaining enterprise tolerance ranges generally.
Challenges in Calculating Risk Tolerances
T-VAR estimates are based on different sources of returns across the enterprise, what those returns are expected to be, their variability, how they relate to each other, and their distribution characteristics. Stochastic or deterministic approaches are used to aggregate these elements. But, these are estimates and there are inherent errors in any modeling process. Parameters may not be specified correctly. Data may be incomplete or inaccurate. There may be operational risk within the systems supporting the VAR estimation process. Or there may simply be human error. Dislocations and stresses to the economic landscape elevate model uncertainty and further challenge the reliability of downside risk estimates. Risk tolerance frameworks must recognize this.
Scenario-, sensitivity- and stress testing can help isolate some of the measurement error associated with T-VAR. Sensitivity awareness of key model parameters, such as volatility estimates and correlations, can be enhanced with such testing. For example, historic trends can provide some baseline for parameter estimates, but during extreme events volatility or correlation characteristics may deviate from their historic tendencies. Over reliance on a particular data path may result in understated tolerances and incorrect risk monitoring calculations. And, there are several ways to calculate a T-VAR which adds to the confusion of risk tolerance quantification. This can lead to less than optimal investment choices or inefficient capital allocation. Model testing and vetting can take these possibilities into consideration, while fostering a consistent perspective across an enterprise’s leadership.
Stress-scenario tests are particularly useful in understanding a T-VAR number. Management faces a deluge of risk statistics and financial data. However, risk metrics in isolation can easily become nebulous, particularly to the casual user. Framing these metrics with various events that have occurred, or may potentially occur, can provide management with tangible references to compare with risk tolerance measures.
Establishing Risk Tolerance Targets – Understanding Stakeholder Expectations
Determining an appropriate target T-VAR is one of the biggest challenges for many of NEAM’s clients. Graph 1 provides a scatter plot of the historic T-VARs for the industry as of year-end 2015. The green cross-hairs provide medians indicating the median 99.5% T-VAR was approximately 15%. Our calculations start with approximately 390 U.S. insurance groups with assets greater than $50 million and with a published A.M. Best rating. Data was as of year-end 2015. Historic T-VARs were estimated for each group using its reported ROE and associated volatility as far back as data was available for that company. Our assumption is that a firm’s estimated T-VAR is at the desired range and, therefore, its implied risk tolerance.

The scatter in Graph 1 shows an industry median 15% T-VAR, which is clearly not a “one-size-fits-all” risk tolerance for the industry. There is a clustering in the upper left of the graph, showing a tighter dispersion of T-VARs below the median. However, the appropriate level must consider different (and potentially conflicting) stakeholder expectations2 and risk acumen. Consider our fictitious Conservative Insurer a public firm. The stockholders likely prefer to receive a strong ROE performance with the least amount of sustainable capital possible. In contrast, regulators and rating agencies would prefer (or require) that Conservative Insurer maintain high levels of capital to support the perceived risk characteristics of its balance sheet. Yet even as a capital position is considered, the tolerance of the portion of that capital which may be at risk would still need to be defined. Figure 2 illustrates these different perspectives.
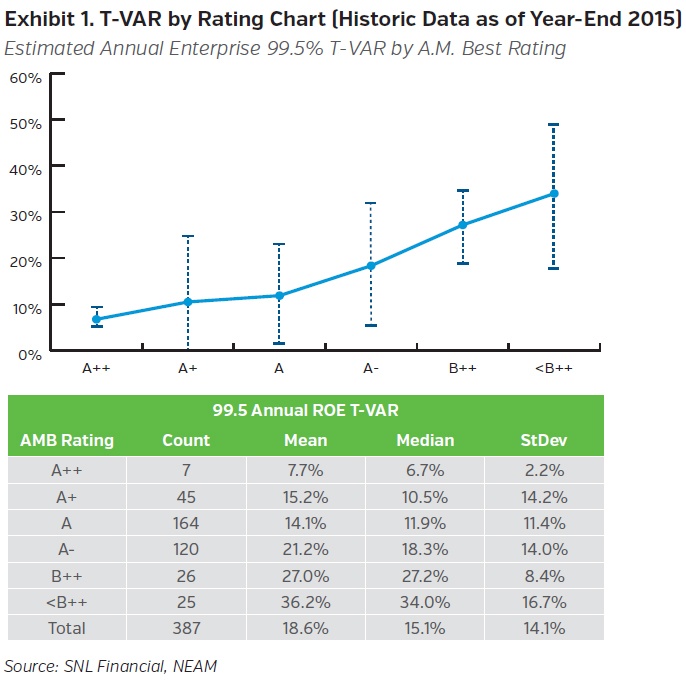
 Rating agencies such as A.M. Best assign higher financial strength ratings to those firms who they deem are in a better position to service their obligations over the period. Capital strength is one of the components to determine a rating. Using the same data sources and T-VAR calculaton methods described above, we tracked ratings and associated T-VARs by company. Exhibit 1 shows the T-VAR ranges by A.M. Best rating levels. We found on average that lower historic T-VARs are associated with higher-rated insurers. This is expected since lower T-VARs suggest lower capital at risk or, conversely, more estimated capital available to service obligations even under severe loss events. Other factors influence a rating beyond capital at risk, but this does indicate, at least anecdotally, that implicit or explicit risk tolerance levels might relate to an insurer’s target rating3.
Meeting regulatory capital ratios, controlling the cost of capital, organizational / legal structure, geographical footprint, or achieving a certain valuation are other examples of influence for risk tolerance ranges. These influencers are not mutually exclusive, and in our example Conservative Insurer may need a tolerance structured to respond to multiple stakeholders, perhaps focusing on the most onerous. Perhaps Conservative Insurer uses rating agency opinions to demonstrate adequate financial strength and appease public shareholders’ expectations of earnings. We can estimate how stockholders view risk tolerances and associated returns based on a simple valuation such as the aggregate stock price-to-book ratio relative to risk-adjusted ROE. Graph 2 represents five price-to-book ratio buckets in which 92 publicly-traded U.S. insurers4 were placed, as listed by SNL Financial for year-end 2015. The mean and median ratios of ROE per the standard deviation of those returns were calculated for the firms within each price-to-book bucket. Generally, those firms with higher risk-adjusted ROE are associated with higher valuations.
 When we overlay rating levels and ROE, we see that when firms are able to exhibit both higher ratings and higher ROE, they tend to do so with relatively low T-VARs. Apparently these firms have been able to maintain T-VARs that are within optimal risk tolerance ranges that appease rating agencies, but also produce favorable ROEs for stockholders. Table 1 uses the same listing of insurers and calculation methodology used for Exhibit 1. It shows how ROE corresponds to T-VAR ranges and A.M. Best rating levels jointly. Generally, firms with high ratings coupled with low T-VARs, on average, have been able to generate the highest ROE. For example, only firms rated “A” or higher while maintaining T-VARs below 25% of capital, as noted in the highlighted cells in the second column, were able to achieve ROEs of 8% or more.

The components of risk tolerances can have dynamic properties as well. Insurance market temperaments might suggest that prevailing pricing, terms and conditions for certain product lines are very soft. Management may wish to curtail writing those lines or may seek alternative risk retention strategies as a result. Likewise, uncertain fiscal and monetary policies associated with regime change might suggest an alternate exposure to interest rates or credit risks is prudent over the period. These aspects do not necessarily imply that a product line or an asset class falls out of Conservative Insurer’s risk appetite, but it may suggest limiting the tolerance of capital exposure to these areas over the current period or until the risk-return trade-offs improve. Therefore, while risk appetites (those risks insurers attract and are compensated for) are generally constant over time, risk tolerances (the quantity of those risks insurers will retain on their balance sheets) may evolve with market dynamics. As NEAM works with clients to develop and implement investment strategy, this is a significant consideration.
Risk appetite forms the range of risk types that an organization feels competent to understand, select and price effectively. Risk tolerance is the amount of those risks that will be assumed over a period, and is typically linked to a firm’s available capital or its risk capacity.
VAR and T-VAR are metrics that can coalesce risks with different return characteristics and unique measurement traditions into a common expression. Such downside metrics are important contributions to ERM and the investment management process. There are several ways to measure risk tolerance in a VAR or T-VAR context. Yet, even the most advanced approaches to model and aggregate risk are not without imperfection. Moreover, different stakeholders may have different expectations as to what risk tolerance levels are acceptable. It is critical that management is comfortable and consistent with the T-VAR levels and calculation methodology chosen, otherwise period-to-period comparison and the resulting decision-making process can be undermined.
Firms with strong ERM align their risk appetites and tolerances to the expectations of their stakeholders, while being mindful of their own risk acumen and capabilities. However, insurers often find it challenging to identify what the appropriate ranges should be for their risk preferences. While risk tolerances ought not to be a prescriptive one-size-fits-all measure, there are four stakeholder considerations worthy of consideration:
- Peers: Industry historic T-VARs have medians of approximately 15% of equity capital
- Rating agencies: Firms with the highest A.M. Best ratings tend to exhibit the lowest T-VARs
- Common stockholders: Public firms with higher risk-adjusted ROE have shown to have the highest valuations
- General: Some insurers that produce the highest ROE also have the highest financial strength ratings and lowest T-VAR ranges, but these relationships are not always linear
Prudent enterprise risk and capital management is predicated on maintaining thoughtful and well-articulated risk preferences. This breeds appropriate levels of enterprise risk to assume, and how and where the components of the corporate risk profile will be allocated. Risk budgeting across the enterprise, including the degree of investment risk relative to insurance risk to assume, should complement organizational objectives and stakeholder expectations. As risk trade-offs are optimized, companies position themselves to improve operational efficiencies, enhance value, and sustain their competitive advantages. Stay tuned as NEAM produces additional thoughts on these concepts in the coming periods.
ENDNOTES
1 Also known as conditional tail expectation (CTE) or conditional value-at-risk (CVAR) or expected shortfall.
2 Also see Perspectives January 2017, “Investment Capital Charges: Serving Many Masters - Who Matters to You?”
3 Also note General Review 8/1/2013 - Rating Agency Ratings and Value-at-Risk: The Bias of Size.
4 The initial list of firms sourced from SNL Financial were approximately 140 firms. Those that were more appropriately linked to a group, had negative equity positions, were extreme outliers, or had inconsistently available data over time were excluded from the original list.


