
Executive Summary
This issue of Perspectives will explore the risk and return profile of the U.S. property and casualty (P&C) industry and assess ways this has evolved over time. One mandate of insurance company leadership is to utilize the firm’s risk capacity effectively and ensure that it is aligned with the risk preferences of stakeholders. Part of this effectiveness depends on understanding drivers of a specific company’s return and risk, and how this compares to competitors and the broader industry.
Our analysis shows that insurers’ risk capacity has grown over the past 20 years. However, the utilization of that additional capacity apparently has evolved. Relatively speaking, over the past 15 years more of the industry’s risk budget has rotated towards investments indicated by lower average credit quality and higher allocations to common equities. In contrast, underwriting margins have improved and associated volatility has decreased over that period.
The discussion will consider recent trends in four areas: 1) risk capacity - capital and leverage; 2) performance and volatility; 3) redirecting risk capacity; and 4) linkages between insurance and investments.
Review of risk capacity – available capital and leverage
U.S. P&C insurers’ balance sheets have grown steadily over time. Surplus capital determines how much risk an insurer can retain on its balance sheet. Too much risk relative to surplus can challenge solvency ratios and risk capital benchmarks leading to regulatory action and ratings downgrades. However, as capital grows so does an insurer’s risk capacity. Chart 1 shows the moving average of invested assets, premiums and surplus capital for the prior five years ending in 2001 to 2020. We use the moving average to dampen the impact of elevated annual catastrophe events on surplus over time. Annual surplus, invested assets, and net premiums grew at a compounded annual rate of 5.8%, 4.7% and 3.5%, respectively.
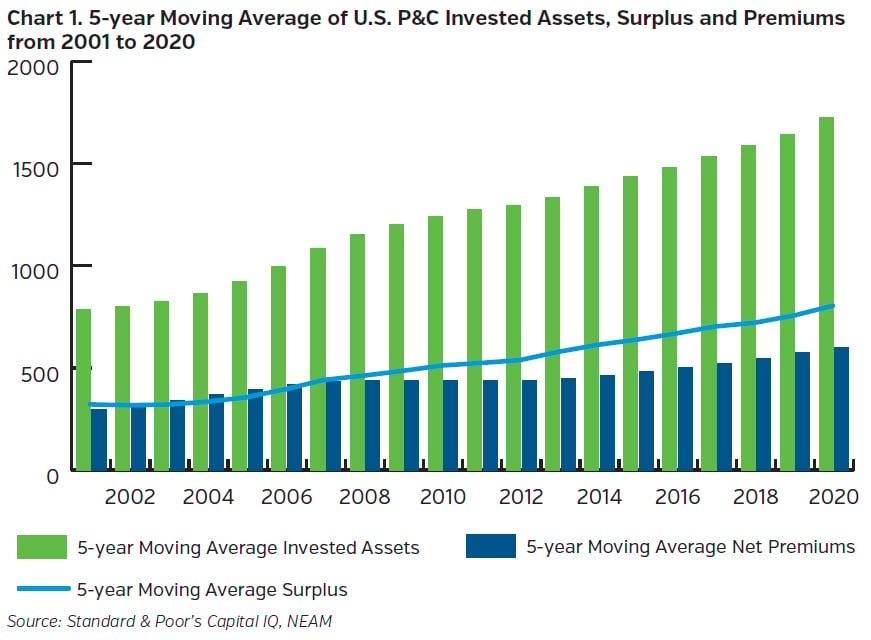
The pace and level of surplus growth lowered investment leverage from 2.7x at year-end 2001 to 2.2x at year-end 2020. Premium leverage fell from 1.0x to 0.7x over this period.1 The Dupont return on equity (ROE) decomposition in Figure 1 shows that leverage and ROE are linked. As leverage falls or rises so does ROE, all else equal. Moreover, the underlying risk associated with ROE is similarly impacted by leverage.

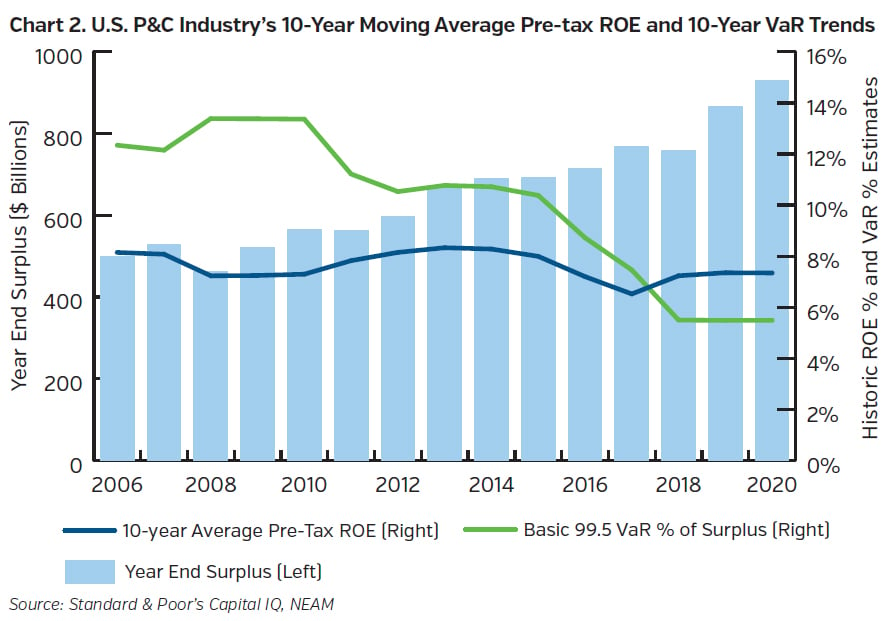
Measuring ROE relative to an enterprise risk metric can level-set enterprise return and show if insurers (and their stakeholders) were appropriately rewarded for those risks. Chart 2 shows how the industry’s pre-tax ROE has trended relative to a simple Value-at-Risk (VaR) estimate, at a 99.5% confidence.2 ROE and the implied industry VaR as a percent of surplus decreased, with ROE outpacing VaR over the past three years. This indicates stronger risk-adjusted performance over time, despite a lower ROE trend.
Redirecting risk capacity
Chart 1 shows surplus, and effectively risk capacity, for the industry increased since 2001. Yet the VaR levels in Chart 2 suggest risk capacity utilization decreased over the past 15 years. Moreover, certain indicators imply that U.S. P&C insurers have redirected how they utilize risk capacity. Although investment leverage is down, certain risks among invested assets rose. Insurance premiums grew, but at slower pace relative to invested asset balances and with better margins and decreased volatility.
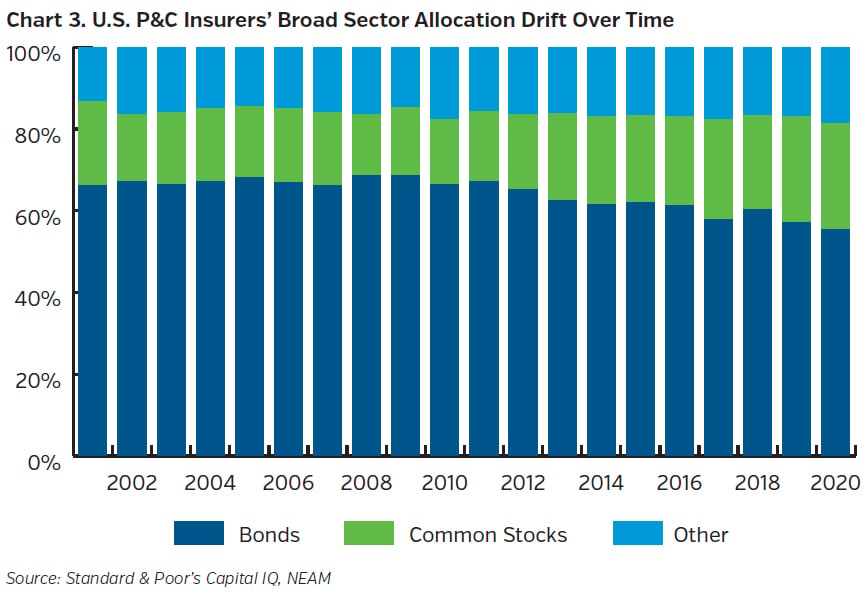
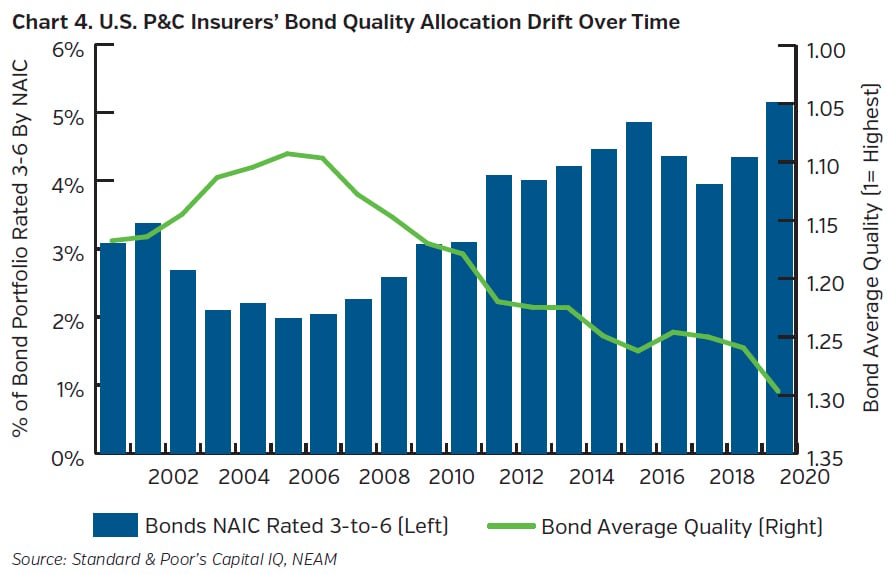
Chart 3 and Chart 4 shows certain investment portfolio indicators, which suggest insurers assumed higher risks within their investment portfolios in recent years. Over time insurers have allocated more to lower quality rated bonds and to common equities.3
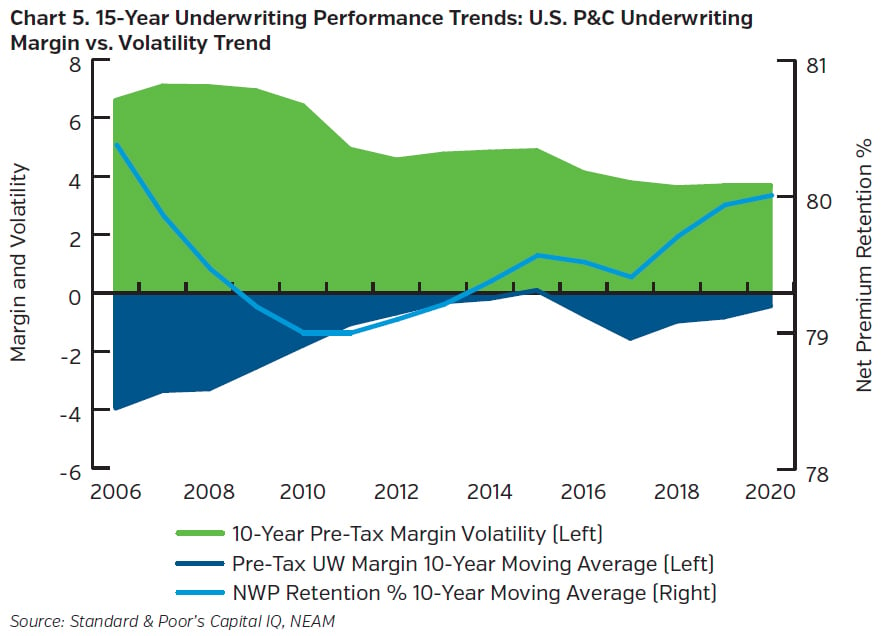
Although certain measures of investment risk increased over recent years, the opposite can be said for insurance risk. We measured the annual pre-tax insurance margin (100 minus the calendar year combined ratio) from 1996 to 2020. Like other trends shown above, we used a 10-year moving average of pre-tax margin over this period to smooth out the effects of outsized and period-specific property catastrophe events and accident year claims development over time. The resulting margin was compared to volatility, which was estimated by the standard deviation of the annual margin over the same 10-year period. Chart 5 shows the result. Over the past 15 years the industry’s insurance risk exposure appears to exhibit less volatility and improved performance.4 It is particularly evident at around 2011, which coincides with the start of an upward trajectory in net written premium-to-gross written premium retention. This highlights the industry trend of selecting and retaining higher margin, lower volatility business.
Improvement in risk and return with insurance operations may increase the risk capacity available for investments. For example, the expected performance from higher risk asset allocations noted in Chart 3 might dampen the impact of declining yields across core fixed income. The apparent trade-off between investment risk and insurance risk shown above is further supported when you consider how risk dependencies within invested assets and insurance products, respectively, have evolved over time. Correlation is a common risk dependency measure, standardized between -1.0 and 1.0. As correlations approach -1.0 diversification increases.
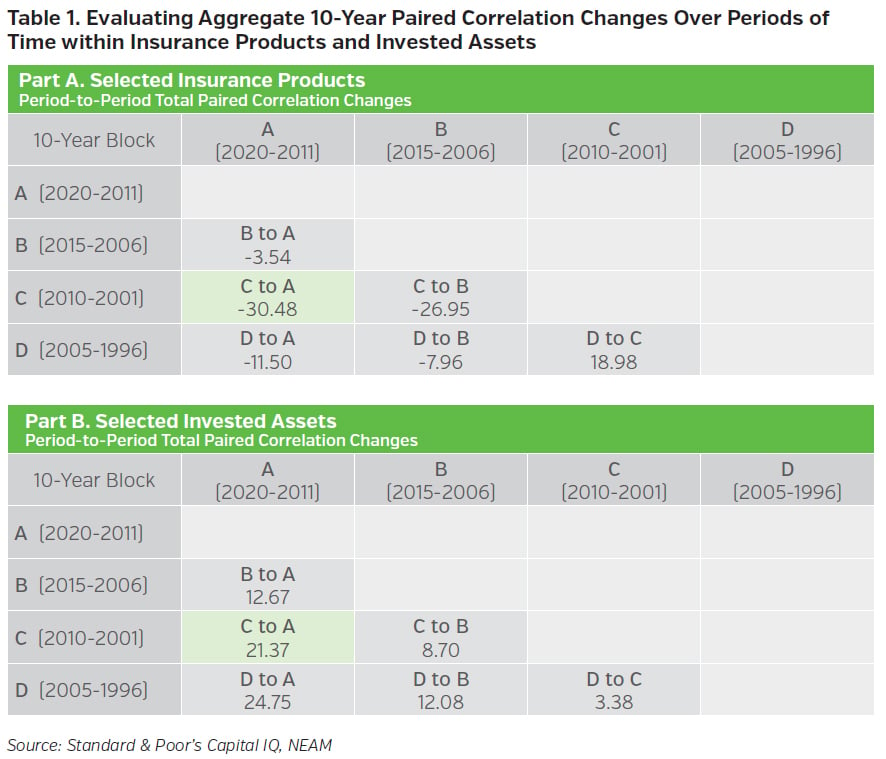
Table 1 lists what we call correlation “drift,” a measure of how the sum of the differences of observed correlation pairs among selected invested assets and selected insurance products have trended over certain periods.5 We first use four blocks of overlapping 10-year periods from 1996 to 2020 staggered every five years. Second, we generate correlation matrices for each 10-year block. Then we measure the total differences in paired correlations across the four 10-year blocks by subtracting an older-years matrix from a corresponding newer-years matrix and summing the differences. Net negative sums indicate correlations are moving towards -1.0. The green box in Table 1, Part A shows that U.S. P&C insurance product correlations6 generally became more negative or less positive across the 10-year blocks. In contrast, Table 1, Part B shows that across each 10-year block the selected invested assets became less negative or more positive. For example, comparing the insurance product correlations for the “A” 10-year block years (2020-2011) to the “C” 10-year block years (2010-2001), the overall paired correlation differences summed to -30.48 (see the green box of Table 1, Part A), suggesting diversification benefits increased. In contrast, the overall correlation changes for invested assets for these periods summed to 21.37 (see the green box of Table 1, Part B), suggesting diversification benefits decreased among investments common to U.S. P&C insurers. The more (less) diversification the lower the (higher) risk, all else equal.
Linkages with insurance and investments
We showed above that there was a subtle shift in risk budgeting between investments and insurance. Indicators suggest underwriting margins and associated risk is improving. A combination of improved insurance risk selection and pricing, moving away from less profitable products or regions, and general changes in risk appetite of liabilities are likely explanations.
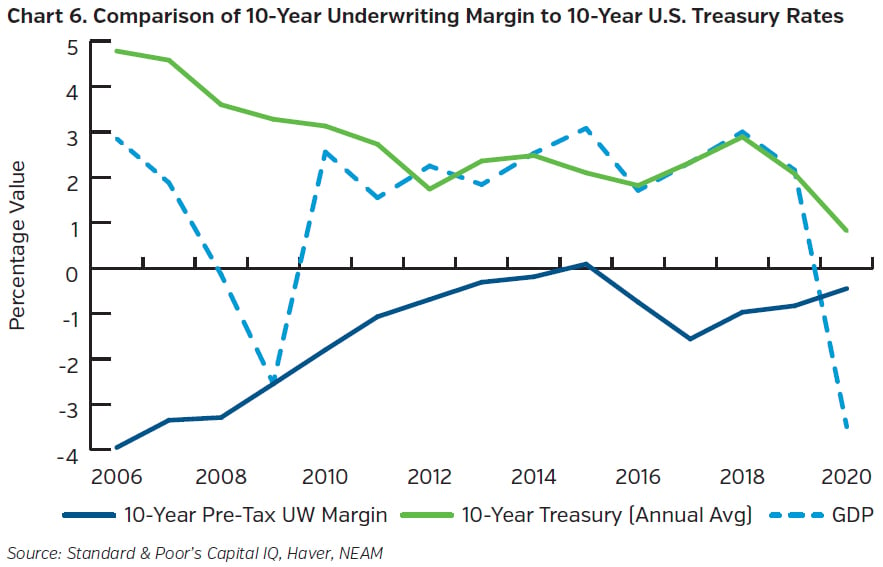
In contrast, investment portfolio risk characteristics in recent years suggest a willingness to assume more asset risk. For example, allocations to lower average credit quality and common stock grew. Perhaps to partially offset the impact of declining bond market yields on portfolio returns. Chart 6 highlights a compelling relationship that supports the motivation for this risk budgeting trade off. The chart shows how underwriting margins shared an inverse relationship with 10-year Treasury bond rates over the past 15 years. Our estimated Pearson correlation coefficient for this two-time series was -0.87. Lower investment yields reduce return on invested assets, which lower the contribution to ROE from investments, all else equal. There are potential offsets to preserve ROE. One is choosing higher return, generating assets that likely are riskier. Another is with improved insurance risk and return choices translating into higher underwriting margins and lower underwriting volatility. It seems the industry is doing both.
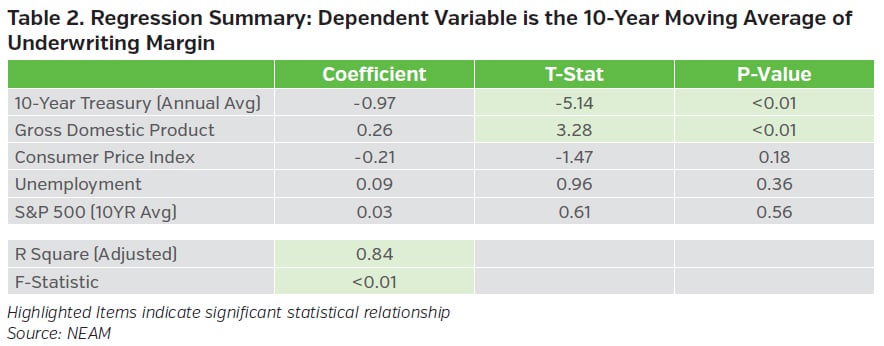
To further demonstrate this, we conducted a multivariate linear regression to assess how certain economic variables impact underwriting margin. The same 10-year moving average of pre-tax underwriting margin shown in the charts above was used at the dependent variable. The predictors included the 10-year Treasury bond rate, Gross Domestic Product (GDP), Consumer Price Index (CPI), unemployment (UEMP) and the 10-year moving average of returns on the S&P 500, using data7 from 2006 to 2020. Table 2 summarizes the statistics of regression results.8
The model findings indicate a significant statistical relationship exists between insurance risk and return and certain capital market characteristics over time, particularly with the 10-year U.S. Treasury and GDP. Other components of the model, such as unemployment, were not statistically significant as indicated by the higher p-values. But, the whole model is compelling given the 0.84 R-square and low F-statistic.
That said, several other economic indicators not included in this analysis could also play a role. However, at the very least a relationship between insurance underwriting performance and investment bond returns exists. In certain instances, this might present enterprise risk and return trade-offs. How enterprise risk capacity should be utilized across investments and insurance is unique to each insurer. NEAM suggests a holistic evaluation of these trade-offs to ensure total contributions of risk and return from insurance and investments, including risk and return dependencies, are aligned to enterprise risk preferences. This includes determining optimal investment choices of appropriate asset classes, credit quality, fixed income duration and other components of an insurance investment strategy. When coupled with operational targets, ideally this can support stakeholder expectations of ROE and capital preservation over time.
Key Takeaways
Risk capacity as measured by capital9 grew steadily for the insurance industry over the past 20 years. Returns on that capital have not kept pace. However, P&C firms were prudent in the utilization of that risk capacity over time, recognizing the symbiotic relationship of risk and return between insurance and investments. Apparently insurers retained more investment risk, in part via higher yielding, lower quality assets and common stocks. In contrast, their underwriting margins improved, and associated risk decreased.
Some key takeaways from this analysis:
- Over the past 20 years the U.S. P&C insurance industry has exhibited a steady increase in risk capacity as measured by available surplus capital and lower leverage.
- Data suggests that over the past 15 years insurers have utilized risk capacity differently. Compared to historic levels, insurers are retaining relatively less volatile insurance risk, and relatively more investment risk.
- We see evidence of linkages between insurance market performance and capital market interest rate levels. Decision-making across the enterprise over time has or should jointly assess the impact of insurance and investments as optimal risk capacity utilization is evaluated.
- Reducing insurance risk (via improved margins and lower volatility) may partially compensate for a willingness to assume more investment risk (via sector choices with higher allocations to equities and lower quality bonds).
Each insurer has a unique understanding of their risk capacity and how best to utilize it. Market cycles by their nature are dynamic. Similarly, the influence of enterprise risk and return from investments versus insurance may evolve over time as preferences and market opportunities across the balance sheet evolve. NEAM suggests utilizing a holistic approach to evaluating these risk and return opportunities for the enterprise. This includes assessing how investment strategy and asset allocation can effectively complement an insurer’s long-term operational objectives and support stakeholder expectations.
Endnotes
1 We define investment leverage as invested assets divided by surplus capital. Premium leverage is net premiums divided by surplus. For a deeper discussion of this, see NEAM’s Perspectives “Enterprise: The Intersection of Capital, Underwriting and Investment Management Opportunities,” December 2019.
2 VaR estimates are based on a simple standard-normal end of period VaR for discussion purposes. We encourage organizations to use a more dynamic and advanced method to measure their downside risk.
3 We encourage review of NEAM’s Perspectives “2020 P&C Industry Investment Highlights: The Fight for Yield Continues,” September 2021, for a deeper discussion of the U.S. P&C industry investment trends through year-end 2020. This addresses how other sector details and allocations, including Schedule BA, have changed over time.
4 We also looked at these trends separately for commercial lines and personal lines. Both segments show improving trends in volatility. However, the commercial lines segment exhibited pronounced improvement in its underwriting margin trend over the period, while personal lines showed only modest improvement.
5 We are estimating Pearson correlations based on historical annual time series data from 1996 to 2020. The insurance product correlations are based on 15 NAIC statutory insurance product line groups captured by Standard & Poor’s Capital IQ. The invested asset correlations are based on 15 indices from the I.C.E. BofA Global Index System representing asset classes often part of U.S. P&C investment portfolios, including common equities, corporate bonds, municipal bonds, structured securities and Treasuries. We are not claiming these correlation differences are statistically significant from zero, but are noting that there appears to be noteworthy directional changes.
6 We suggest review of Perspectives “Pairing the Unknown – Liability Correlations and Asset Allocation,” October 2017, for more insights on insurance liability correlation trends.
7 Sources for the regression data include: Standard & Poor’s Capital IQ, Haver, NEAM and Bureau of Labor Statistics
8 We conducted basic tests to confirm linear regression assumptions held. Our evaluations showed no significant concerns with heteroscedasticity, multicollinearity or non-linearity. However, it is worth noting that since we are using a moving average for underwriting margin, we are “smoothing” the dependent variable. Therefore, we caution against using this model framework to predict a specific value, but more to confirm a trend. When using the pure year-end calendar underwriting margin instead of the 10-year moving average, the adjusted R-Square of the model falls to 0.60. Other model statistics remain very compelling, including an F-statistic of 0.02, and a 10-year Treasury coefficient of 3.8 and p-value <0.01. However, a calendar-year underwriting margin may not reflect fully the eventual loss development associated with claims specific to underwriting decisions made in a particular year. There are limitations with either approach.
9 Capital injection via new entrants and alternative capital providers no doubt played a role in capital growth as well. Alternatively, one can argue that as ROE declines and capital grows, excess capital might exist that could be returned to shareholders and policyholders. NEAM may explore and discuss both ideas further in future publications.


