
Executive Summary
Property and casualty (P&C) insurers often focus on three areas of their invested assets: sector, credit and duration. The latter two focus on fixed income, but all areas are connected to a certain extent. Of course, other portfolio characteristics1 play a role as well. However, when we look closer at sector, particularly eligible asset classes, there is a common theme with most P&C companies. In recent years, about 75% to 80% of their holdings were with investment grade core fixed income, including a notable amount of cash and high quality, short duration assets.2 The remaining 20% to 25%3 were with risk assets, led by common stocks. Apparently, these insurers take a “barbell” approach to investing – higher risk positions like equities are offset with relatively lower risk positions like short duration, highly liquid bonds. The result may be an aggregate portfolio volatility risk that is acceptable, but not necessarily balanced across a risk spectrum. This binary view of very high versus very low risk assets may overlook a broader and richer range of complementary opportunities. Moreover, these opportunities are within the low-to-high risk ranges of the barbell, achieve similar portfolio and enterprise risk profile estimates, and increase overall return expectations. In this issue of Perspectives, we will explore the implications of this barbell sector risk-taking approach versus a more comprehensive one that includes a broader range of investment opportunities.
The Investment Sector Barbell
Insurers will factor several considerations when evaluating risk and return within their investment portfolios, but common focal points include sector risk, credit risk and interest rate risk. Sector allocation is usually viewed in a bifurcated way: (low risk) investment grade fixed income versus (high risk) equities. Often to achieve higher expected returns, greater allocation to equities holdings is warranted when all else is equal. As equity positions increase, to reach those higher returns, volatility and downside risk to the portfolio is controlled by making similar increases to very high quality, liquid, short duration assets. We call this an implied barbell risk-taking approach for sector allocation.4 This approach can be useful but may be limiting as well. Welcoming opportunities across a broader risk and return spectrum may achieve better outcomes.
We can maintain the bifurcated view of an investment grade fixed income bucket versus risk asset5 bucket. There are several reasons that this view is warranted, including risk tolerances and risk culture, ratings and solvency capital charges, liquidity needs and other factors. However, within each bucket there may be reason to broaden acceptable asset classes to include some or all of the following: high quality non-traditional structured securities, investment grade commercial mortgage loans, preferred stock, high yield bonds, hedge funds, private equity, real estate funds or other alternative assets. This can support a wider scope of opportunity, better diversification and higher risk-adjusted returns versus the barbell approach discussed above. For this discussion, we call this approach a “broadbell” strategy.
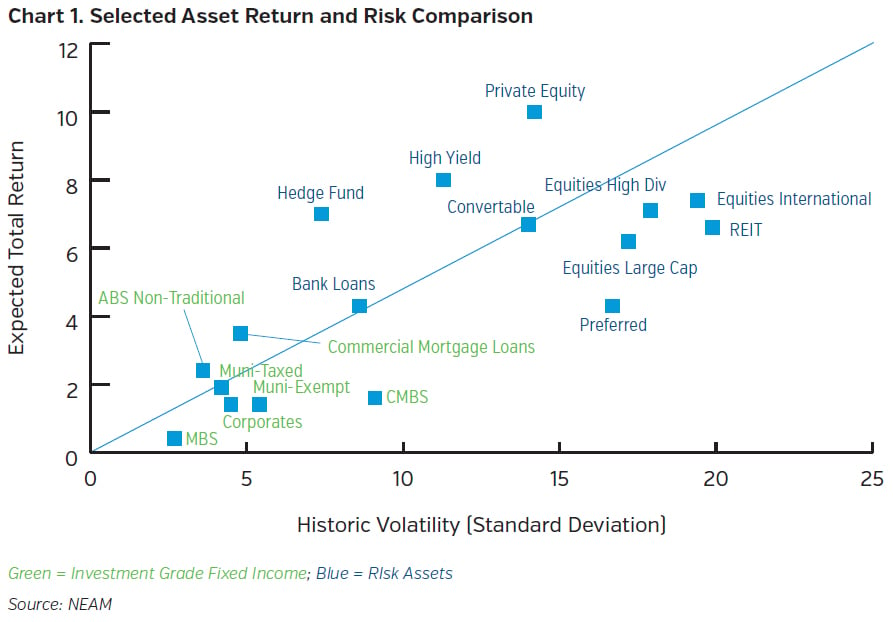
Chart 1 shows different expected return and historic volatility statistics assumed for a select group of asset types – investment grade colored in green and risk assets colored in blue. Aside from equities, the risk assets shown are atypical holdings within some U.S. P&C investment portfolios, some of which have better risk-adjusted return statistics. The volatility metrics are informed by historic return times’ series data of up to 20+ years for various indices that represent these assets. Total return assumptions are based on NEAM’s one-year forward projections as of January 2021.
Understanding Enterprise Risk Capacity
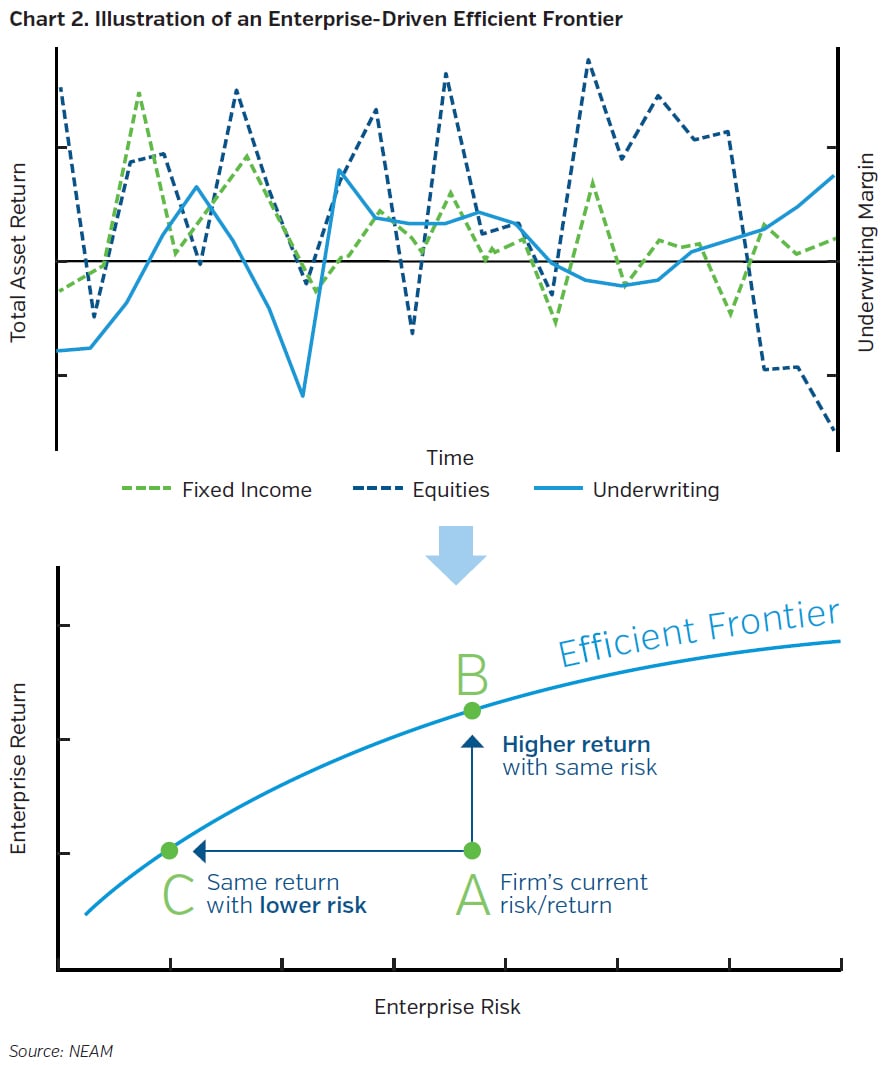
NEAM encourages insurers to evaluate investment choices within an enterprise risk capacity framework. Capital allocation and risk capacity utilization is perhaps most effective when investments and insurance are viewed jointly, and their risk and return dependencies are fully understood. One way to facilitate that understanding is within an Enterprise Based Asset Allocation™ (EBAA™)6 framework. This is illustrated in Chart 2, where characteristics of invested assets and insurance liabilities are considered jointly when evaluating for optimal investment strategies. And as different strategies are identified, their viability are also measured against an insurer’s risk preferences and objectives.
We will use EBAA™ to assess if portfolios that embrace a broadbell approach (broader range of asset types) provide a meaningful improvement in risk-adjusted return expectations versus a barbell approach (narrower range of asset types).
Broadbell versus Barbell Sector Allocation
Chart 3 provides some characteristics of a fictional, but not atypical, multiline property casualty insurer that we will use for a case analysis. The company has a capital surplus of $250 million. The company’s enterprise risk tolerance is measured by a Value-at-Risk target range of 25% of capital at a 99.5% confidence. They have $500 million of invested assets and an allocation target of a minimum of 75% in investment grade fixed income (including cash) and up to 25% in risk assets. For this example, we assume duration and average credit quality should stay at five years and AA, respectively. Given the above, we apply an investment optimization using an EBAA™ framework. Returns and volatilities across all assets are developed, as noted in Chart 1.7 Additionally, we assume a 99% combined ratio with volatility based on the standard deviation of 20-year annual combined ratios ending in 2019 for the U.S. P&C industry combined statutory lines.8 Investment leverage is at 2.0x and underwriting leverage is at 1.0x.9
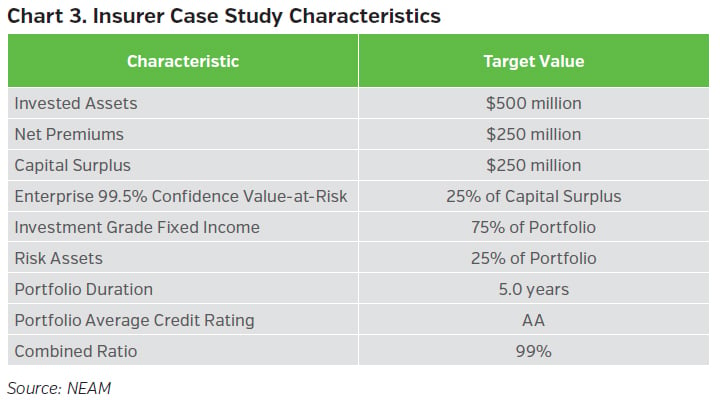
Chart 4 shows the results of two different optimization scenario outcomes. The objective in each scenario was to maximize yield-driven total return for given levels of earnings volatility. Reasonable constraints controlling for credit quality, duration and other factors were maintained for each scenario. The primary difference between the two was the eligible assets within the opportunity set. Scenario A reflects a barbell approach discussed earlier that includes a range of asset classes often seen within U.S. P&C firms. Scenario B reflects a broadbell approach, which includes a relatively broader range of investment grade fixed income assets and risk assets within the opportunity set (noted in italics). Both scenarios imply expected returns of 100+ basis points as more risk assets are allowed within the portfolio, while sustaining target existing enterprise risk levels. However, Scenario B suggests approximately 40 additional basis points in total return on equity (ROE) and with slightly lower Best Capital Adequacy Ratio (BCAR) and risk-based capital (RBC) charges relative to Scenario A. The additional ROE in this example is influenced by the allowance of a broader range of assets, where other investment grade fixed income assets,10 high yield and alternatives support higher risk-adjusted return expectations for the portfolio and enterprise. These results will vary by insurer, and the right combination of assets will always be dependent on the insurer’s enterprise risk and return preferences.
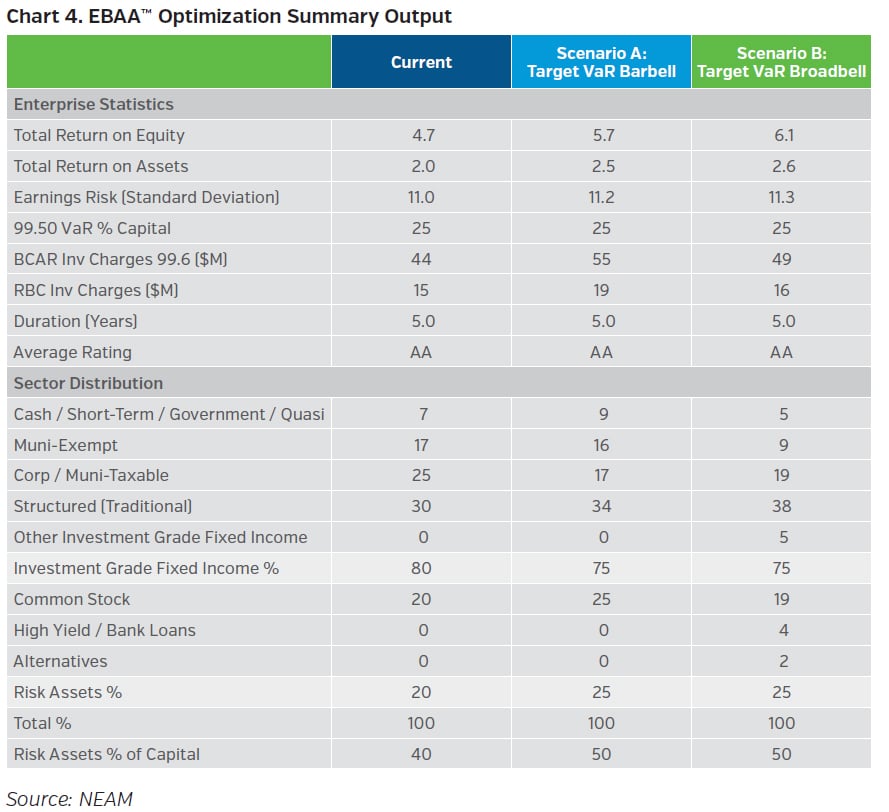
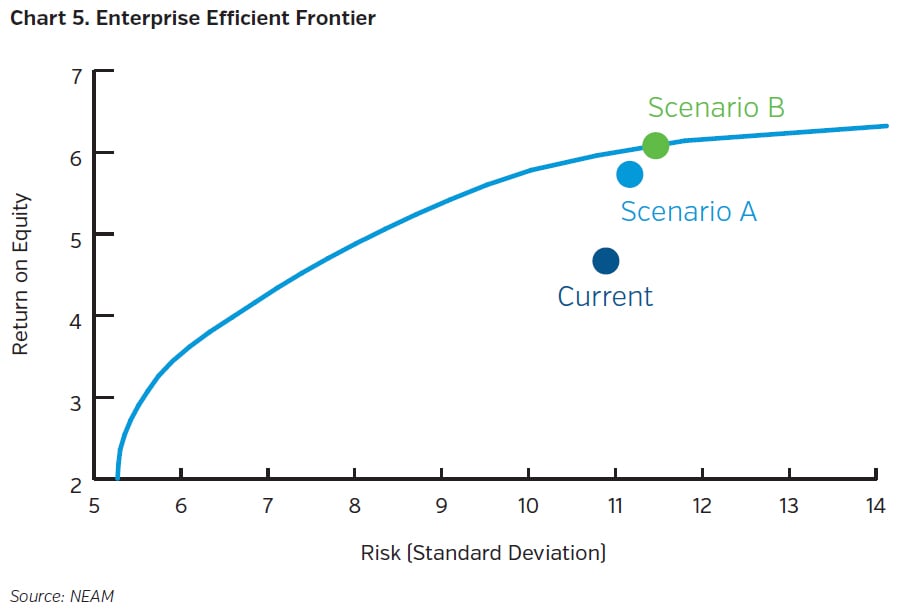
Chart 5 shows the results of these scenarios versus the current portfolio along an enterprise-based efficient frontier. The shape and position of the frontier is dependent on several factors, including eligible assets and liabilities and their expected risk and return characteristics, respectively. The Scenario A portfolio falls a little short of the efficient frontier. While the additional 40 basis points in ROE of scenario B, at a similar enterprise risk level, falls on the frontier. Ultimately, the shape of the efficient frontier and the ideal portfolio choice relative to the frontier is dependent on risk and return preferences, expectations, and portfolio constraints. For some insurers certain incremental differences in expected portfolio outcomes are less important; for others those differences are significant. Either way being aware of opportunities and the implications are universally important to the decision-making process.
KEY TAKEAWAYS
- Property and casualty insurers often assess the risk and return characteristics of their investment portfolios across three key areas: sector, credit quality and interest rate sensitivity.
- Sector risk is often viewed in a bifurcated fashion – investment grade fixed income versus risk assets, namely equities. This bifurcation is often appropriate, but within that bifurcation insurers may depend on an implied barbell risk-taking approach for sector allocation. Higher risk assets are offset with short duration, high quality fixed income.
- An Enterprise Based Asset Allocation™ (EBAA™) framework can help facilitate an understanding of risk versus reward tradeoffs across the enterprise as different investment choices are considered.
- NEAM suggests that in some instances a broadbell approach may be more effective for P&C insurers. Risk tolerances and volatility targets can be preserved, but improvements with risk-adjusted returns can be achieved as a broader range of asset classes are allowed within a strategic asset allocation.
- Target asset allocations are dependent on an insurer’s operational characteristics and risk and return preferences. Some assets may be underutilized with one insurer, but are key allocations with another.
NEAM suggests employing a holistic approach, such as an Enterprise Based Asset Allocation™ framework, to help identify fresh investment ideas that support an insurer’s long-term operational objectives and stakeholder expectations.
NEAM’s portfolio management tools were utilized in the illustrative examples herein to provide an estimated range of returns, volatilities and other metrics based on certain assumptions. NEAM makes no representation or warranty as to the reasonableness of these assumptions. The examples do not represent actual trades and may not reflect the effect of material economic and market factors. The examples should not be regarded as a recommendation of any specific security. Insurers will experience different results from any projected information shown. There is a potential for loss that is not reflected in the projected information portrayed. Results shown are not a guarantee of performance returns.
Endnotes
1 For example, NEAM also considers current market conditions, relative value across all assets, tax implications and the role of tax-exempt securities, investment income, embedded gains or losses, positioning relative to the benchmark and several other factors.
2 See NEAM Perspectives (October 2020) for further discussion and evidence of industry data suggesting sector barbell risk-taking.
3 These percentages are through year-end 2019, include schedule BA assets, and exclude the impact of Berkshire-Hathaway. See also NEAM Perspectives (October 2020)
4 See NEAM Perspectives (October 2020) for further discussion and evidence of industry data suggesting sector barbell risk-taking.
5 We define risk assets to include equities, below investment grade fixed income and alternatives.
6 A broader discussion of NEAM’s Enterprise Based Asset Allocation™ (EBAA™) process is within NEAM’s September 2016 Issue of Perspectives entitled “Considering Opportunities in Low Return, Uncertain Environment – An Enterprise View.”
7 Assumptions play a critical role in any asset allocation process. To help understand the impact of different ways to estimate returns and volatilities, and the resulting sensitivity to portfolio optimization outcomes, we refer you to NEAM Perspectives (July 2020)
8 Source: S&P Global Market Intelligence and NEAM.
9 Investment leverage equals invested assets divided by surplus capital. Underwriting leverage equals net premiums divided by surplus capital.
10 Other investment grade fixed income may include high quality non-traditional structured securities, BBB-level commercial mortgages.


