The topic of correlation is widely discussed when capital markets roil, as we have experienced recently and during the financial crisis of the last decade. Rating agency models assume correlations between interest rate, credit and equity market risk factors. Regulators reference correlations in their ORSA (Own Risk Solvency Assessment) and solvency bulletins. Insurers’ internal capital models also rely on correlation estimates to determine expected outcomes and copulas for “tail” events.1 Correlation is also embedded within nearly all asset allocation and optimization methods.
Within the context of enterprise risk management (ERM), correlation is an important concept used to gauge the benefits of diversification or, in instances of extreme events, the risk of contagion. In turn, correlation assumptions can have real world impact on estimates for solvency margins, capital requirements and ratings. Given the significance of correlation estimates, we think it is beneficial to examine their behavior more closely.
We show multiple measures of correlation. For each measure, our correlation estimates rely upon daily, monthly and annual return data. We calculate correlations over multiple time periods to assess the stationarity of the estimates. The reason for multiple measures, periodicities and time intervals is to demonstrate the range in estimates to facilitate a better understanding of correlation metrics and the nuances associated with them.
We find that: 1) Alternative measures of correlation show similar directional change but large differences in magnitude; 2) Correlations are very sensitive to the period of time over which they are calculated often resulting in conflicting estimates; and 3) Correlations are volatile and unstable. As a result, correlations must be stress tested rather than blindly relied upon in asset allocation and portfolio construction processes and capital management and solvency assessment regimes.2 Buying and/or selling diversification benefits or correlation risk or specifying correlation-dependent capital requirements is potentially a fool’s errand. In this General ReView, we present the first of a three-part series regarding correlation estimates, their nuances and unintended consequences.
Correlation and Diversification
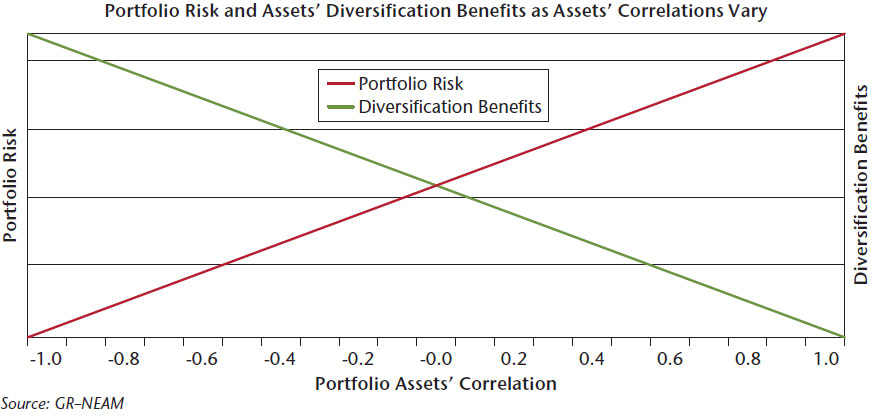
Chart 1 below is a schematic representing the relationship between portfolio risk and diversification benefits, as the correlation among assets varies from minus one (exactly inverse return behavior and maximum diversification benefit) to plus one (identical return behavior with no diversification benefit). Diversification benefits occur only as the correlations migrate from zero to minus one.
Chart I. The correlation and diversification relationship
In our examination of correlation, we must distinguish between measureable casual (and fleeting) relationships and potentially causal behaviors. In the former, a third factor might be the driver of the two variables behavior; whereas, in the latter, there might well be a cause and effect between the two variables resulting in the observable behavior. This distinction is particularly relevant as we note the volatility of correlations over time.
The Data
For our analysis, we rely on daily asset returns for U.S. capital markets from year-end 1997 to year-end 2015. Fixed income asset returns are from the BofA ML Global Index System, while equity asset returns are taken from Bloomberg. We used 25 indices equally weighted to form a portfolio. Table 1 below summarizes the indices asset allocation, fixed income sectors, credit quality distribution and duration.
Table I. Portfolio allocation and various risk statistics profile
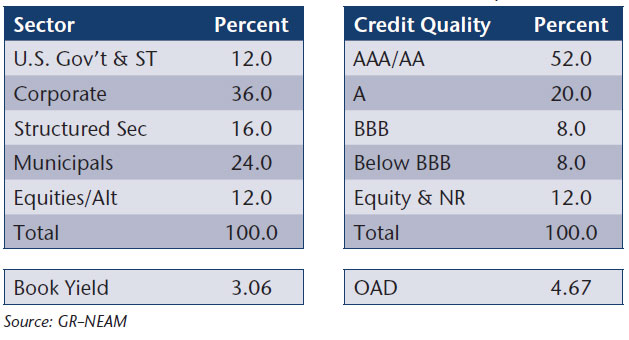
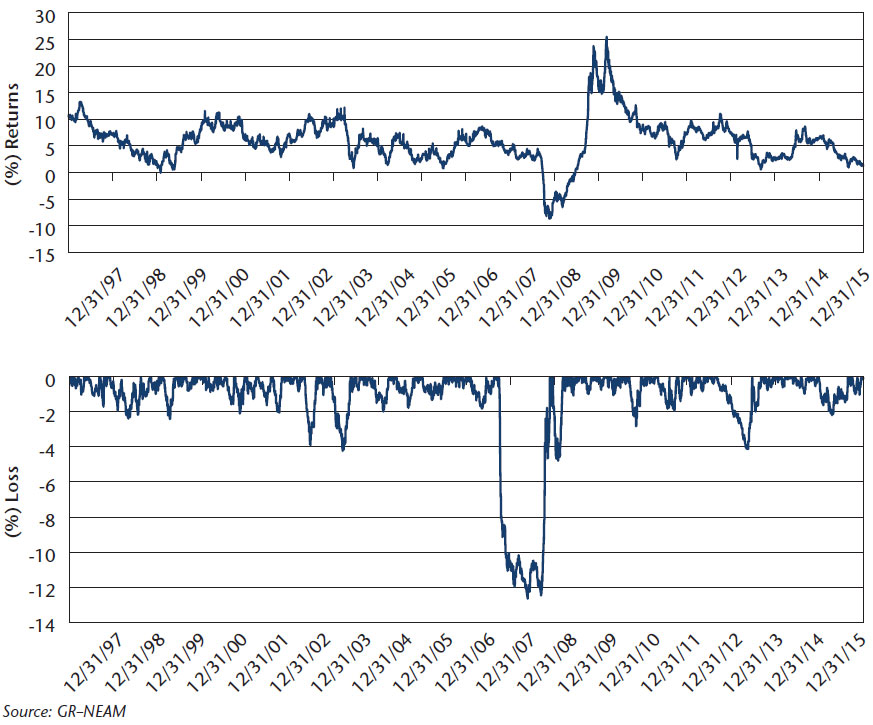
Chart 2 displays the annual rolling daily total return and drawdown for the portfolio. The lowest rolling annual return calculated from daily total returns was -8.69%. It occurred November 21, 2008. The maximum drawdown within any annual daily rolling period was -12.61%. It occurred from May 20, 2008 through November 20, 2008.
Chart II. Annual rolling daily total return and maximum draw down
As shown above, there was considerable volatility in the portfolio’s total returns. We estimate volatility with the standard deviation of total return and the magnitude of diversification benefits with the correlation of total returns among the portfolio constituents. In Chart 3 below, we display the portfolio’s five-year rolling standard deviation (Green) and correlation (Gold) of daily total returns.3 The annual rolling total return is scaled to the left-hand axis and shown by the grey line.
Chart III. Five-year rolling standard deviation (Green) and correlation (Gold) of portfolio daily total returns
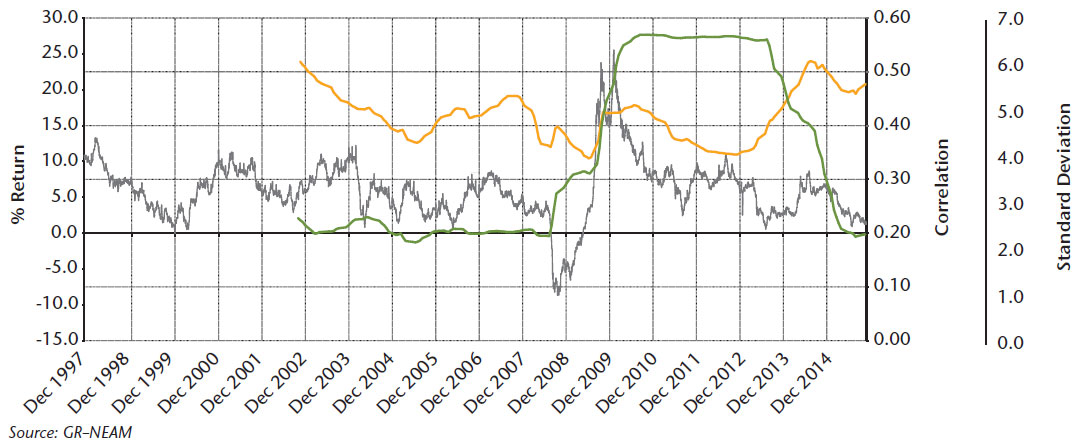
The volatility begins to spike in late 2008 as the financial crisis accelerates. It starts to rapidly decline in mid-2013 to pre-crisis levels as the 2008 shocks fade in the rear view mirror. Correlation may be surprising and is largely unaffected in this period of heightened volatility. We will explore the correlation further in the next section. Suffice it to say, asset behavior was not what many commentators represented, “…asset returns became perfectly correlated.” Indeed, quite the opposite occurred, thankfully, at least for diversified portfolios.4
Alternative Correlation Metrics
There are several measures of correlation to consider. The most direct is the percent of assets whose total return changes follow the same direction from period to period.5 A second measure is statistical correlation of asset returns, capturing not only directional change but the magnitude of change. Chart 4 displays the directional and statistical correlation of the portfolio.
Chart IV. Five-year rolling directional (Green) and statistical (Gold) correlation of portfolio daily total returns
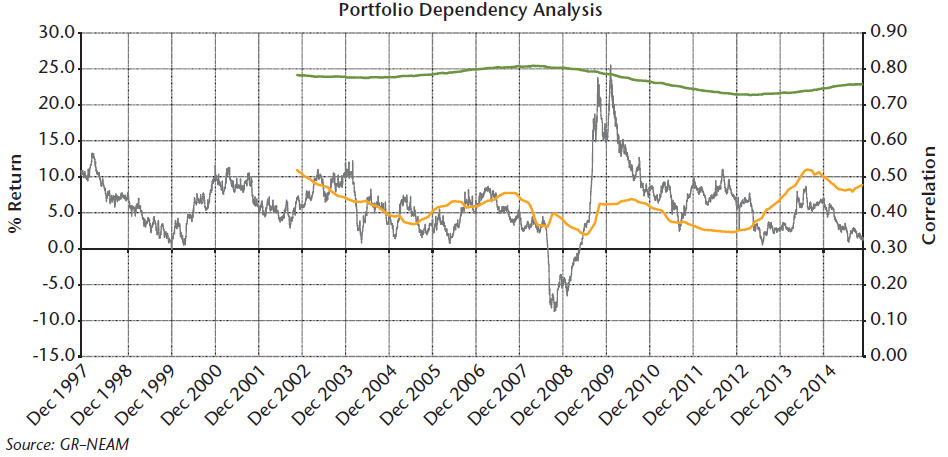
The “directional correlation” hovers in the mid-70% to 80% range. Note that this correlation measure is bounded between 0.5 and 1.0, because no fewer than half of the assets can move in the same direction from period to period. Using this metric of correlation suggests very modest portfolio diversification benefits due to the portfolios’ allocation.
The “statistical correlation” hovers in the range of 0.35 and 0.5 possibly suggesting a more favorable tilt towards diversification benefits from what is indicated by the directional correlation metric. The difference is due to the magnitude of the changes. The significance of these differences depends upon one’s point of view. In the next section, we explore whether they are fleeting and illusory.
An Unstable World
We assess the stability of the correlation estimates by measuring them over differing intervals and periods of time. Chart 5 displays the inception, five-year and one-year rolling “statistical correlation” of daily total returns. The inception correlation appears to “stabilize” beginning in 2004 in the range of 0.42 to 0.46.These values represent the long-term correlation effects of the portfolio. The inference could be made that the diversification benefits are just “so-so” to nil.
Chart V. Inception (Blue), five-year (Gold) and one-year (Red) rolling correlation of portfolio daily total returns
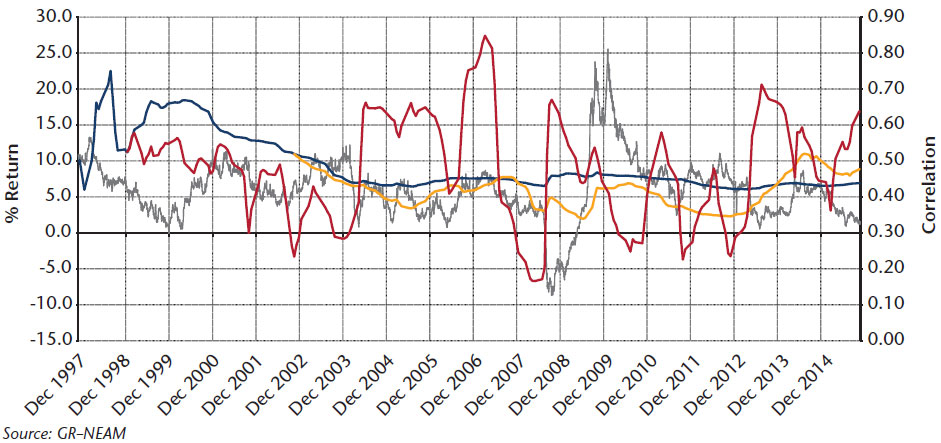
In a marked-to-market environment, long-term considerations have merit only if we survive the short term. The five-year estimated correlations fluctuate in a broader range than the inception estimates. However, the one-year rolling estimates are very volatile, operating in a peak-to-trough range of about 0.15 to 0.85. The former suggests short periods of modest diversification benefits, while the latter nearly eliminates them all.6
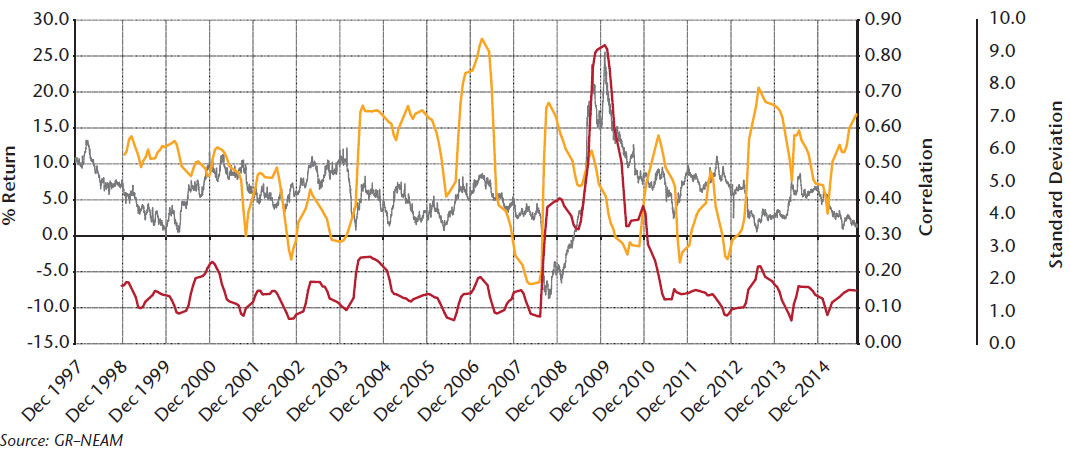
In Chart 6 we combine estimates of portfolio risk and correlation to focus on the period of the financial crisis. Prior to mid-2008 the one-year rolling standard deviation of daily total returns hovered in a range of ~1.0 to 2.7. Beginning in mid-2008 it began to increase sharply, peaking in early 2010 before reverting to pre-crisis levels in mid-2011. Most interestingly, during the highest period of volatility, the corresponding one-year rolling correlation was actually declining. Note that the rapid rise in volatility was also occasioned by increased total return. Whereas volatility of all asset classes increased their returns were often merely offsetting one another.
Chart VI. One-year rolling standard deviation (Red) and correlation (Gold) of portfolio daily total returns
Key Takeaways and Next Steps
Correlation concepts are pervasive within internal capital management processes and regulatory and rating agency assessments of required capital and solvency margins. Additionally, the marked-to-market operating and regulatory environment confounds the ability to estimate “how things relate,” prospectively or otherwise. Long-term relationships, if they ever existed, have become as irrelevant as they are unstable. Their reliability lessens as the time frame of assessment has been shortened. These conditions have real world implications.
There are several key take-aways from this:
- Correlation is an estimate of “the inter-relatedness of things” and serves as the foundation of the most basic (enterprise) portfolio management principle, namely diversification.
- Measured correlations do not distinguish casual from causal relationships (this is a practitioner’s task).
- Estimates of correlation are very sensitive to the period of time when they are measured, the span of time over which they are calculated and the observation frequency of the data.
- Correlations appear to be very unstable over time, as the calculation period is shortened to reflect the business and regulatory environment.
- Correlation assumptions embedded within some regulatory regimes are yet to be observed within their stated timeframes, thereby necessitating excessive capital requirements.
- Rigorous stress testing is required for correlation estimates before they are adopted.
This issue of General ReView is the first of a three-part series on the topic of correlation. Our next issue will show the impact of correlation assumptions on asset allocation and stress testing. The third issue will include the impact of underwriting assumptions and enterprise value-at-risk metrics for purposes of capital management and regulatory and rating agency reporting.
Endnotes
1 Accordingly, in this General ReView, correlation refers to any dependency structure, not merely those which are linear.
2 Our focus is on asset correlation, although we recognize its existence among certain insurance products’/policyholders’ behavior whether due to contagion, attritional loss pricing, primary/excess loss events or product optionality pricing.
3 The correlation line represents the sum of all correlation matrix entries, at a point in time, of the portfolio constituents’ total return series multiplied by their respective, constant, weights. We refer to the measure as statistical correlation.
4 Refer to General ReView, “Benchmarking Capital Charges: A Top Down Observable Price Approach,” Issue #64, September 2014. Please visit www.grneam.com to access GR–NEAM publications.
5 The correlation line in this graph represents the five year rolling average of the ratio of the portfolio constituents’ daily returns moving into the same direction day over day. We refer to the measure as directional correlation.
6 Although not shown, it is also true that the observation frequency of the data (daily, weekly, monthly or annual) has an equally significant impact on correlation estimates as the time interval and period of time for which the estimate is made.


