Regulators have legislative responsibility to establish solvency standards for insurers. Rating agencies have a commercial interest in providing a framework to gauge insurers’ capital adequacy. For each the focus is to assign capital charges to the various activities of insurers, tally their accumulation and conclude either the need for regulatory intervention or assigning a financial rating, respectively.
Two developments give us pause to review capital charges of different regulatory and rating agency regimes. The first is the creation of the U.S. Federal Insurance Office. The second is EIOPA’s most recent publication addressing underlying assumptions of the Solvency II Standard Model Formula (“SII”).1
The focus of this General Review is the investment capital charges developed within the SII and, in particular, contrasted to the charges developed using GR–NEAM’s “top-down” observable price methodology.2 We highlight these differences using the security level holdings of the U.S. property/casualty (“P/C”) industry.
The differences in the estimates are large and they are not mere abstractions. They will impact investment risk assessments, asset allocations and capital management as they are woven into internal decision making processes and external reporting. GR–NEAM’s top-down observable price methodology improves transparency in risk measurement, serving as an unbiased benchmark against which insurers can evaluate their own internal capital models and U.S. regulators might assess alternative solvency metrics and methods.
Industry Holdings Profile
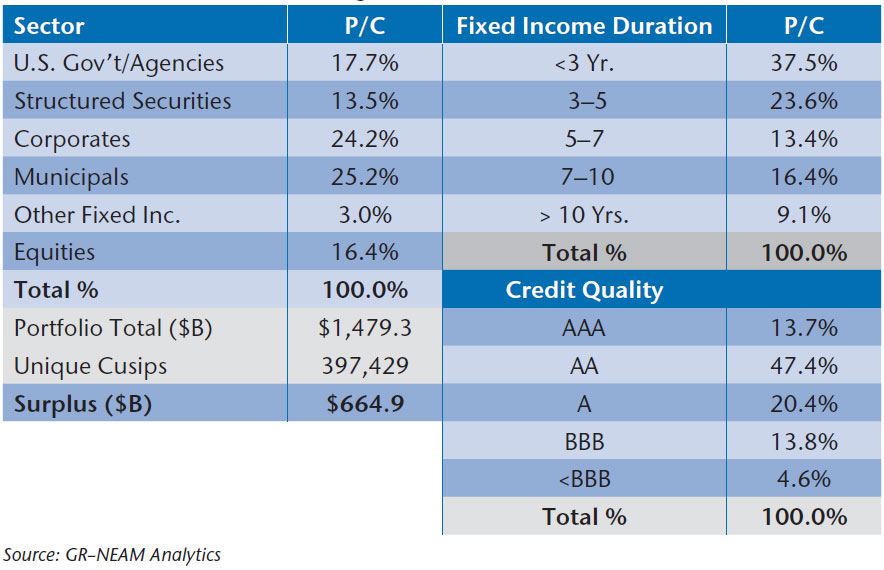
The starting point for investment capital charges is the cusip-level holdings of invested assets. For purposes of demonstration we use the 2011–2013 Schedule D cusip level holdings of the U.S. property/casualty insurance industry segment. Table 1 below is a high-level summary of the 2013 detailed holdings.

International fixed income securities are included in “Other Fixed Inc.” Taxable municipal bonds are included in “Corporates.” Privates are classified in their respective sectors if possible or into “Corporates” otherwise. Mutual funds are included in “Equities.” Credit quality and duration are obtained as of year-end from public sources such as Bloomberg and NRSOs. Investment leverage (invested assets to surplus) equals 2.2:1. The high cusip count is due to municipal bonds. In the following analysis, capital charges are assigned at the cusip level.
Solvency II Capital Charges
Solvency II follows a “bottom-up” approach wherein investment capital charges are calculated in a two-step process. First, separate capital charges are calculated for specific risk factors—interest rate, spread, equity, currency, concentration and property risk—and calibrated to an estimated value-at-risk (“VaR”) at a 99.5 confidence interval. Second, an assumed level of correlation among the risk factor totals is applied resulting in an aggregate capital charge expressed as a percent of the investment portfolio.
Table 2 below shows the SII respective correlations among the risk factors using the “down” rate matrix.3 Highlighted in bold red font are the correlations which have the greatest impact upon the aggregate SII investment capital charge, due either to the magnitude of the factor charge or degree of correlation.
Table 2. Solvency II Correlation

Table 3 summarizes the SII calculated risk factor totals, aggregate investment capital charges (as a percent of invested assets and surplus) and the weighted correlations among the risk factors. The small year-to-year variation among market risk factors’ capital charges is due primarily to the increased allocation to equities.
Table 3. Solvency II 99.5 Estimated Investment Charges by Risk Factor and in Aggregate as Percent Portfolio and Surplus

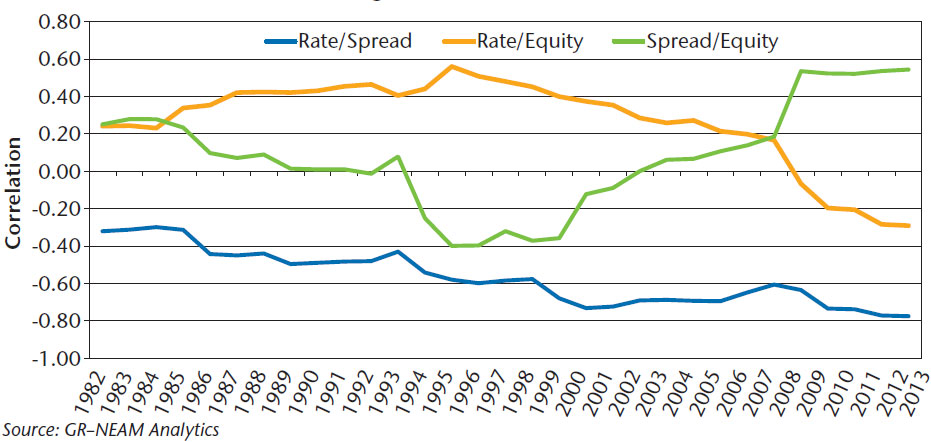
Due to the importance of correlations within the Solvency II framework, we highlight the (20-year rolling) correlation among the principal risk factors—interest rate, spread and equity—spanning the period 1962–2013.4 These are shown in Chart 1 below.
Chart 1. Observable 20-Year Rolling Factor Correlation 1962–2013

The historical correlations are not stable and over time differ dramatically from those assumed by the SII. Of particular note are the observed negative correlations of interest rate to spread and the volatility of the spread to equity correlations. Selecting correlations requires consideration to the time period for which they are to occur and whether they are intended to capture only “normal” markets’ activity or reflect “extreme” markets’ events.5
GR-NEAM’s “Top-Down” Approach With Observable Prices
In contrast to SII, GR–NEAM’s top-down approach starts at the portfolio level to calculate total return and volatility statistics based upon observable prices and income, and from these calculated values we estimate the portfolio’s VaR. The process used to develop investment risk estimates has three steps.
First, we “map” individual fixed income holdings to BofA ML fixed income indices and equity securities to publically available equity indices. The database contains daily price returns of the BofA ML fixed income index constituents and various equity indices since 1997. For equity securities there is the option of using cusip tickers rather than index proxies.6
Second, we construct a time series of historical returns based upon the asset allocation of actual holdings to the indices. This time series reflects the combined impact of individual market risk factors and their correlations. Accordingly, correlations need not be “assumed” and the observable correlations can be stressed.
And third, from the return series we estimate historical total return and downside risk statistics that include both “normal” market and “extreme” market value-at-risk estimates.7 The VaR estimates at the 99.5 confidence interval represent the comparable SII investment portfolio capital charge.
GR-NEAM’s Approach to Portfolio VaR and Risk Decomposition
To decompose the portfolio capital charge into risk factors, we construct fixed income excess returns to isolate interest rate, spread and structure risk, and we adjust returns to capture any foreign exchange effects using the BoA ML Global Index constituent file. Equity risk is calculated from either the returns of individual security holdings or the equity indices to which they were mapped. Currency risk reflects the volatility of foreign exchange translation from originating to base reporting currency.
Structure risk is explicitly identified as a separable risk within our approach to capture the marked-to-market volatility of mortgage backed securities’ optionality. This risk factor is isolated to highlight the excessive charges applied to mortgages within the SII framework. We believe this approach is a more transparent way to display structure risk rather than embedding it within credit risk.
Default risk embedded within our spread risk estimates is due to index construction rules, which capture the deleterious price impact of downgrades and/or defaults in the period’s total return calculation. Accordingly, “spread risk” (volatility) includes price volatility associated with the markets’ perception of credit risk in addition to actual loss in value due to downgrades (temporal) and/or defaults (permanent).
Concentration risk is not captured within the observable price methodology for fixed income securities wherein individual securities are assigned the risk characteristics of their “mapped” indices. Investment policy statements often limit issuer concentration (across fixed income and equity holdings) to a certain percent of capital based upon various criteria. Equity holdings’ concentration (volatility) is embedded in the portfolio total return volatility when individual holdings’ returns are used in the calculations rather than indices.
Correlation risk is defined in the observable price methodology as the difference between observed and assumed correlations. This enables a refined degree of stress testing by contrasting observable correlations to alternative correlations, such as those assumed by the various capital regimes’ models or insurers’ internal capital models.
Chart 2 below displays the risk decomposition for the P/C industry segments’ 2013 holdings, based upon GR–NEAM’s top-down observable price methodology. The left-hand panel displays the results based upon observable correlations. The right-hand panel displays the results assuming the SII risk factor correlations. The 99.5% VaR (tan) is estimated to be $132 billion, the sum of the individual risk factors (blue) less the implicit diversification benefits among them (green). The individual risk factor charges shown below will be different from the SII factors shown in subsequent tables.
Chart II

Changing the correlation assumption to SII levels shown in Table 2 more than doubles the estimate of VaR to $282 billion (19.9% of portfolio value), reflecting the $150 billion reduction in diversification benefits (gold) inherent in the observable price methodology. The SII correlations have the effect of an extreme markets stress test that eliminates 75% ($150 billion of ~ $200 billion) of historic diversification benefits.
Contrasting Solvency II and Observable Price-Based Investment Capital Charges
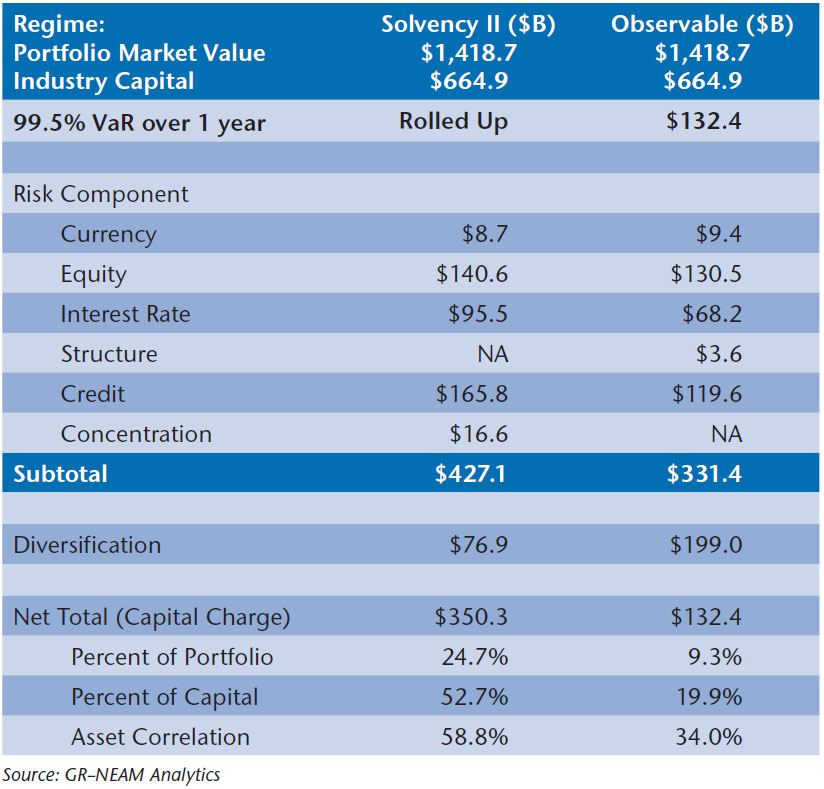
Table 4 contrasts the different components of the investment capital charges of the SII framework to GR–NEAM’s top-down observable price methodology. The greatest disparities among factors pertain to interest rate and credit (spread) risk. The former is caused by a 75 basis point shock assumed in the SII framework. The latter difference is caused by the very high capital charges assessed on structured securities and embedded in the SII credit risk factor.
In aggregate the greatest single difference in the estimates is diversification which is due to the application of unobserved correlations within the SII framework. The assumed SII correlation between rate and credit factors varies significantly from capital market observed price behavior.8 The bottom-up SII charge is over 2.6 times as great as that based upon GR–NEAM’s top-down approach ($350B versus $132B).
Table IV

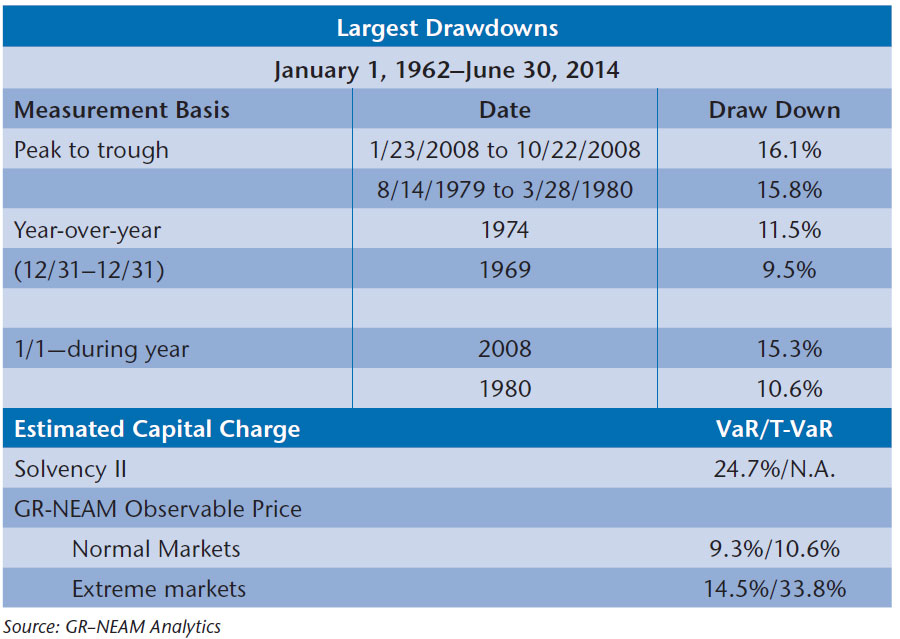
Table 5 displays the two largest drawdowns actually having occurred during the period of 1962 through June 30, 2014 and the estimated capital charges derived from the two methods. The maximum drawdowns are measured three different ways: the maximum cumulative loss peak-to-trough within any rolling 262 day/12-month trading period; the maximum year-over-year loss; and the maximum cumulative loss occurring during the year commencing from the beginning of the year.
Table V

The data highlights that 2008 was very severe, albeit the 1980 period was a close second. The data also highlights the singular importance of the measurement time frame. On the basis of “peak-to-trough” and “1/1-during year” measurements, 2008 was very severe. However, on a maximum year-over-year loss basis 2008, at 9.2% (not shown), was far less troublesome. In fact, end-of-year estimates appear tame in contrast to peak-to-trough and inter-year periods.
Based upon P&C industry investment holdings, SII appears to significantly overstate any level of observable capital market total return losses over the last 50 years. In contrast, GR–NEAM’s top down observable price methodology “normal markets” estimates understate the maximum drawdowns actually having occurred.
GR–NEAM’s “extreme market” VaR metric more completely captures the actual maximum drawdowns, and the associated T-VaR suggests that if the VaR threshold were exceeded, the resulting expected loss could be quite severe, a total return loss of nearly 34%. Unfortunately, SII does not prescribe a T-VaR estimate, causing true tail-risk comparisons of the two methods to be a difficult task. We do believe that proper “stress” testing should rely upon “extreme” market methods and that the preferred metric is T-Var, the estimate of expected adversity when “the wall is breached.”
Summary
In the realm of estimating capital charges there is no one “right way.” At GR–NEAM we embrace a method with as few as possible assumptions and as great as possible transparency, which most comprehensively addresses the risks that matter most and can be managed. We are also firm believers in the application of multiple approaches to risk measurement and stress testing. These are themes that support the NAIC’s Own Risk Solvency Assessment (ORSA) principles.
Adopters of economic capital modeling (ECM) frameworks, exhibiting better
practice approaches, also understand the importance of stressing and vetting
their internal models. GR–NEAM’s top-down observable price methodology can
serve as an unbiased benchmark against which market risk parameters within ECMs can be fine-tuned.
Clearly, there is the need to account for differing (subtle) objectives among the regimes. Equally true, there is the need to determine whether the differences among industry participants’ capital charges would result in a differing in rank ordering and asset allocations. Indeed, that will be a focus of future General ReViews.
As always, comments and suggestions are welcome.
Endnotes
1 “The Underlying Assumptions in the Standard Formula for the Solvency Capital Requirement Calculation,” EIOPA-14-322: European Insurance and Occupational Pensions Authority;
July 31, 2014.
2 In a subsequent General ReView we will contrast rating agency capital charges (A.M. Best and Standard & Poor’s) and both the SII and NAIC regulatory regimes to an observable price methodology. The General ReView will focus upon the impact of varying methodologies to individual company/groups.
3 SII requires selection of the interest rate charge having the greatest impact derived from
“up” and “down” rate movement evaluation. We use the “down” rate scenario (SII Technical Specification SCR.5.5.) because in the instances we have tested it produces the most conservative factor charge. Also, the focus is Schedule D assets, which exclude property investments, as do we in this analysis.
4 Rate risk when contrasted to equity risk is defined as the total return volatility of the 10-year constant maturity U.S. Treasury bond. Rate risk when contrasted to spread risk is defined as the total return volatility of the 20-year constant maturity U.S. Treasury bond. Spread risk is defined as the annual excess return volatility of the Moody’s Triple-B corporate bond series. Equity total returns are proxied by the S&P 500 index. Correlation estimates vary depending upon length of measurement period (20 years as shown above) and periodicity of returns (annual as shown above).
5 “Time periods” refer to daily, monthly, annual etc., time intervals for the correlations occur. Additionally, consideration must be given to the number of observations taken to estimate the “time periods” correlations.
6 The market value of the global fixed income database exceeded $46Tr at year-end 2013. The constituent level of the indices allows for the creation of customized indices to which individual companies’ unique holdings can be “mapped.” Additionally, credit volatility can be decomposed into default/downgrade and spread volatility factors to capture their separable impact. Mutual funds are classified equities. “Look-thorough” evaluation is possible provided constituents’ detail is available.
7 “Normal” market VaR estimates are based upon 2-parameter Normal statistical probability distributions. “Extreme” market estimates are based upon 4-parameter asymmetric closed formed Alpha-Stable Levy probability distributions discussed in General ReView, “The (Ir)relevance of VaR: An Oxymoron,” April 2010.
8 Corporate and U.S. Treasury bond total returns are indeed highly correlated. However, once the interest rate component of the corporate return is isolated, the residual “credit” to interest rate correlation becomes as shown in Chart 1. Essentially, using excess return volatility for credit risk eliminates the “double counting” of interest rate risk in Corporate to Treasury return correlations. Similarly, correlating Treasury yields to corporate yields in order to estimate interest rate and credit risk dependencies is incorrect. The right approach is to correlate Treasury yields to corporate spreads. For fixed income securities, excess returns are to total return what spreads are to rates.


