
EXECUTIVE SUMMARY
In this article, we delve into the enterprise profile of U.S. Medical Professional Liability (MPL) insurers and assess their investment performance relative to the broader U.S. property and casualty (P&C) industry. P&C insurers often shape their risk and return profiles around three key pillars: sector allocation, credit quality, and duration. However, our analysis shows that while MPL insurers and the broader industry share similarities in credit quality and duration, there are indications that the overall P&C industry outperforms MPL insurers in both overall net investment income and fixed income book yield. This pattern has persisted over the past decade, signaling a more conservative asset allocation approach adopted by MPL insurers. Within MPL writers, those taking on greater investment risk were generally able to achieve higher book yields, with larger companies more actively taking such risk.
SCOPE OF ANALYSIS
We use an MPL composite of 50 firms1 that primarily or exclusively underwrite MPL insurance. Commercial multiline insurers that also offer MPL products are not included in the composite. The MPL composite is compared to a U.S. P&C industry composite of 443 companies that underwrite all P&C lines of business, excluding the ones in the MPL composite. All exhibits use statutory filing data as of December 31, 2022 from S&P Capital IQ Pro, supplemented by data from sources such as NEAM Analytics, Bloomberg, and ICE BofA.
MPL COMPOSITE’S ENTERPRISE PROFILE
Similar Investment Leverage and Lower Premium Leverage
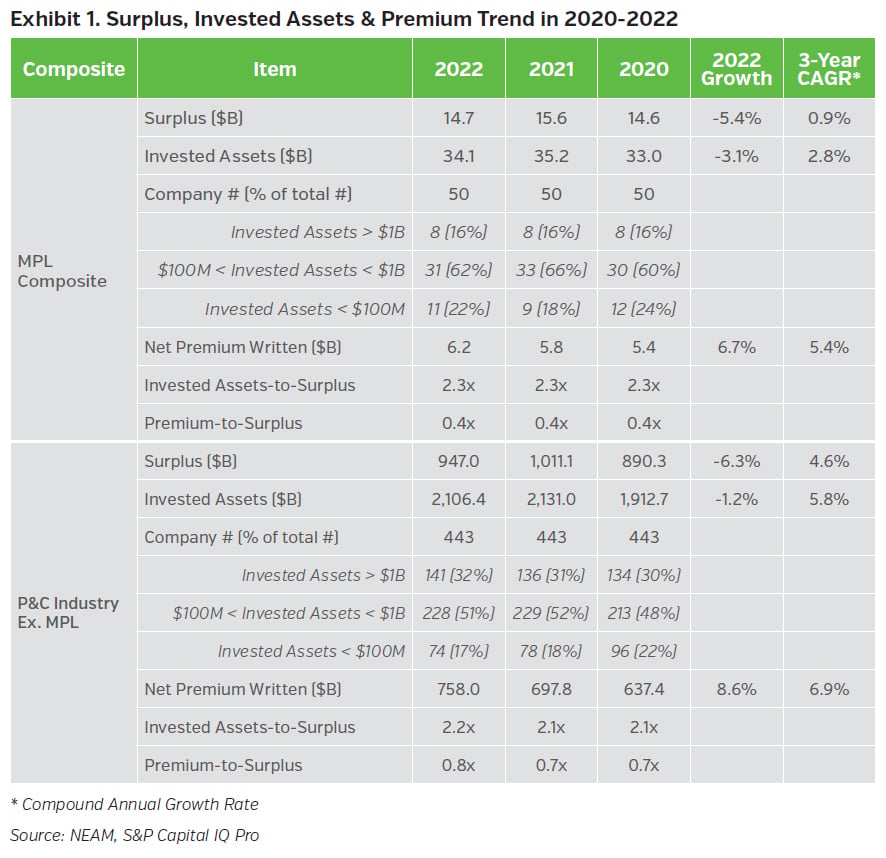
Exhibit 1 compares the statutory surplus, total invested assets, and net premium written between the MPL composite and the P&C industry in the past three years. The MPL composite has a slightly higher investment leverage (invested assets-to-surplus ratio) than the P&C industry, with a ratio of 2.3x versus 2.2x as of year-end 2022. However, MPL writers are generally smaller sized relative to the broader P&C industry, based on invested assets. They also have a much lower premium leverage than the P&C industry, measured by the ratio of premium to surplus. Both groups saw a decline in statutory surplus in 2022, with the MPL composite showing lower growth rates in surplus, invested assets, and net premium than the P&C industry in the last three years.
A LOOK AT THE MPL COMPOSITE’S ASSET CHARACTERISTICS
Net Investment Income2 Trails the P&C Industry
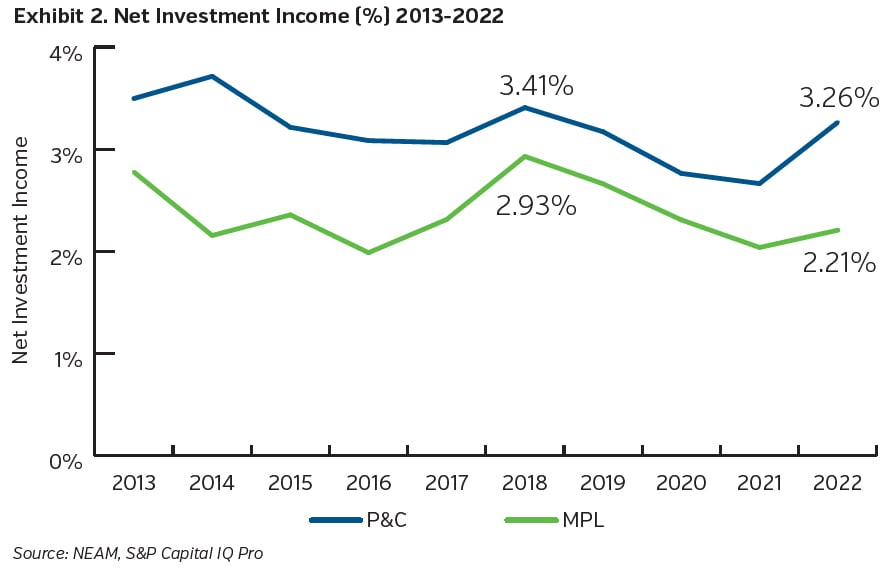
Exhibit 2 displays the net investment income (%) of the MPL composite and P&C industry. For the past decade, the MPL composite has been materially below the P&C industry in net investment income. The gap between the two groups has widened recently, from 48 bps in 2018 to 105 bps in 2022.
More Allocations to Fixed Income and Less to Equities & Alternatives
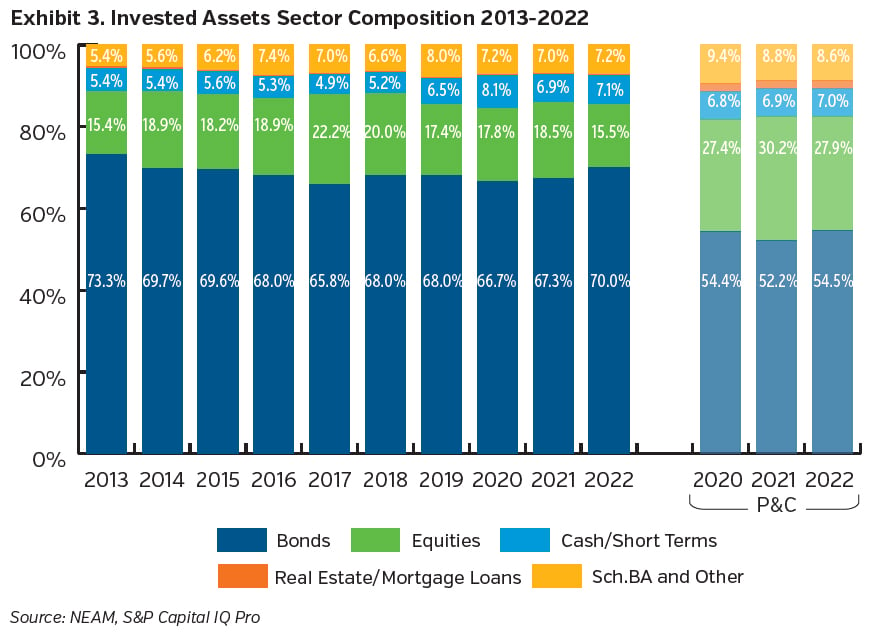
As shown in Exhibit 3, the MPL composite has maintained a different asset allocation by sector compared to the P&C industry. The primary difference lies in the MPL composite’s consistently higher allocation to fixed income and lower allocation to equities over the past decade. The P&C industry has had more Schedule BA assets, although the MPL composite has gradually increased its share over time. It’s noteworthy that both the MPL composite and the P&C industry saw a reduction in equity holdings in 2022, in part due to the challenging market conditions.
Lower Risk Assets as a Percentage of Surplus
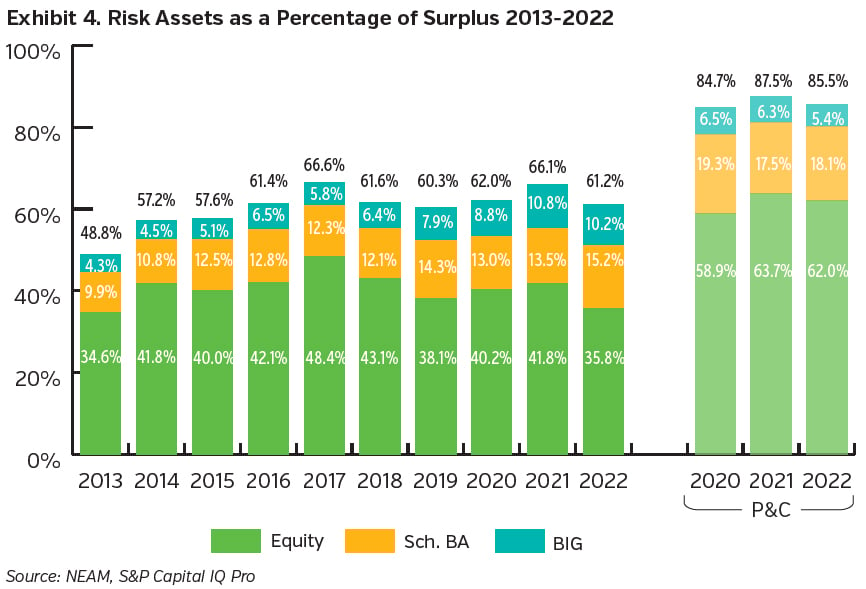
We consider equities, fixed income assets with ratings below investment grade (‘<BBB’) and Schedule BA assets, as risk assets. Exhibit 4 displays risk assets as a percentage of surplus for both the MPL composite and the broader P&C industry. The MPL composite had risk assets of 61.2% of surplus as of year-end 2022, which was lower than the industry’s 85.5%. In 2022, equity holdings decreased for both groups, but it remained the predominant risk asset.
Consistently Trailing Book Yield
As shown in Exhibit 5, the MPL composite’s fixed income portfolio had a lower book yield than the P&C industry in the last 10 years. The difference, which peaked at 39 bps in 2016, has shrunk recently and was 17bps as of year-end 2022. Book yields rose in 2022 as insurers reinvested in higher market yields due to the Fed’s repeated rate increases in 2022. This reversed the declining book yield trend from 2018 to 2021.
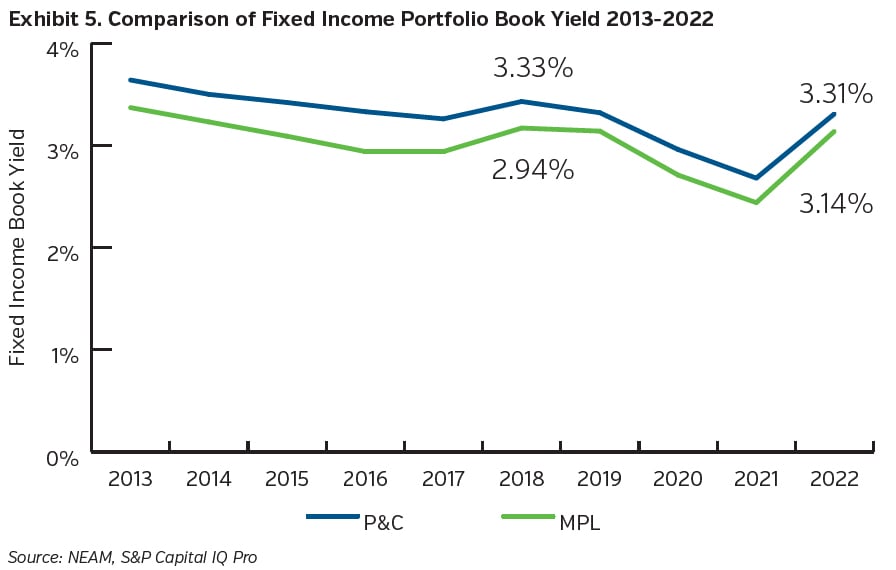
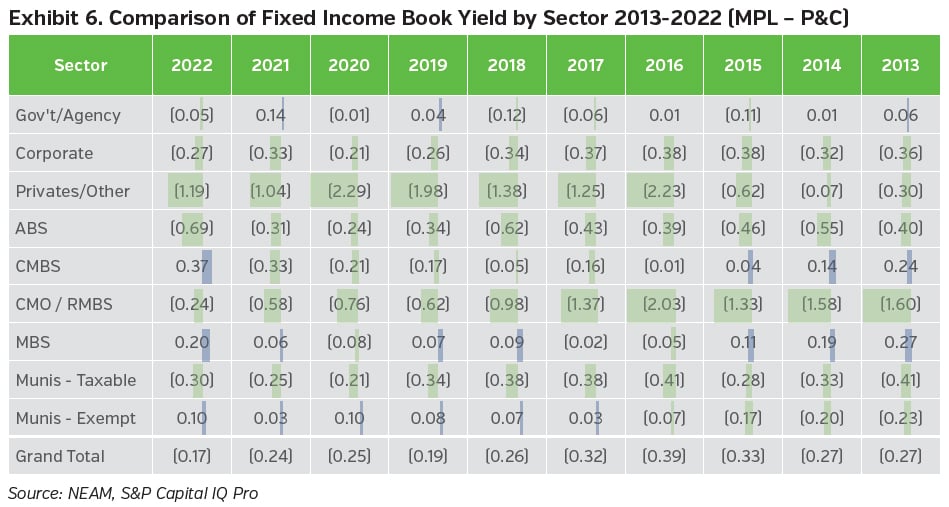
Exhibit 6 illustrates the gap in fixed income book yield between the MPL composite and P&C industry by sector. Over the past decade, the MPL composite had lower book yields than the industry in almost all sectors except for some, such as commercial mortgage-backed securities (CMBS) and mortgage-backed securities (MBS). Private/Other and asset-backed securities (ABS) are the two sectors where the P&C industry outperformed the MPL composite the most in 2022.
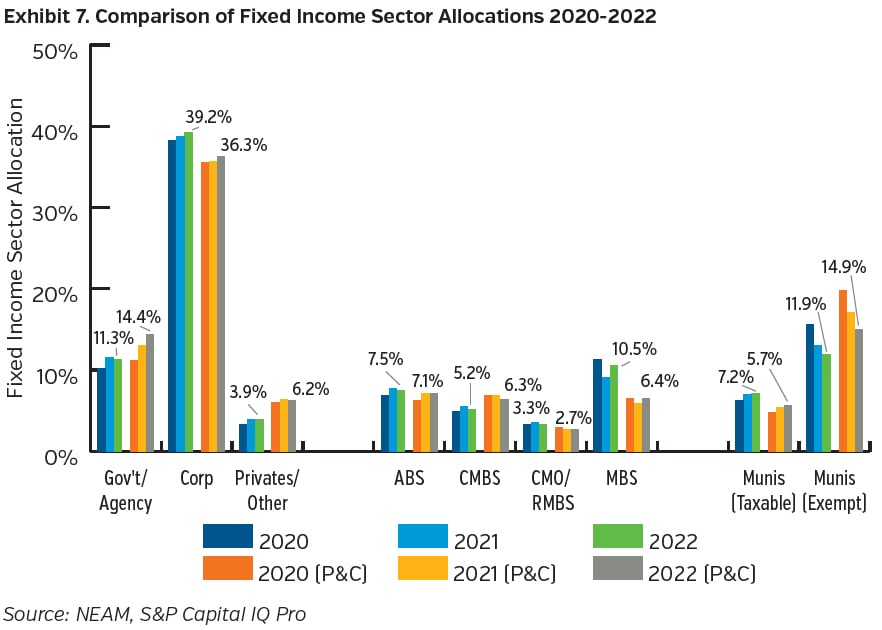
Overweight Mortgage-Backed Securities and Underweight Government/Agency Bonds
The fixed income sector allocations for the MPL composite are shown in Exhibit 7. The MPL composite has gradually increased its holdings of corporate bonds and taxable municipal bonds over time, while the P&C industry more rapidly increased their allocations to government/agency bonds. The MPL composite differs from the P&C industry in having more MBS and corporate bonds but less government/agency and tax-exempt municipal bonds.
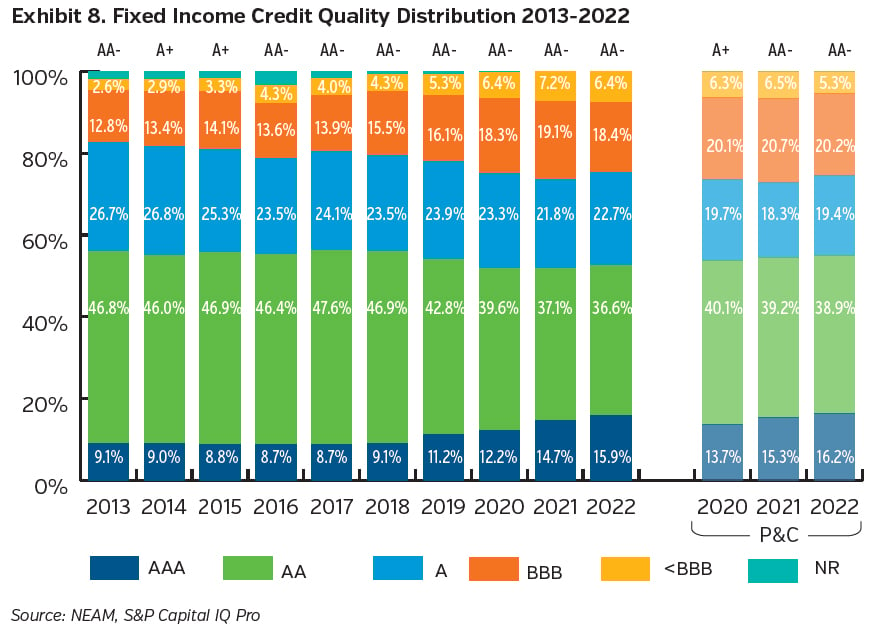
Similar Credit Quality to the P&C industry
Exhibit 8 illustrates the stability of overall credit quality for both the MPL composite and the broader P&C industry over time, as the average credit rating remained within the A+ to AA- range for both groups.3 However, the composition of credit quality changed significantly over the past decade. MPL writers increased their exposure to BBB and <BBB rated bonds until 2021, when they reached their peak. In 2022, the Fed’s tightening policy prompted many MPL writers to shift their investments to higher-rated bonds, especially AAA bonds, to take advantage of rising rates from sectors, such as MBS and ABS. Within the AAA-A band, there was also a gradual substitution of AA-rated bonds with AAA-rated bonds, indicating a preference for maintaining credit quality while allowing for tactical rotations.
Duration In Line with the P&C industry
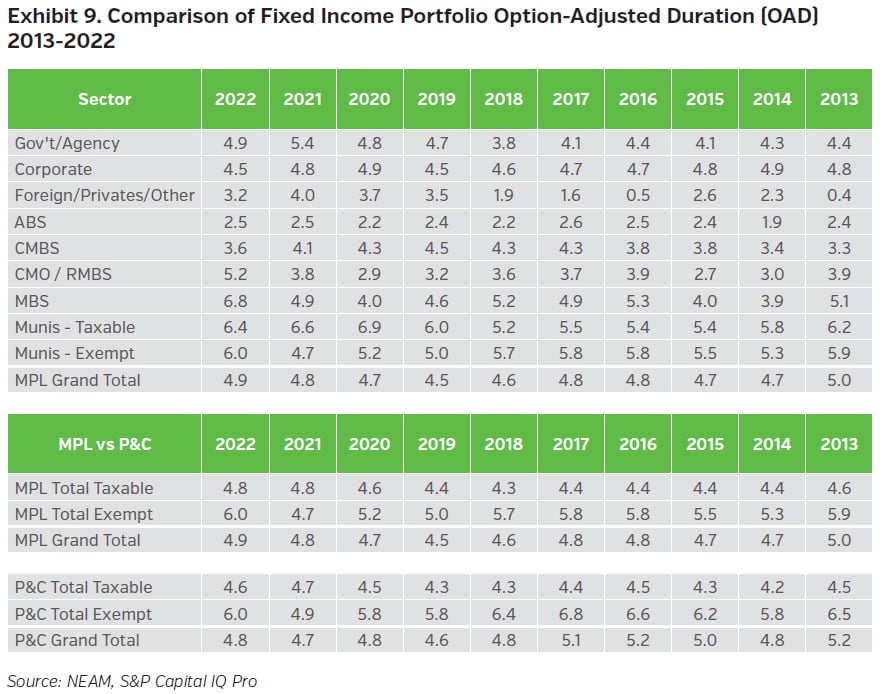
Exhibit 9 displays the option-adjusted duration (OAD) by fixed income sector, comparing the MPL composite and the P&C industry. In the past 10 years, the OADs of the MPL composite and the P&C industry have been similar, with a maximum gap of 0.4 years in 2016. In 2022, the overall OAD of both groups increased slightly from 4.8 to 4.9. For the MPL composite, this was largely driven by the increased allocation to MBS, where OADs tend to extend in periods of rising interest rates. As of year-end 2022, MBS had the longest OAD among all sectors in the MPL composite.
MPL Writers that Took More Risk Achieved Higher Yields
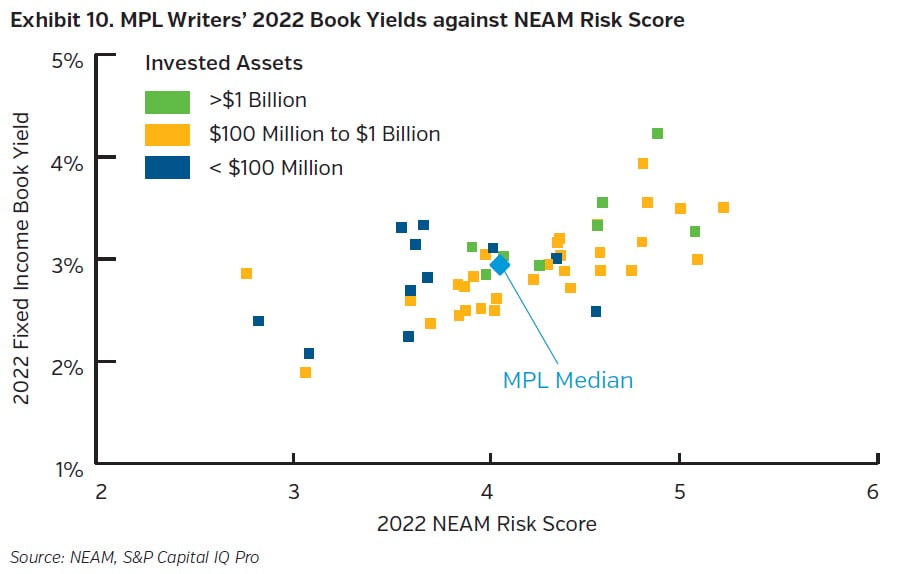
NEAM estimates a Risk Score based on duration, credit quality, and convexity as a way to measure and compare the investment risk of an insurer’s fixed income portfolio through a single metric. Exhibit 10 shows how the book yields of individual MPL writers vary according to NEAM’s Risk Score. The MPL composite’s median is marked by the red point, and individual writers are represented by colors mapped to investment size. Green-marked large-sized companies with assets exceeding US $1 billion in the upper-right hand quadrant achieve higher yields at greater risk, reflecting potentially larger risk-taking by investing into comparably lower rated, longer, and more negatively convex credit. Blue-marked small-sized companies with assets under US $100 million, on the other hand, tend to invest into lower yielding, safer portfolios. Orange-marked medium-sized companies with invested assets between US $100 million and US $1 billion appear more scattered in their risk/reward positioning, showing various levels of tolerance and capacity to take on risk.
KEY TAKEAWAYS
MPL insurers have a unique liability profile that potentially influences their investment choices. We used a composite of MPL firms to represent their overall enterprise profile and compared that with the U.S. P&C industry, excluding MPL, to explore differences in their investment decisions. Some key takeaways from this analysis:
- Compared to the P&C industry, the MPL composite has higher investment leverage but lower premium leverage.
- The MPL composite has been persistently lagging the industry in net investment income (%), driven in part by relatively lower risk asset allocations.
- The MPL composite’s fixed income book yield has been lower than the industry, both overall and within each sector, with a few exceptions such as CMBS and MBS.
- Duration and credit quality profiles for the MPL composite and P&C industry are largely similar. The difference in duration between the two has remained within a range of 0.5 over the past decade, and the average credit quality for both has remained stable at A+ to AA-.
- Within the MPL composite, insurers taking on more risk tended to achieve higher yields. Large companies with invested assets above US $1 billion generally had riskier fixed income portfolios versus smaller firms.
Please contact us if you would like to receive a customized enterprise comparative assessment, which facilitates in-depth comparisons and contrasts of asset and liability characteristics of your company relative to peer organizations or the rest of the U.S. insurance industry. The assessment supports decisions with enterprise risk preferences and investment strategies.
Endnotes
1 NEAM’s definition of MPL writers with invested assets over US $50 million as of December 31, 2022 and net written premium in 2022 over US $10 million.
2 Income returns as a percentage of total invested assets.
3 Starting from 2020, the NAIC credit rating reporting expanded from six to 20 categories. The NR category shown for 2019 and prior years consists of mostly true private placement securities.


