Interest rates are low, equity markets are volatile and both are likely to remain so. Purveyors offering favorable, even “superior,” returns from alternative investments are energized. However, their motivations may not align with the best interests of their customers.
How does the seduction of superior returns from alternatives play in the context of relative performance among the universe of assets and the fiduciary requirements of insurers? And how might their potential translate into metrics, such as Value-at-Risk, or within the context of insurers’ portfolios?
We address these topics in terms of marked-to-market total return and an enterprise risk management framework. Our findings are similar to those we published previously when the songs of the alternative Sirens promised rapture.1 At that time, we noted the episodic nature of alternatives’ returns, a frequent lack of liquidity, varied financial statement optics and mixed return/risk performance relative to traditional asset classes. We seek to balance the seduction of promised returns with a sober accounting of risk.
Our review begins with a summary of the property/casualty industry’s asset allocation. This is followed by displays of historical return and risk metrics for a broad array of asset classes. We next construct “optimal” asset portfolios to assess the return/risk trade-offs resulting from the inclusion of alternative asset classes. And finally, we offer a summary list of soft considerations in the determination of alternatives suitability, which we believe might outweigh statistical evaluations.
All said, we do believe alternative investments might play a role within an insurer’s enterprise capital return and risk management objectives. Equally so, that adjudication must be comprehensive and unbiased. We welcome both those views that challenge our own and those of common ground and invite you to join the conversation.
Current Utilization of Alternative Investments
Table 1 below presents a summary of property/casualty invested asset holdings estimated for year-end 2014 and 2013 and 10 years’ prior reported amounts for comparison purposes. Fixed income investment grade (AAA to BBB rated) securities continue to represent the largest portion of insurers’ invested assets. Below investment grade and non-rated fixed income holdings are about equally weighted. Equities’ increasing share of invested assets reflects market appreciation and continued broad-based net allocations to the asset class.
Table I. U.S. Property/Casualty Invested Assets

Schedule BA assets represent the repository of insurers’ alternative assets. Their allocation has doubled since 2005 (occurring in 2010) primarily reflecting a single insurance group’s purchase of a single asset. Schedule BA assets’ ownership is highly concentrated: one insurance group alone accounts for nearly 44% of the industry total and five groups’ combined holdings tally is nearly 70%. Given the concentration, it appears that alternative investments have not yet been widely embraced within the property/casualty industry.[1]
Historic Returns and Caveats
Chart 1 below displays total return and volatility metrics for a sample of fixed income sectors, several publicly-traded equity classifications and a spectrum of alternative asset classes spanning 1980 to 2014. Not all of the latter might be deemed alternative investment classes except in contrast to more traditional fixed income classes and publicly-traded equities. However, this is a starting point..[2]
Chart I: Annual Total Return and Risk (Standard Deviation) Metrics
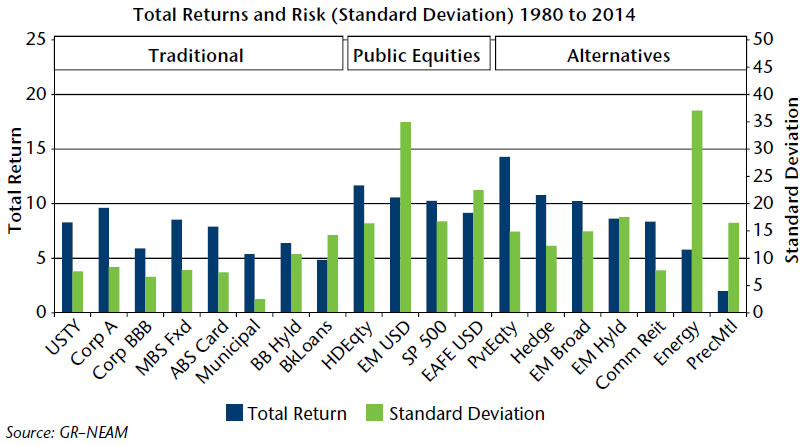
Except for commodities, alternatives and publicly-traded equities display higher historical total returns than most traditional fixed income assets. However, their volatility is often multiples of the traditional investments, reflecting the more episodic nature of their returns in part due to the lack of a stable income stream to anchor valuation changes. We can price the volatility in relation to returns with two very discrete statistics: Sharpe ratios and Tail Value-at-Risk (T-VaR) metrics.
Chart 2 displays historical based Sharpe ratio and T-VaR estimates for the above asset classes. The Sharpe ratio measures the risk premium (total return less the risk-free rate) for a unit of risk (standard deviation of total return). T-VaR is a measure of estimated expected downside loss within a specified period of time (in this case, one year) with a specified probability.
Chart II: Sharpe Ratios and 99.5% Tail Value-at-Risk Metrics
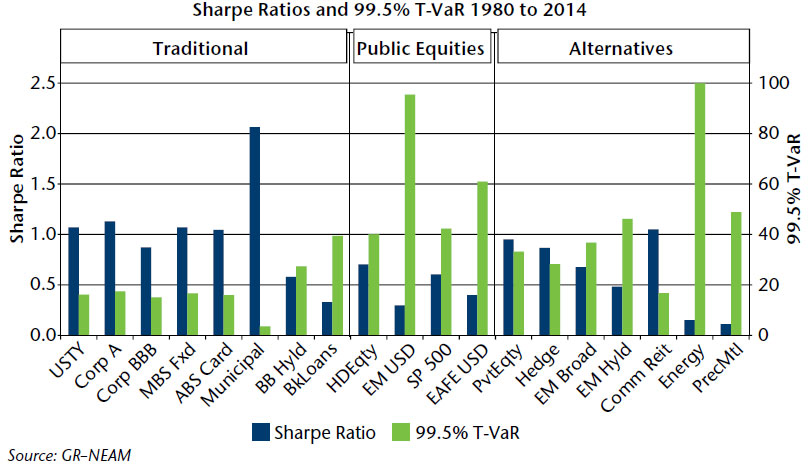
The apparent total return dominance of certain alternative investments is muted by Sharpe ratios and T-VaR estimates. Most alternative investments have low Sharpe ratios and high estimated T-VaR values in contrast to traditional asset classes highlighting the trade-off between the various asset classes. Commercial real estate is a notable exception. In relation to publicly-traded equities, the return/risk trade-off with alternatives is less clear. That invites the question as to alternatives’ role in the context of an insurer’s portfolio, leading to a discussion of the investment component of enterprise risk budgets.
Investment Risk Budgets and the Impact of Portfolio Diversification
We assess the impact of individual asset classes’ return/risk characteristics in the context of portfolio construction, which further accounts for diversification benefits attributable to each asset class or sector. Chart 3 depicts a mean-variance efficient frontier derived from alternative and traditional asset classes that are based upon prospective returns, historical volatilities and correlations.
Chart III: Mean-Variance Efficient Frontier
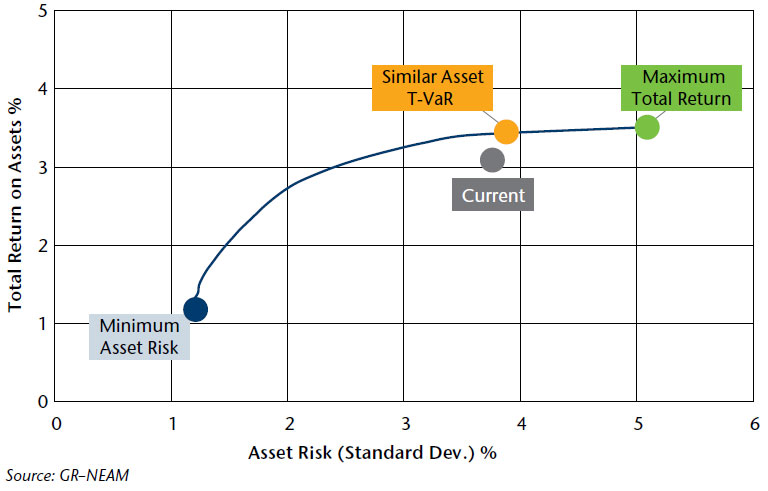
Portfolio outcomes range from a minimum risk of 1.2% (and an after-tax total return on assets of 1.19%) to a maximum after-tax total return on assets of 3.5% (and a corresponding risk of 5.07%). The highlighted “current” point represents the expected mean and standard deviation of a portfolio having the approximate asset allocation and fixed income sector/credit/duration profile of our estimates for the P/C industry at year-end 2014.
Table 2 displays asset allocation highlights for a range of portfolios beginning with our estimate for 2014 holdings. The results section shows portfolio outcomes across all asset classes and fixed income sectors including the portfolio having an estimated 99.5% T-VaR, similar to the current holdings portfolio. The additional metrics and rating summary sections address primarily fixed income sectors and are further defined in the appendix. The sector distribution section should be self-explanatory.
Table II: 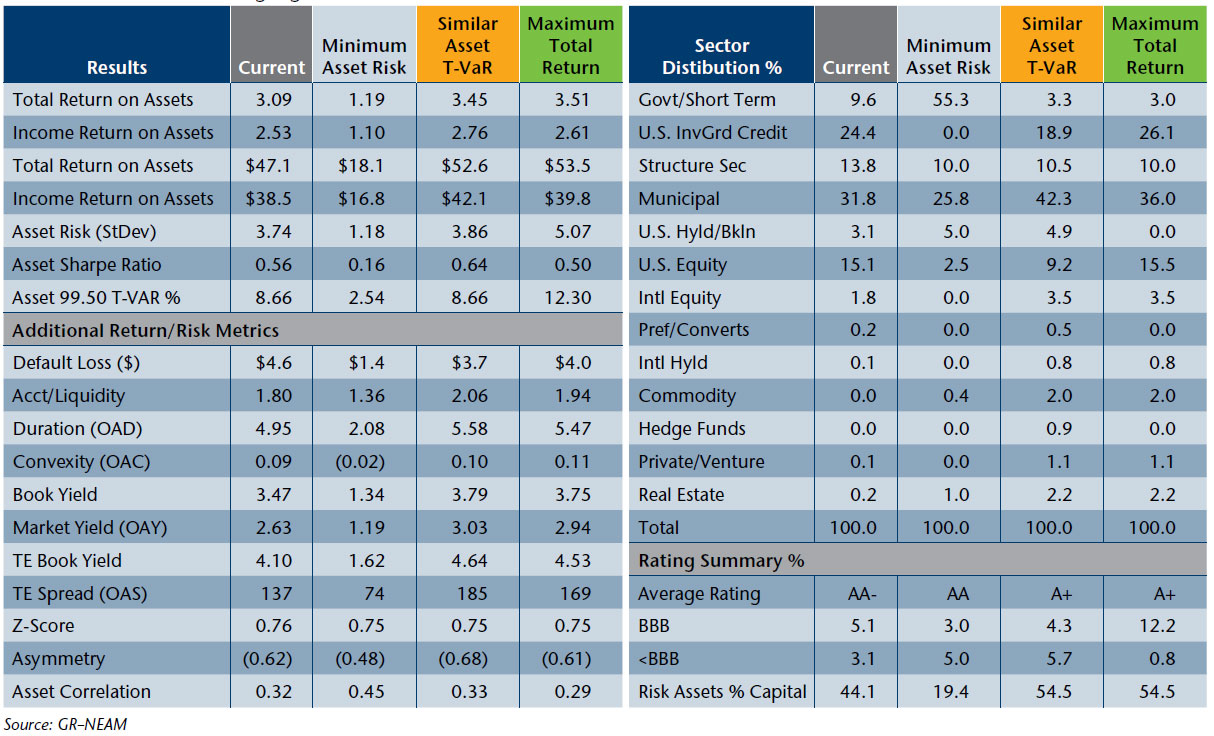
The range of outcomes is quite varied across the three highlighted portfolios. The minimum asset risk (and lowest return) portfolio displays the lowest Sharpe ratio, T-VaR, duration and fixed income spread (OAS). It also has the best liquidity score, the lowest expected net default loss and highest credit quality rating, the highest asset risk correlation (lowest portfolio diversification) and least amount of alternative assets. Also, note the improvement due to a simple reallocation of traditional fixed income assets to the municipal sector from the minimum risk to a similar T-VaR configuration.
Chart 4 below summarizes the impact of excluding alternative investments as eligible assets. The difference in after-tax total return on assets is negligible. As an aside, the asset allocation in both instances is based upon after-tax total returns that place a bias in favor of assets with preferential tax treatment.
Chart IV: Efficient Frontier With and Without Alternative Investments
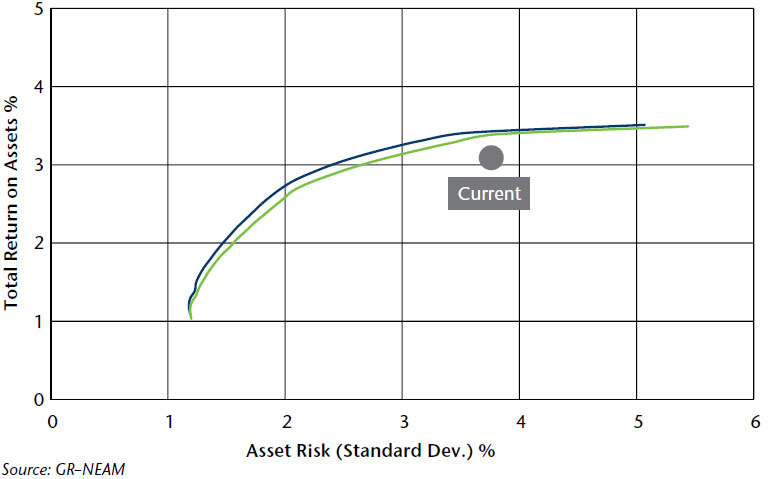
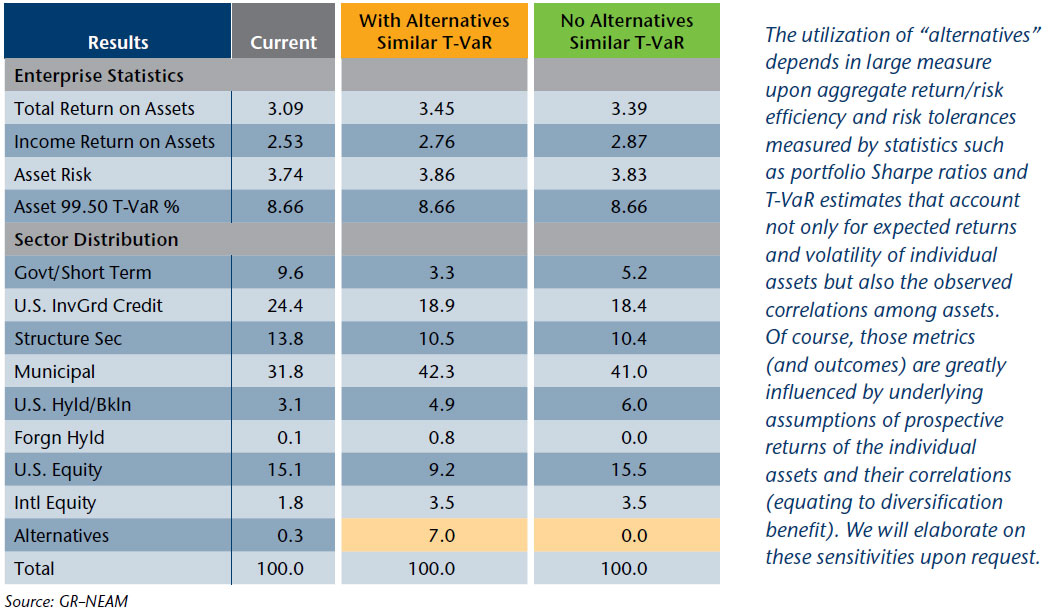
Table 3 displays the sector allocations for the two “optimized” portfolios shown in Chart 4: similar T-VaR with and without alternative assets. Eliminating alternative assets reduces the increase in the expected after-tax total return on assets about six basis points. Rather than investing in alternatives there becomes an increased allocation to U.S. equities, including high dividend paying securities (tax advantaged), and below investment grade securities, principally floating rate bank loans.
Table III: Asset Allocation
Additional Considerations
Beyond the statistical analytics above are numerous other considerations that must be evaluated in the adjudication process to decide the suitability of (all) alternative asset classes within an insurer’s portfolio. We highlight several of these considerations below and note asset classes for which the consideration is most likely relevant. They are not shown in any preferential order.
> Regulatory/reporting transparency and valuation (hedge funds/private equity)
> Survivorship bias in reported results (hedge funds/private equity)
> Illiquidity/lock-ups (hedge funds/private equity/other specialized mandates)
> Execution strategy (commodities/specialized mandates)
> Basis and magnitude of fee structure (hedge funds/private equity/specialized mandates/fund structures)
> Accounting risk (structured securities)
> “Book income” versus “price” components of total return optics (fixed versus equity-like returns)
> After-tax versus pre-tax considerations (tax-preferenced instruments)
> Phantom income (discount securities/mutual fund structures)
> Foreign exchange/hedging exposure (international securities)
> Episodic nature of returns/volatility (commodities)
> Regulatory/rating agency capital charges/restrictions (all asset classes)
Summary
We believe that alternative assets can have a role within insurers’ investment portfolios. However, that role currently is limited to few P/C and Life insurers. Additionally, we believe that the evaluation of these opportunities must be performed within the context of a comprehensive risk framework consistent with the insurer’s adjudication of all return/risk opportunities across a spectrum insurance products and investments.
The “appropriate” allocation must consider prospective return and risk estimates, enterprise return and risk budgets, continuous review/stress testing and numerous other factors that might not be so readily subject to purely quantitative review. This requires a rigorous enterprise risk and capital framework to guide risk/return identification, measurement and management for all assets of the insurer.
Endnotes
1 Please see the October 2006, General ReView, “Alternative Investments: Asset Classes Eligible for Insurers?”
2 “Alternative” assets’ ownership concentration is slightly less in the life segment but their share of total invested assets is less than half that of the P&C segment. Please see November 2013, General ReView, “Alternative Investments: Who Owns What?”
3 Bank loans are heavily skewed by the 2007/2009 financial dislocation and due to structural changes might over-state prospective volatility. Emerging market securities and EAFA equities reflect currency translation in addition to local market volatility. Commodity alternatives are proxied by their respective futures total returns.
Appendix
Default Loss
Estimated annual default losses net of recoveries expressed in the insurer’s native currency.
Acct/Liquidity
An ordinal scale (1 = highest, 4=lowest) to reflect severity of either accounting or liquidity risk associated with a particular asset.
TE
Tax-equivalent.
Z-Score
Number of standard deviations current spreads deviate from 60-month mean. Positive spread equates to “cheap” valuation and negative spread equates to “rich” evaluation. In the event of a reversion to mean valuations, “cheap” portfolios will provide greater total return than “rich” portfolios.
Asymmetry
A measure of skewness of portfolio’s total return. Negative skewed returns demonstrate greater likelihood of (extreme) downside risk.
Asset correlation
Represents a measure of potential portfolio diversification. It equals the weghted sum individual asset holding’s correlations to one another. Value range from -1 (maximum diversification benefit) to +1 (no diversification benefits).
Risk Assets %
Capital Risk assets are defined as all fixed income assets which are either unrated or rated below investment grade plus all other non-fixed income assets (all equities) and expressed as a percent of capital.


