



Executive Summary
Private debt has become one of the most closely watched segments of the credit markets, yet insurers’ exposure remains difficult to quantify. Traditional private placements,1 privately negotiated debt securities outside the public markets, represent an identifiable component of insurers’ private debt exposure that can be consistently tracked through statutory filings. Using these filings, we examine private placement allocations, portfolio characteristics, and historical performance across life insurers, P&C insurers, and private equity (PE)-backed life insurers.2
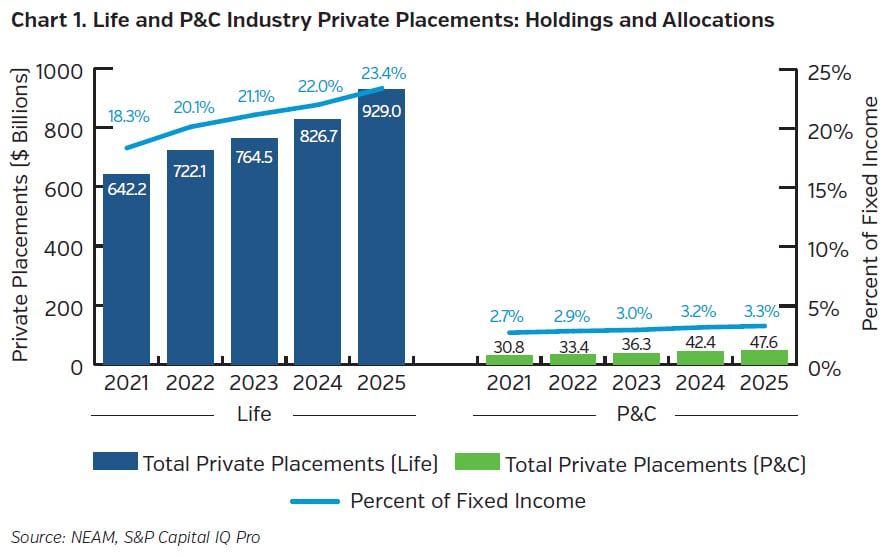
Private placements play a much larger role in life insurer portfolios than in P&C portfolios. In 2025, life insurers held $929 billion of private placements, representing 23.4% of fixed income holdings, compared with $48 billion and 3.3%, respectively, for P&C insurers. Life insurers invested further out the maturity curve and maintained a higher-quality private placement credit mix, although holdings in both industries remained predominantly investment grade.
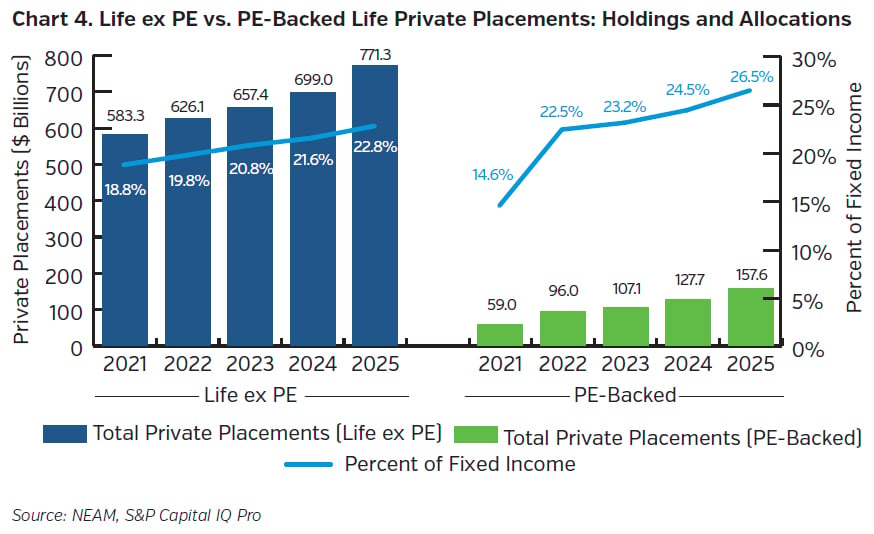
Within the life industry, PE-backed insurers maintained higher private placement allocations than life insurers excluding PE-backed companies (“life ex PE”). In 2025, private placements represented 26.5% of PE-backed life insurers’ fixed income holdings compared with 22.8% for life ex PE insurers. The two groups also showed meaningful differences in the underlying credit quality of their private placement holdings. Over the 2016 - 2025 period, PE-backed life insurers had higher historical total returns with lower volatility on their private placement investments compared with life ex PE insurers.
Private Debt is Growing, but Difficult to Observe
Insurers’ broader private debt exposure has attracted increased attention in recent years, yet remains difficult to quantify comprehensively. Statutory filings provide limited transparency into many forms of private debt, particularly when investments are held through pooled investment vehicles, fund structures, or other arrangements that obscure the underlying assets.
Private debt encompasses a broad range of privately negotiated credit investments, including private placements, direct lending, middle-market loans, asset-backed private credit, and private credit funds. While some market participants have used private letter rated (PLR) securities as a proxy for broader private credit exposure, they represent only a subset of the broader private debt universe.
Private placements, however, can be more consistently identified within statutory filings than many other forms of private debt, allowing for standardized analysis of portfolio allocations, credit quality, maturity profiles, and historical performance. This makes private placements one of the clearest windows into insurers’ private debt exposure and the focus of this paper. We examine private placement trends across the U.S. life and P&C industries, with additional analysis comparing PE-backed life insurers with life insurers excluding PE-backed companies.
Private Placements Continue to Grow Across Life and P&C Insurers
Private placements have long been an important component of insurer investment portfolios, particularly within the life industry. Over recent years, allocations increased across both life and P&C insurers, although their scale and portfolio characteristics differ considerably. As shown in Chart 1, life industry private placement holdings increased from $642 billion in 2021 to $929 billion in 2025, while P&C holdings increased from $31 billion to $48 billion. Private placements also represented a substantially larger share of life insurers’ fixed income portfolios, increasing from 18.3% in 2021 to 23.4% in 2025, compared with an increase from 2.7% to 3.3% for P&C insurers over the same period.
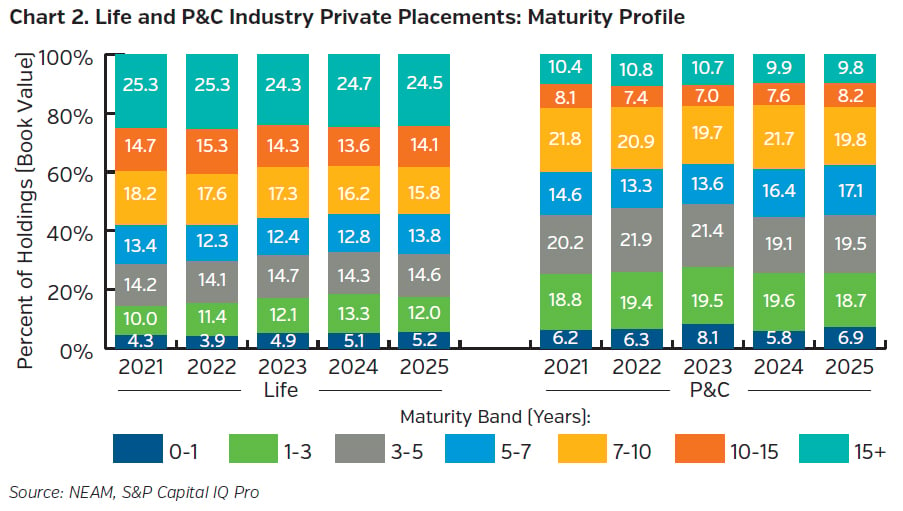
The maturity profile of private placement portfolios also differs between the two industries. Life insurers maintain a greater concentration in longer-dated private placements, consistent with the longer-tail nature of their liabilities. As shown in Chart 2, approximately 39% of life private placements had remaining maturities of 10 years or more in 2025, compared with approximately 18% for P&C insurers. P&C holdings were more heavily weighted toward maturities of less than five years.
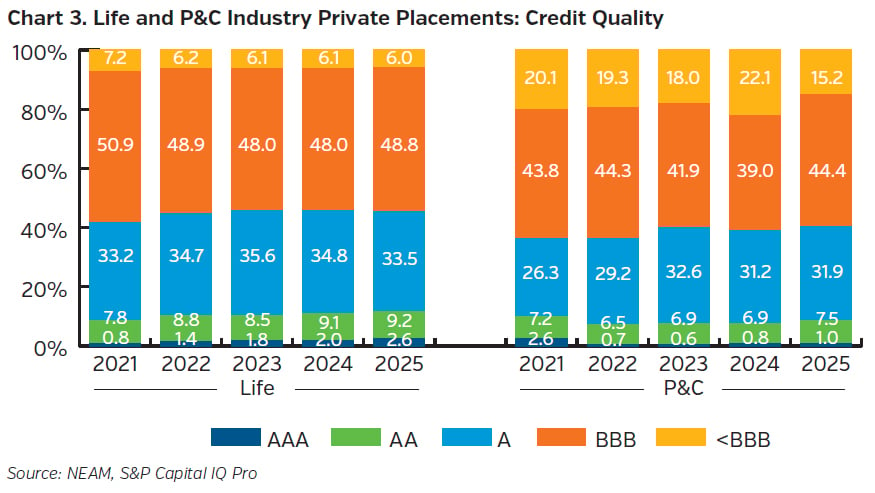
Private placements were predominantly investment grade for both industries throughout the period, although life insurers maintained a somewhat higher-quality credit mix. As shown in Chart 3, A-and-above-rated securities represented approximately 45% of life private placements in 2025 compared with 40% for P&C insurers, while <BBB-rated securities represented approximately 6% and 15%, respectively. BBB-rated securities represented the largest component for both industries.
PE-Backed Life Insurers: A Distinct Private Placement Profile
PE-backed life insurers accounted for 16.0% of the U.S. life industry’s net admitted cash and invested assets in 2025, up from 11.3% in 2021. Their growing share of the life industry makes PE-backed life insurers’ investment activity increasingly relevant to broader portfolio trends. We therefore compare their private placement holdings with those of life insurers excluding PE-backed companies (“life ex PE”). For purposes of this analysis, PE-backed life insurers refer to U.S. life insurers that are majority-owned or controlled by private equity firms or their affiliated asset managers as of year-end 2025. Historical comparisons use these same ownership groups over the full measurement period.
As shown in Chart 4, private placement allocations among PE-backed life insurers increased from 14.6% of fixed income portfolios in 2021 to 26.5% in 2025, while the life ex PE allocation increased from 18.8% to 22.8%. In dollar terms, PE-backed private placement holdings increased from $59 billion to $158 billion over the period, while life ex PE holdings increased from $583 billion to $771 billion.
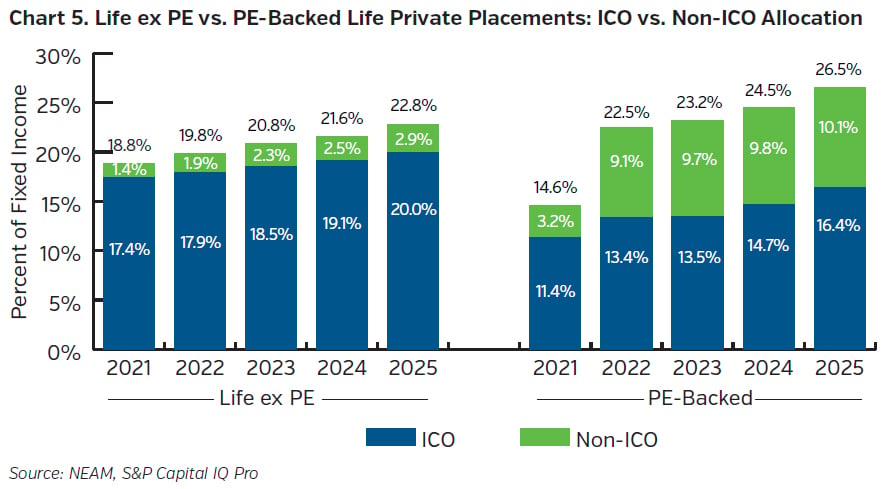
As shown in Chart 5, the higher private placement allocation among PE-backed life insurers is concentrated in non-issuer credit obligation (Non-ICO) securities,3 which include asset-backed and other structured securities, residential and commercial mortgage-backed securities, bank loans, and certificates of deposit. In 2025, Non-ICO private placements represented 10.1% of fixed income for PE-backed life insurers, compared with 2.9% for life ex PE insurers. ICO private placements represented 16.4% of fixed income holdings for PE-backed life insurers, compared with 20.0% for life ex PE.
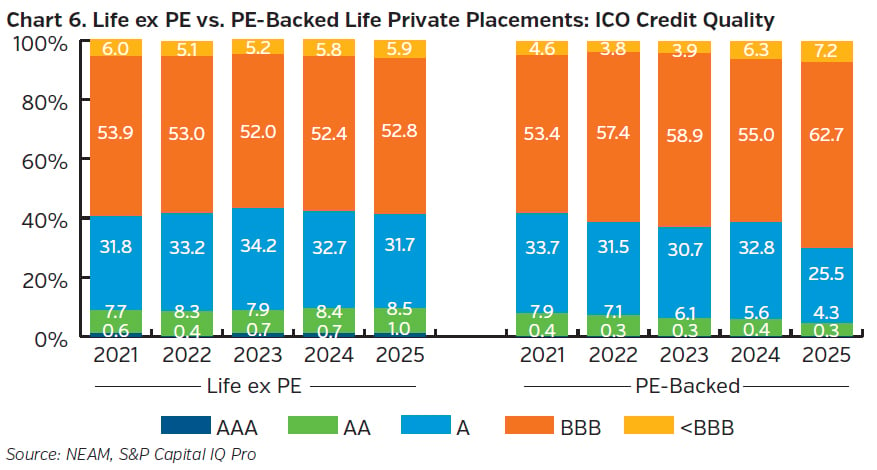
The underlying credit quality of ICO and Non-ICO private placements differs meaningfully between PE-backed and life ex PE insurers. As shown in Chart 6, life ex PE ICO holdings maintained a relatively stable credit profile, while PE-backed ICO holdings became increasingly concentrated in BBB-rated securities, which represented 63% of holdings in 2025 compared with 53% for life ex PE.
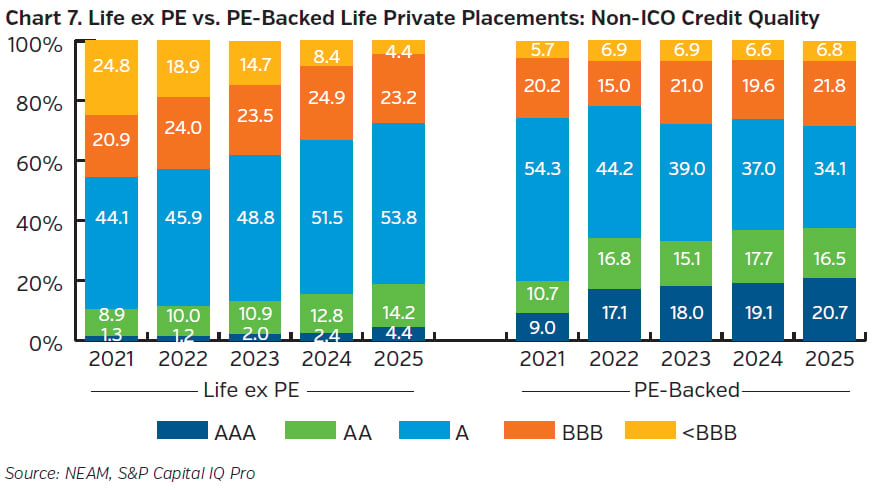
The differences are more pronounced among Non-ICO holdings. As shown in Chart 7, both groups shifted toward higher credit quality over the period, although in different ways. PE-backed life insurers increased their allocation to AAA-rated securities, reaching 21% in 2025 compared with 9% in 2021. Life ex PE insurers steadily reduced their allocation to <BBB-rated securities, from 25% in 2021 to 4% in 2025, alongside increased allocations to A-and-above securities.
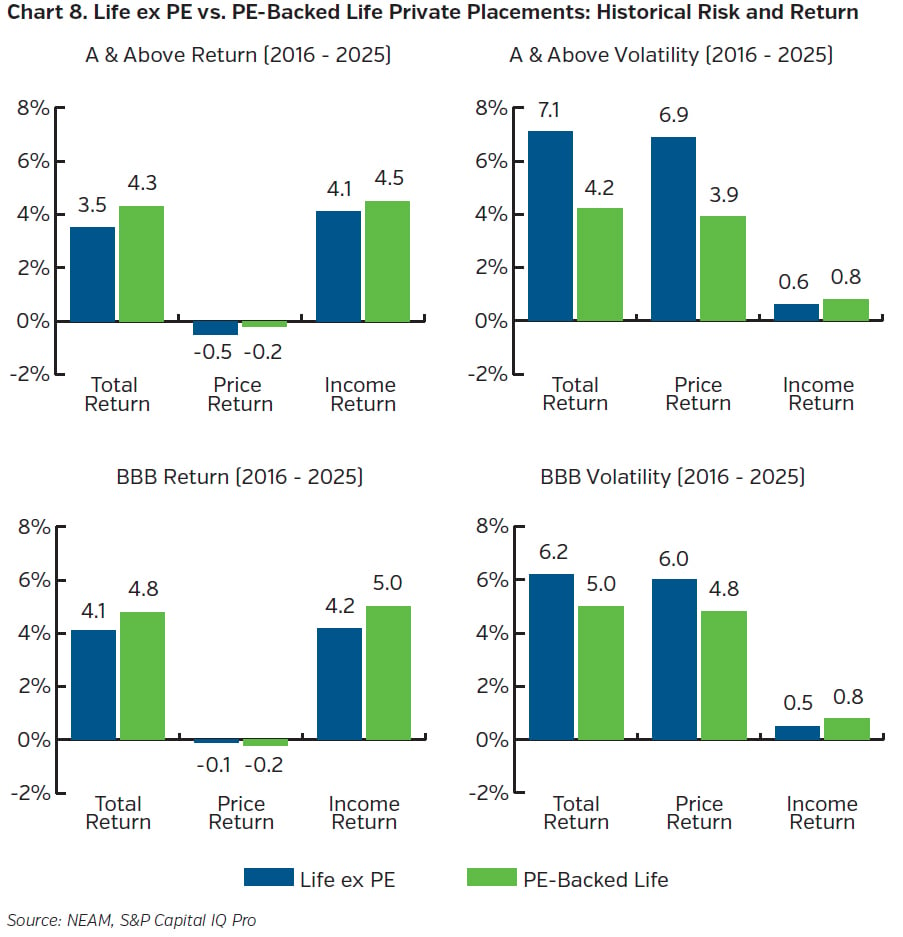
To evaluate historical performance4 over a longer period, Chart 8 compares return and volatility for PE-backed and life ex PE insurers from 2016 to 2025. PE-backed life insurers exhibited higher historical returns and lower volatility across both rating categories. For A-and-above rated private placements, PE-backed life insurers generated a 4.3% average annual total return with 4.2% volatility, compared with a 3.5% return and 7.1% volatility for life ex PE insurers. For BBB-rated private placements, total returns were 4.8% and 4.1%, respectively, with volatility of 5.0% and 6.2%.
Key Takeaways
• Insurers’ broader private debt exposure remains difficult to observe through statutory filings. Private placements are an important exception, providing one of the clearest and most consistent views into insurers’ private debt exposure.
• Private placements play a much larger role in life insurer portfolios than in P&C portfolios. In 2025, private placements represented 23.4% of life insurers’ fixed income holdings compared with 3.3% for P&C insurers.
• PE-backed life insurers maintained higher private placement allocations than life ex PE insurers, with differences in both portfolio composition and underlying credit quality.
• PE-backed life insurers generated higher historical total returns and lower volatility than life ex PE insurers over the 2016 - 2025 period.
Endnotes
1 For purposes of this study, private placements are privately negotiated debt securities offered to accredited investors pursuant to Section 4(a)(2) of the Securities Act of 1933 and exempt from public registration requirements. Private placements are identified using CUSIP Global Services private placement indicators. Securities with *, #, or @ in positions 6, 7, or 8 of the CUSIP are classified as private placements, regardless of credit quality. While this convention supports consistent analysis of statutory holdings, NEAM generally characterizes below-investment-grade private debt as private credit rather than traditional private placements.
2 PE-backed life insurers are identified based on publicly available ownership information as of year-end 2025. The PE-backed group consists of 16 U.S. life insurance groups and reflects NEAM’s classification for purposes of this analysis.
3 Effective in 2025, the NAIC’s Principles-Based Bond Project introduced revised bond classifications, including Issuer Credit Obligations (ICOs). References to ICO and Non-ICO private placements in this paper reflect these updated statutory reporting definitions. Non-ICO private placements encompass a range of instruments, including asset-backed and other structured securities, residential and commercial mortgage-backed securities, bank loans, and certificates of deposit. Historical holdings have been classified retrospectively using the updated ICO and Non-ICO framework.
4 Total return estimates are calculated using NEAM’s proprietary security-level methodology, incorporating coupon income and changes in insurer-reported statutory values while adjusting for purchases, sales, maturities, and other security lifecycle events. Returns are therefore based on reported security values rather than index mapping or an independent marked-to-market pricing mechanism. Historical returns represent the arithmetic average of annual total return estimates over the 2016-2025 period, while volatility is calculated as the standard deviation of those annual estimates.