



Executive Summary
In 2025, the U.S. P&C insurance industry’s net investment income declined modestly, as lower equity dividend income more than offset the benefits of higher bond yields. Nevertheless, book yield for the industry reached a decade high of 4.39%, extending its upward trend since 2021.
Industry asset allocation remained broadly stable, although aggregate trends were materially influenced by a single large insurer that reduced exposure to equities and Schedule BA assets while increasing cash and short-term holdings. Excluding this outlier, risk asset exposure has moderated since its 2021 peak, but overall portfolio positioning has changed little.
Fixed income portfolios continued to benefit from higher yields, alongside improving credit quality and stable duration. Within fixed income, insurers have gradually shifted allocations away from tax-exempt municipals toward structured securities and private placements, reflecting a continued focus on enhancing portfolio income while maintaining prudent risk profiles.
Net Investment Income (NII) Declined, Despite Elevated Bond Yields
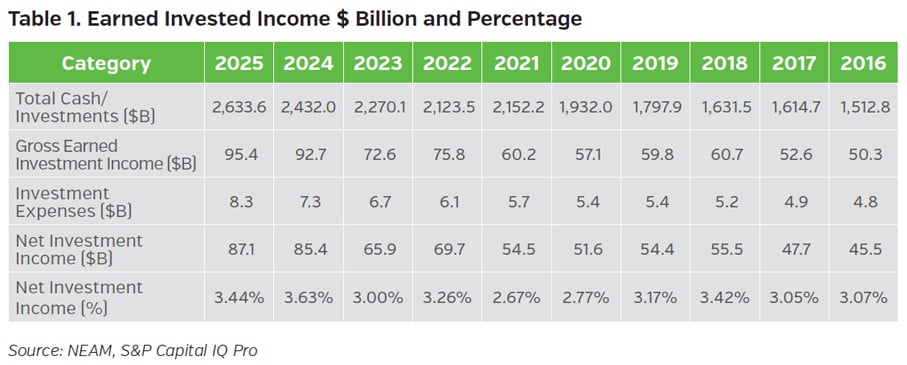
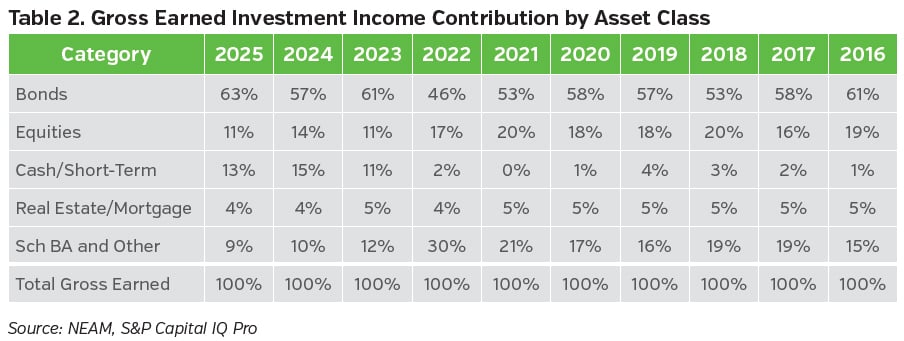
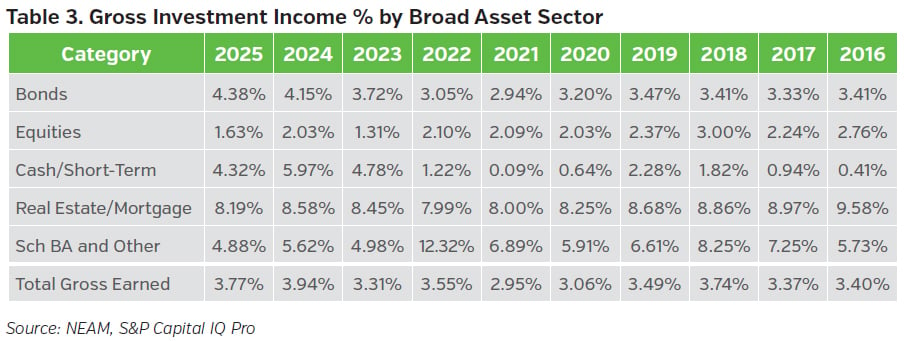
Table 1 shows that total cash and invested assets increased 8% to $2.63 trillion in 2025. While net investment income (NII) in dollar terms reached a new decade high, the NII ratio (%) declined modestly from its 2024 peak. As shown in Table 2, fixed income securities continued to dominate investment income, with their contribution reaching a decade-high 63% of total income, supported by record book yields (Table 4). Cash and short-term investments remained the second-largest income source at 13%, surpassing both equities and Schedule BA assets. However, overall gross investment income as a percentage of invested assets declined modestly (Table 3), as lower equity dividend income more than offset the benefit of higher bond yields.
Bond Allocation Remained Dominant and Stable
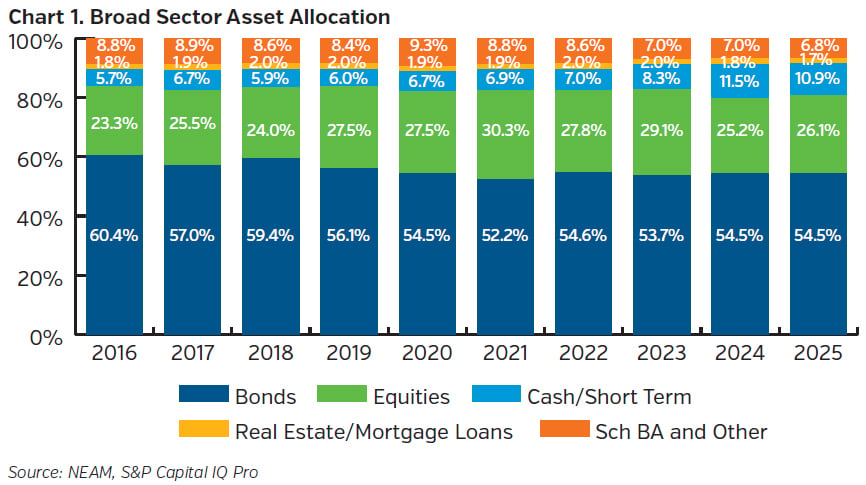
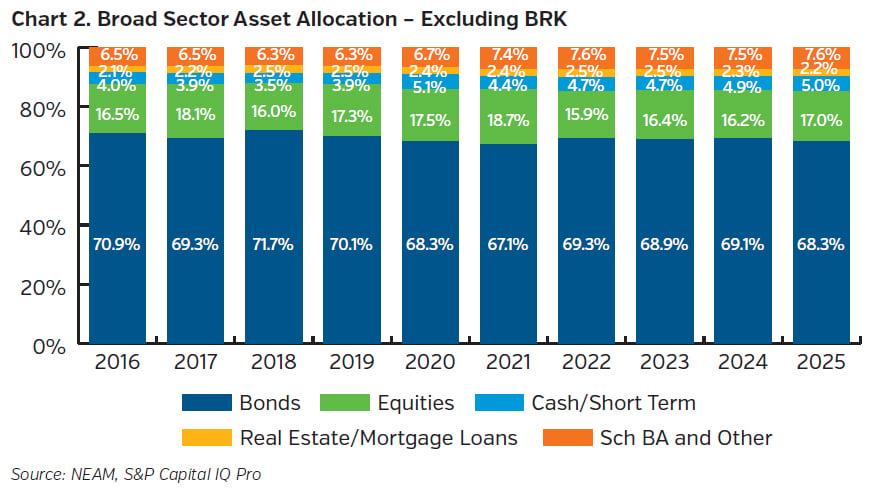
Chart 1 shows the industry’s statutory asset allocation across broad sectors over the past decade. Bonds remained the dominant asset class, though their share declined from 60.4% in 2016 to 54.5% in 2025. Despite this decline, elevated book yields have supported a relatively stable bond allocation over the past four years. Equities, the second-largest asset class, declined from 29.1% in 2023 to 25.2% in 2024, largely reflecting Berkshire Hathaway’s (BRK) reallocation to cash and short-term investments. This shift contributed to a record-high 11.5% allocation to cash and short-term investments in 2024. Excluding BRK, the industry’s asset allocation has remained broadly stable over the past four years (Chart 2), with higher bond allocations and lower equity and cash exposures than headline figures suggest.
Risk Asset Allocation Declined, Driven by Alternatives and Below-Investment-Grade Bonds
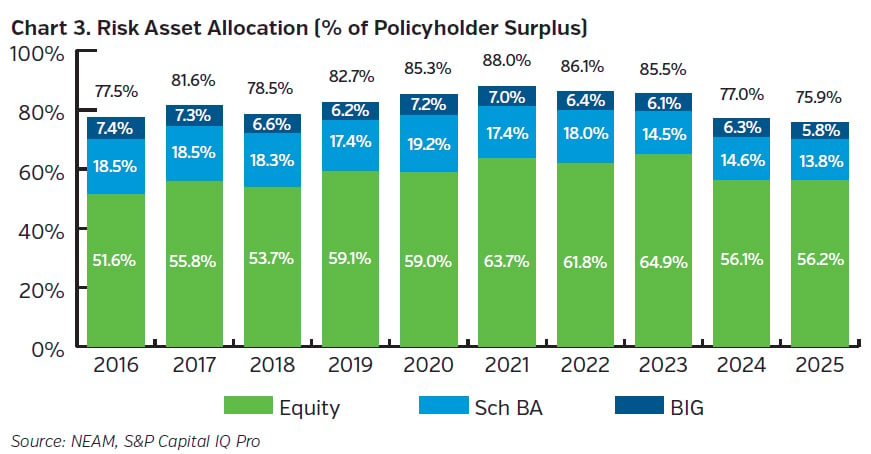
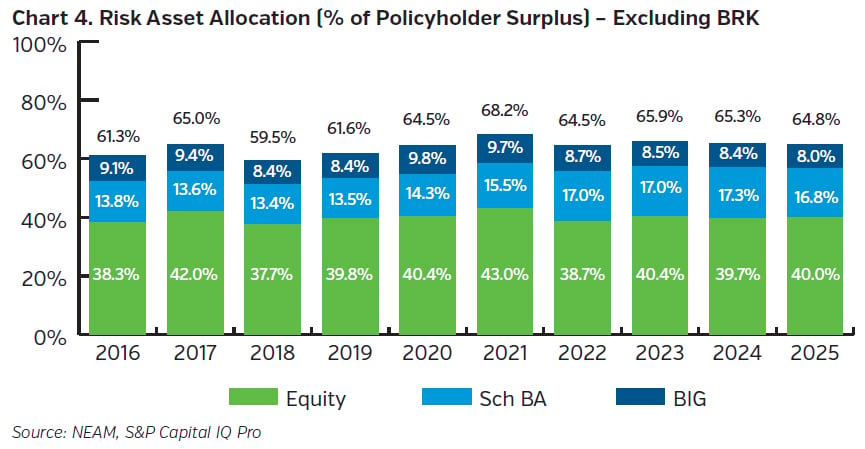
The P&C industry’s allocation to risk assets, measured at fair value under statutory accounting, continued to decline after peaking at 88.0% of surplus at year-end 2021 (Chart 3). The 2024 decline was largely driven by BRK’s reduction in equity exposure. Schedule BA assets also declined, from a peak of 19.2% in 2020 to 13.8% at year-end 2025. Excluding BRK, overall risk asset allocation has remained broadly stable over the past four years (Chart 4), with lower equity exposure and higher allocations to Schedule BA assets and below investment-grade bonds relative to the broader industry.
Fixed Income Allocations Continued to Shift Toward Structured Securities
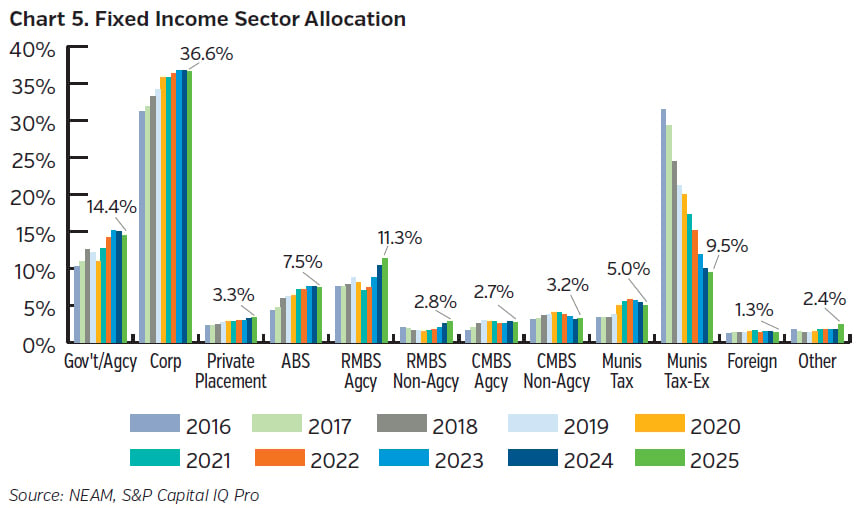
Chart 5 illustrates long-term trends in fixed income sector allocations over the past decade. Corporate bond allocations stabilized after reaching a record high in 2023, comprising over one-third of industry fixed income holdings at year-end 2025. In contrast, tax-exempt municipal allocations have declined steadily, with the pace accelerating following the 2018 tax reform; they now account for less than 10% of fixed income exposure.
Within structured securities, including asset-backed securities (ABS), residential mortgage-backed securities (RMBS), and commercial mortgage-backed securities (CMBS), Agency RMBS and ABS have grown over the past five years and now represent the two largest subsectors. Non-agency RMBS has also increased over the same period, while CMBS allocations have declined.
Taxable municipals represented 5% of fixed income portfolios in 2025, declining modestly since 2022 amid reduced issuance. Government and Agency securities declined modestly to 14.4% of fixed income allocations in 2025 but remained the second-largest sector. Meanwhile, private placements continued to grow, reaching 3.3% of fixed income allocations.
Book Yield Continued to Climb and Reached a Decade High
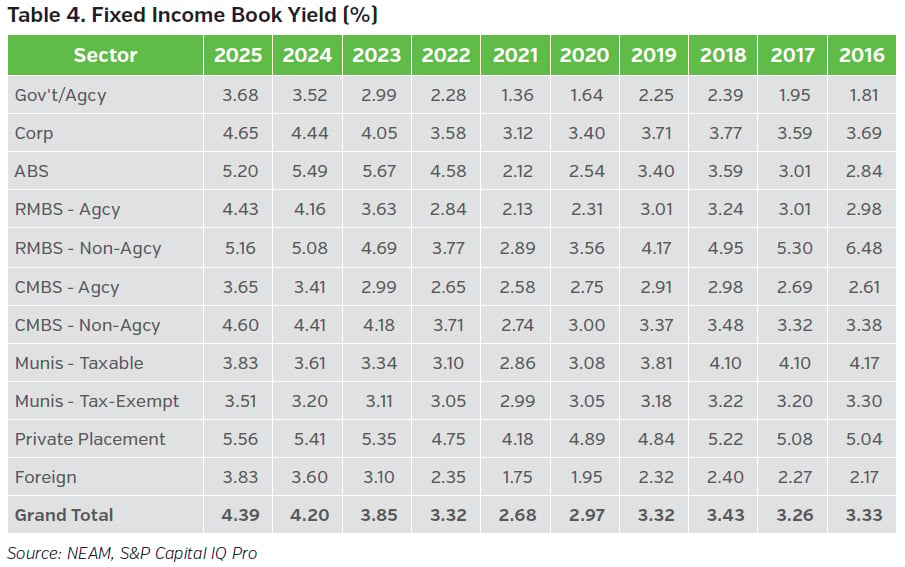
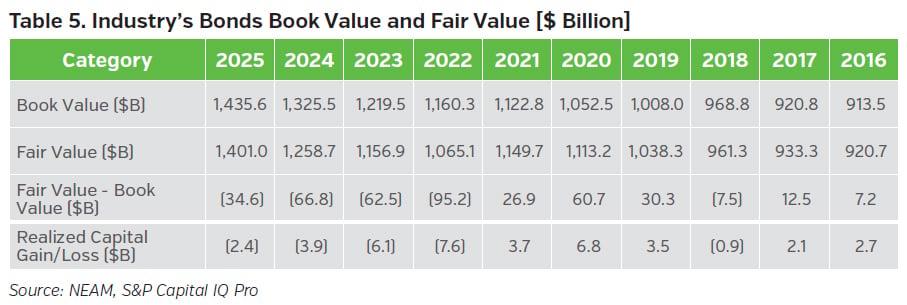
The industry’s book yield increased by 19 bps in 2025 to 4.39% at year-end, supported by elevated interest rates thus marking the highest level in a decade. Book yields rose across most fixed income sectors, with ABS, non-agency RMBS, and private placements exceeding 5% (see Table 4). Higher market yields continued to weigh on the fair value of existing holdings, leaving industry fair values below statutory book value since 2022. As insurers locked in higher yields, they also realized investment losses from 2022 through 2025 (see Table 5).
Balancing yield enhancement against realized losses requires a holistic approach that integrates enterprise objectives, asset allocation, underwriting characteristics, and business profiles. Such an approach is increasingly critical as insurers navigate evolving insurance cycles and heightened economic, geopolitical, and market uncertainty.
Credit Quality Improved Amid Higher Interest Rates
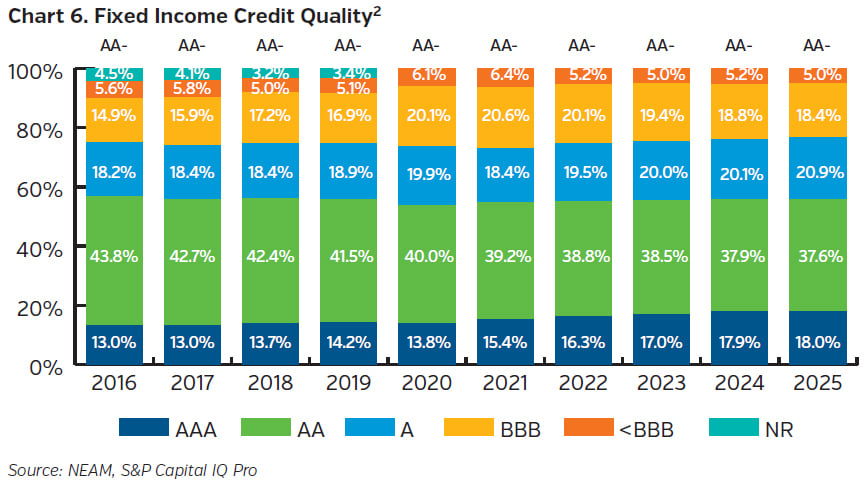
Chart 6 highlights trends in the credit quality of fixed income portfolios. Prior to 2022, the prolonged low interest rate environment encouraged insurers to assume greater credit risk, with allocations to BBB-rated and below investment-grade bonds increasing and peaking in 2021. Since 2022, higher interest rates have enabled insurers to improve credit quality while maintaining attractive yields. As a result, the industry has shifted allocations toward higher-rated securities, particularly AAA-rated bonds, while reducing exposure to BBB-rated and below investment-grade holdings. This repositioning has been supported by increased allocations to Government and Agency securities, ABS, and Agency RMBS (see Chart 5), contributing to an overall improvement in portfolio credit quality.
Duration Remained Range-Bound
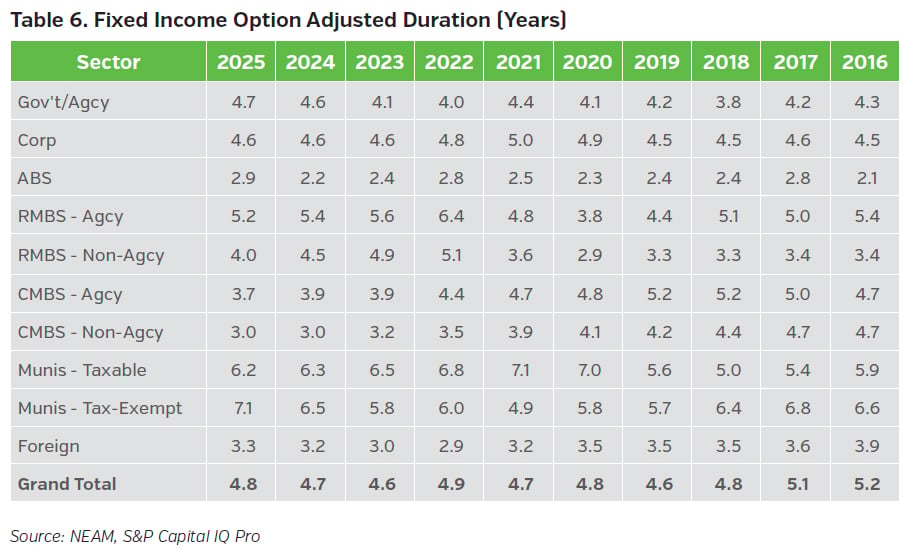
Table 6 presents option-adjusted duration (OAD) by fixed income sector, based on CUSIP-level holdings from Schedule D statutory filings. The data excludes bonds held at the holding company level, as well as derivatives and private placements. The modest extension in duration in 2025 was primarily driven by increased allocations to Agency RMBS and duration extension within the ABS sector. Since 2018, the industry’s aggregate OAD has remained relatively stable, ranging between 4.6 and 4.9 years despite evolving market conditions.
Key Takeaways
• Net investment income in 2025 softened from the prior year, as lower equity dividend income more than offset higher income from fixed income investments.
• Bonds remained the dominant asset class, with allocations largely unchanged over the past four years. Their contribution to earned investment income rose to a decade-high 63%.
• Risk asset allocations continued to decline over the past five years. Excluding the impact of a large outlier insurer, the industry maintains a structurally lower allocation to risk assets.
• Fixed income allocations continued to shift, with tax-exempt municipals declining to less than 10% of fixed income holdings, while structured securities increased.
• Book yields continued to rise, reaching a decade high in 2025, while credit quality improved and duration remained stable.
A customized enterprise comparative assessment can provide deeper insight into how an insurance company’s asset and liability characteristics compare with peer organizations. This supports more informed, risk-aligned investment decisions.
Endnotes
1 For purposes of this publication, the U.S. P&C industry consists of companies with invested assets greater than $50 million and net written premium greater than $10 million as of year-end 2025. Insurers writing exclusively or predominantly financial lines are excluded from the analysis
2 NAIC 20 rating categories became effective in 2020.