



Executive Summary
In this issue, we analyze the enterprise profile of U.S. medical professional liability (MPL) insurers and compare their investment trends with those of the broader U.S. property and casualty (P&C) industry. The MPL composite’s net investment income (%) continued to increase in 2025, while the broader P&C industry experienced a decline. Within fixed income portfolios, the MPL composite generated a lower book yield despite maintaining average credit quality and duration comparable to those of the broader P&C industry. In terms of sector allocation, the MPL composite was overweight in agency residential mortgage-backed securities (RMBS) and underweight in tax-exempt municipal bonds and government/agency bonds relative to the P&C industry. MPL insurers that assumed greater investment risk, particularly larger firms, tended to achieve higher book yields, suggesting that selective risk-taking may be an important driver of higher fixed income book yields.
SCOPE OF ANALYSIS
We use an MPL composite of 110 insurers that primarily or exclusively underwrite medical professional liability (MPL) insurance.1 The MPL composite is compared with a U.S. P&C industry composite comprising other insurers that collectively represent the broader P&C industry, excluding those included in the MPL composite. Berkshire Hathaway (BRK) is generally excluded from the P&C industry composite to avoid distortion arising from the company’s outsized investment portfolio, particularly its significant allocations to equities and alternative investments. Unless otherwise noted, all exhibits are based on statutory filing data as of December 31, 2025 from S&P Capital IQ Pro, and are supplemented with data from other sources, including NEAM and ICE BofA.
MPL COMPOSITE’S ENTERPRISE PROFILE
Similar Investment Leverage and Lower Premium Leverage
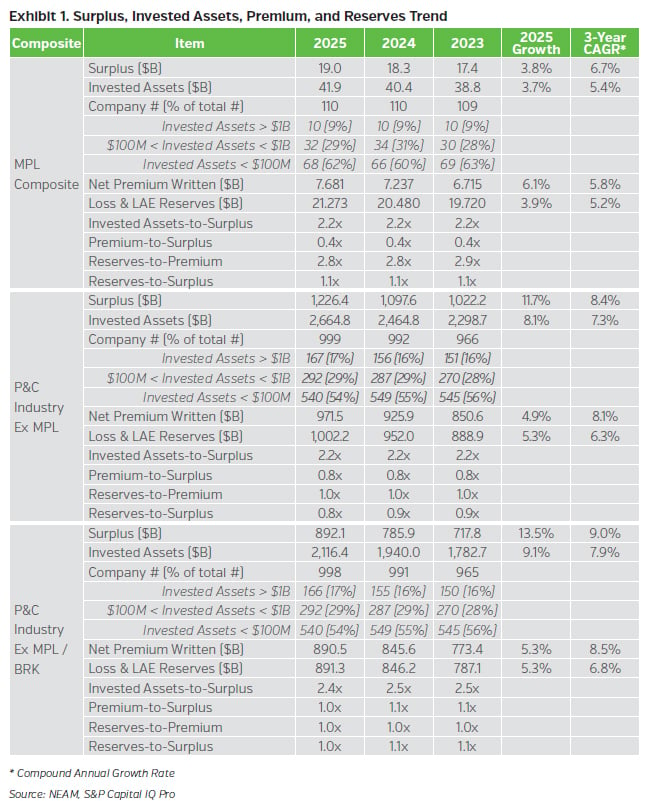
Exhibit 1 compares statutory surplus, total invested assets, net premiums written, and net loss and loss adjustment expense reserves for the MPL composite and the broader P&C industry from 2023 through 2025. The MPL composite maintained investment leverage, measured by the invested assets-to-surplus ratio, broadly in line with the P&C industry. However, it operated with materially lower premium leverage, measured by the net premiums written-to-surplus ratio, and a higher reserves-to-premium ratio, both of which are consistent with the longer-tailed nature of MPL business. MPL writers also tended to be smaller than their broader P&C counterparts, with more than 90% holding less than $1 billion in invested assets. Over the three-year period, the P&C industry recorded stronger growth in statutory surplus, invested assets, net premiums written, and net reserves relative to the MPL composite.
A LOOK AT THE MPL COMPOSITE’S ASSET CHARACTERISTICS
The MPL Composite’s Net Investment Income (%) Continued to Improve in 2025
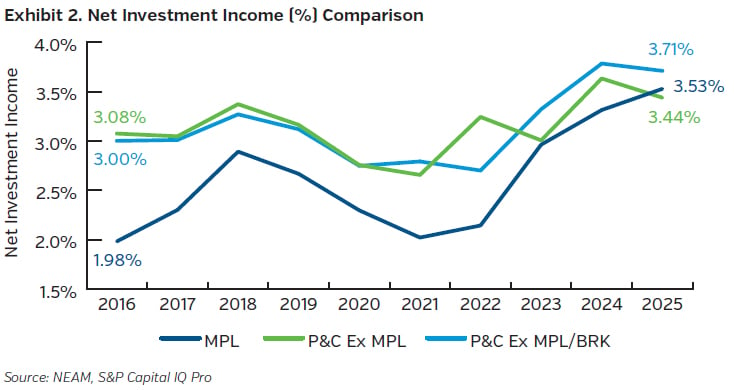
Exhibit 2 compares net investment income (%) for the MPL composite with that of the P&C industry excluding MPL composite and BRK (P&C ex MPL/BRK). The MPL composite’s net investment income (%) continued to improve in 2025, reaching 3.53%, compared with 3.71% for P&C ex MPL/BRK. Accordingly, while MPL insurers continued to benefit from improving investment income, they remained below P&C ex MPL/BRK in 2025.
Asset Allocations Broadly Similar to P&C Ex MPL/BRK
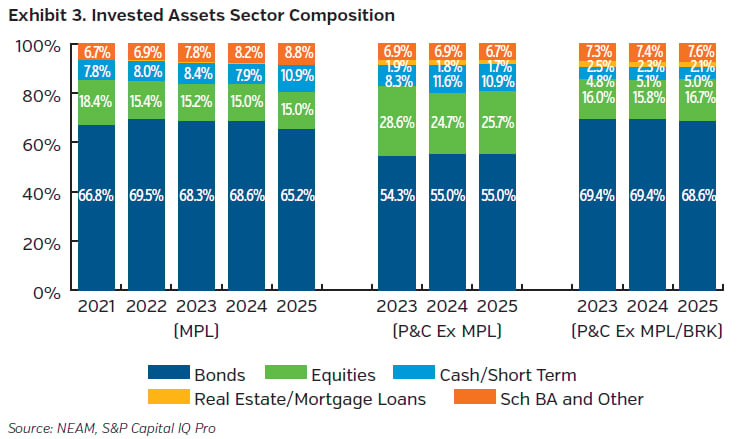
As shown in Exhibit 3, the MPL composite’s overall asset allocation was broadly similar to that of P&C ex MPL/BRK. In 2025, the MPL composite reduced its bond allocation while increasing cash and short-term investments. Schedule BA exposure continued to rise, reaching 8.8%, compared with 7.6% for P&C ex MPL/BRK. The primary difference between the two groups was the MPL composite’s higher allocation to cash and short-term investments.
Risk Assets as a Percentage of Surplus Lower than the P&C Ex MPL/BRK
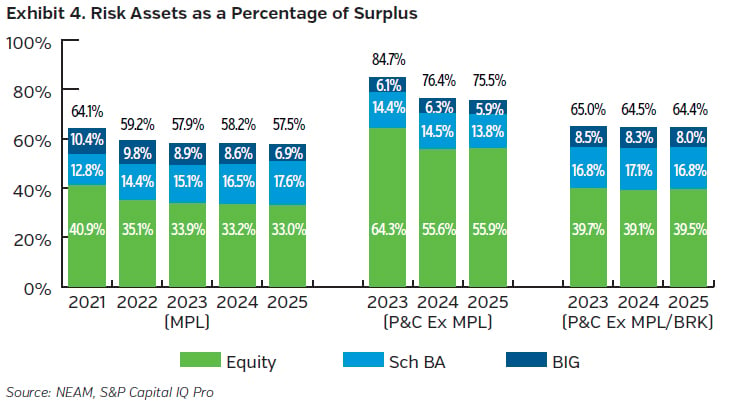
We define equities, fixed income assets rated below investment grade (BIG), and Schedule BA assets as risk assets. Exhibit 4 compares risk assets as a percentage of surplus for the MPL composite and P&C ex MPL/BRK. At year-end 2025, the MPL composite’s risk assets represented 57.5% of surplus, compared with 64.4% for P&C ex MPL/BRK.
Gap in Book Yield Remained Narrow
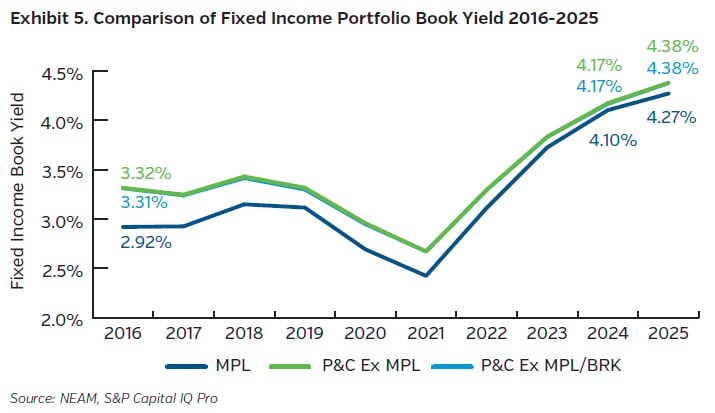
As shown in Exhibit 5, the MPL composite’s fixed income portfolio generated lower book yields than the P&C industry over the past decade. After peaking at 40 bps in 2016, the book yield gap between the two groups narrowed to 7 bps in 2024 before modestly widening to 11 bps at year-end 2025. Book yields for both groups continued to increase in 2025 for the fourth consecutive year, reflecting the higher-yield environment since 2022. Given BRK’s limited share of the P&C industry bond holdings,2 excluding BRK has minimal impact on the fixed income comparison.
Fixed Income Sector Allocations Broadly Similar
Exhibit 6 shows the fixed income sector allocations of the MPL composite and the P&C industry. Overall, the two groups maintained broadly similar fixed income sector allocations, although the MPL composite was overweight in agency residential mortgage-backed securities (RMBS) and underweight in both tax-exempt municipal bonds and government/agency bonds. The two groups gradually increased their allocations to most structured securities, particularly agency RMBS, while reducing their allocations to tax-exempt municipal bonds. Allocations to taxable municipal bonds also declined modestly, reflecting reduced issuance since 2022.
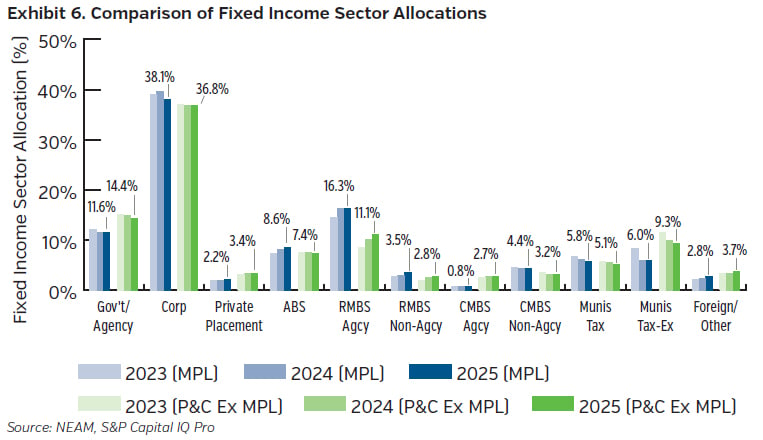
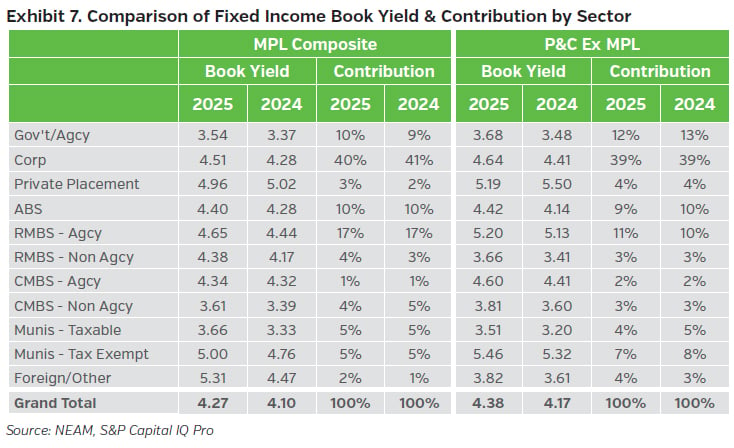
Exhibit 7 illustrates each fixed income sector’s average book yield and its contribution to total book yield for the MPL composite and the P&C industry. Each contribution is calculated by multiplying the sector’s allocation by its average book yield for the corresponding year and is expressed as a percentage of total portfolio book yield. While corporate bonds remained the largest contributors for both groups, the MPL composite derived greater contributions from agency RMBS due to its higher allocation to the sector. The P&C industry generated larger contributions from government/agency bonds and tax-exempt municipal bonds.
Similar Credit Quality to P&C Ex MPL
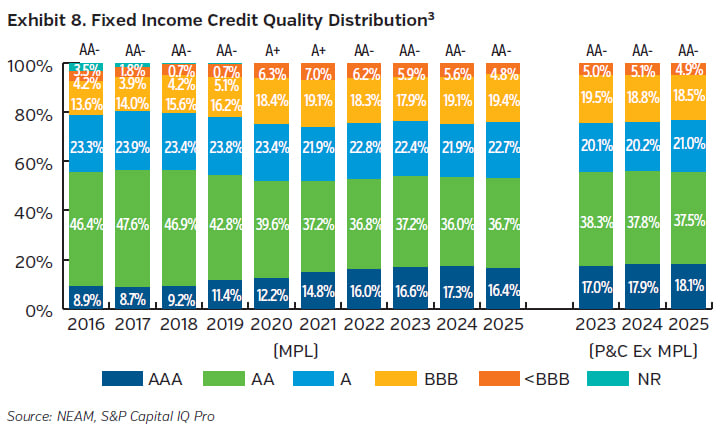
Exhibit 8 illustrates the fixed income credit quality trend over time for both the MPL composite and the P&C industry. The MPL composite’s AAA allocation decreased in 2025 after increasing consistently since 2018, while allocations to the other investment-grade categories (AA, A, and BBB) all increased. The BIG allocation continued to decline, falling below 5% at year-end 2025. Prior to 2022, amid a prolonged low-yield environment, MPL writers increased their allocations to BBB and BIG bonds in pursuit of higher income, resulting in average credit quality briefly declining from AA- to A+. However, since 2022, following the onset of the Federal Reserve’s tightening cycle, many MPL writers have shifted their investments toward higher-rated bonds, particularly AAA-rated securities, to take advantage of elevated yields available in sectors such as MBS and asset-backed securities (ABS). Overall, the MPL composite’s credit quality profile remained broadly consistent with that of the P&C industry, with only marginal differences across rating categories.
Fixed Income Duration Marginally Shorter than the P&C Ex MPL
Exhibit 9 shows the option-adjusted duration (OAD) of the MPL composite’s fixed income portfolio by sector, alongside the total OAD of the P&C industry. Over the past decade, the OADs of the two groups remained relatively close, with a difference of 0.1 year or less from 2019 through 2023, before diverging again in 2024. In 2025, the MPL composite’s total OAD remained slightly shorter than that of the P&C industry.
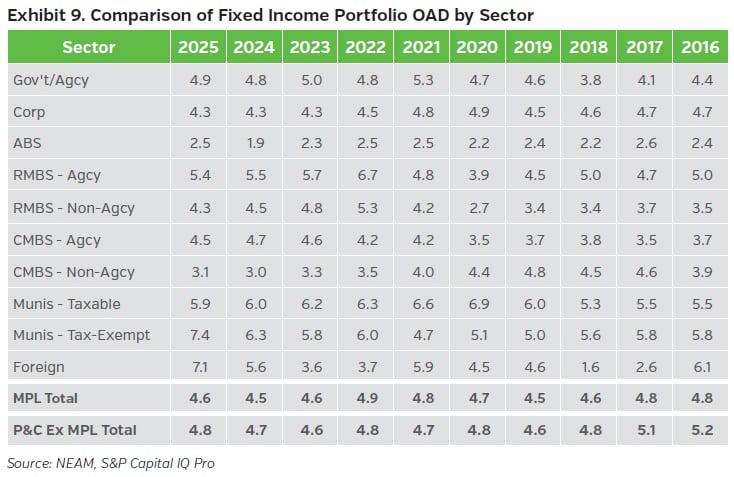
Exhibit 10 compares each sector’s contribution to total portfolio OAD. Similar to the book yield contribution calculation shown in Exhibit 7, each contribution is calculated by multiplying the sector’s allocation by its OAD for the corresponding year and is expressed as a percentage of total portfolio OAD. While agency RMBS contributed more to the MPL composite’s total OAD, tax-exempt municipal bonds played a larger role in the P&C industry, primarily due to their higher relative allocations.
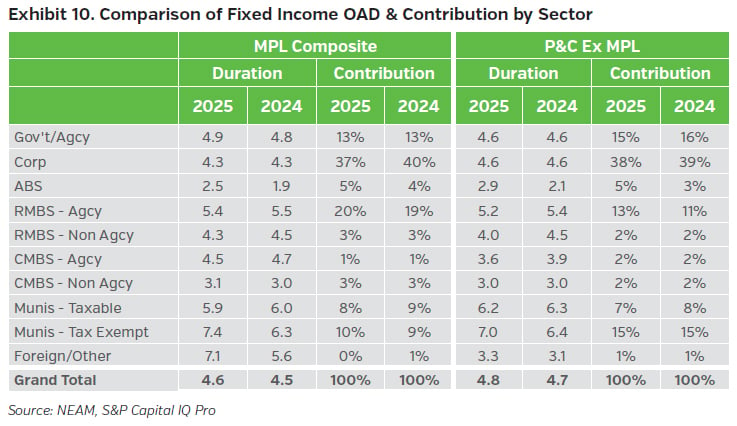
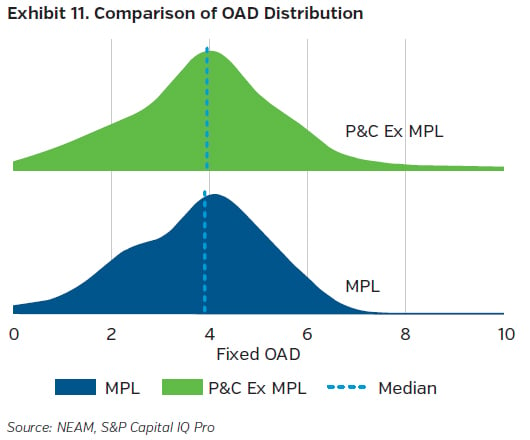
Exhibit 11 compares the fixed income OAD distributions of the MPL composite and the P&C industry. Despite the distinct nature of their businesses, as evidenced by the contrasting reserves-to-premium ratios shown in Exhibit 1, the two groups exhibited similar OAD distributions in 2025. Except for a small segment of the P&C industry exhibiting especially long OADs (>7 years), the distributions were broadly comparable, with closely aligned median values.
Higher Risk Scores Were Associated with Higher Book Yields
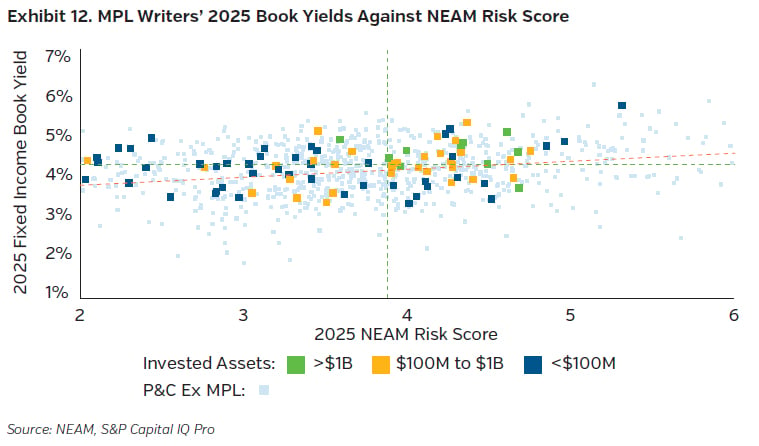
NEAM estimates a Risk Score based on duration, credit quality, and convexity to provide a unified measure of investment risk for fixed income portfolios. Exhibit 12 illustrates the relationship between individual MPL writers’ book yields and this Risk Score in 2025. Individual MPL writers are represented by squares and color-coded by invested asset size. Smaller light blue dots represent other P&C writers, while the industry median Risk Score and book yield are indicated by green dotted lines.4
The positive slope of the orange dotted trendline suggests that, across the broader industry (including both MPL and other P&C insurers), higher Risk Scores were generally associated with higher book yields. Large MPL insurers (green), with invested assets exceeding $1 billion, tended to cluster in the upper-right quadrant, achieving higher yields while assuming greater risk, reflecting exposure to lower-rated, longer-duration, and more negatively convex fixed income assets. Medium-to-large insurers (yellow), with invested assets between $100 million and $1 billion, were broadly dispersed, reflecting diverse approaches to balancing risk and return. Medium-to-small insurers (dark blue), with invested assets below $100 million, were more likely to be located on the left side of the chart and exhibited lower Risk Scores, consistent with their more conservative portfolio strategies.
KEY TAKEAWAYS
We constructed an MPL composite of 110 firms to assess how the sector’s unique liability profile influences investment decisions relative to the rest of the U.S. P&C industry.
• MPL insurers maintained similar investment leverage to the P&C industry but materially lower premium leverage, consistent with their longer-tailed liabilities.
• Net investment income (%) for MPL insurers continued to improve in 2025, although it remained below the P&C industry excluding MPL composite and BRK.
• Fixed income book yields remained modestly below P&C excluding MPL composite, despite broadly similar sector allocations and credit quality.
• Despite MPL’s longer-tailed liabilities, fixed income credit quality and duration remained broadly comparable to P&C excluding MPL composite.
• Higher fixed income risk was generally associated with higher book yields, with larger MPL insurers tending to assume more risk than smaller peers.
Endnotes
1 P&C insurers operating as of year-end 2025 whose business focus was “Commercial Medical Malpractice” according to S&P Global, where medical malpractice represents the highest net premiums written among their lines of business, and where the difference between medical malpractice and the second-highest line is at least 15% of total net premiums written.
2 At year-end 2025, BRK’s bond holdings were ~$12 billion, compared to stocks of ~$332 billion and other investments of ~$19 billion. Given its limited impact, we will not show the “P&C industry excluding MPL/BRK” as a comparison in the subsequent exhibits related to the fixed income portfolio.
3 NAIC 20 rating categories became effective in 2020.
4 Industry median values were derived from only sizable companies (invested assets > $50 million) to enhance the credibility of the results.